1038
Experimental Validation of Subject-Specific Local SAR Assessment by Deep Learning1Center for Image Sciences, University Medical Center Utrecht, Utrecht, Netherlands, 2MR Code BV, Zaltbommel, Netherlands, 3Biomedical Image Analysis, Eindhoven University of Technology, Eindhoven, Netherlands
Synopsis
Subject-specific local SAR assessment is one of the outstanding challenges of ultra-high field MRI. In this work, we present experimental, in-vivo results on four healthy subjects of a novel deep learning approach which provides online subject-specific local SAR distributions based on measured B1+ maps. Results are validated by creating a subject-specific model of each subject and calculate a reference local SAR distribution off-line by FDTD simulations. The results show that a Convolutional Neural Network (CNN) trained with synthetic MR data enables accurate subject-specific local SAR prediction during an MRI examination.
PURPOSE
During an MRI examination, subject-specific local SAR cannot be measured, thus it is usually determined by off-line electromagnetic simulations using generic body models and the results are used as an estimate of the actual peak local SAR value1,2,3. However, this approach requires additional safety factors to compensate for the deviations between the generic simulated model and the real, subject-specific, scenario.
Recently, a new approach based on deep learning was presented4. It consists of data-driven approach where a convolutional neural network (CNN) is trained to learn a “surrogate SAR model” to map the relation between subject-specific available MR data and the corresponding local SAR. In this work, we present the first in-vivo results of this on-line subject-specific local SAR assessment.
MATERIAL AND METHODS
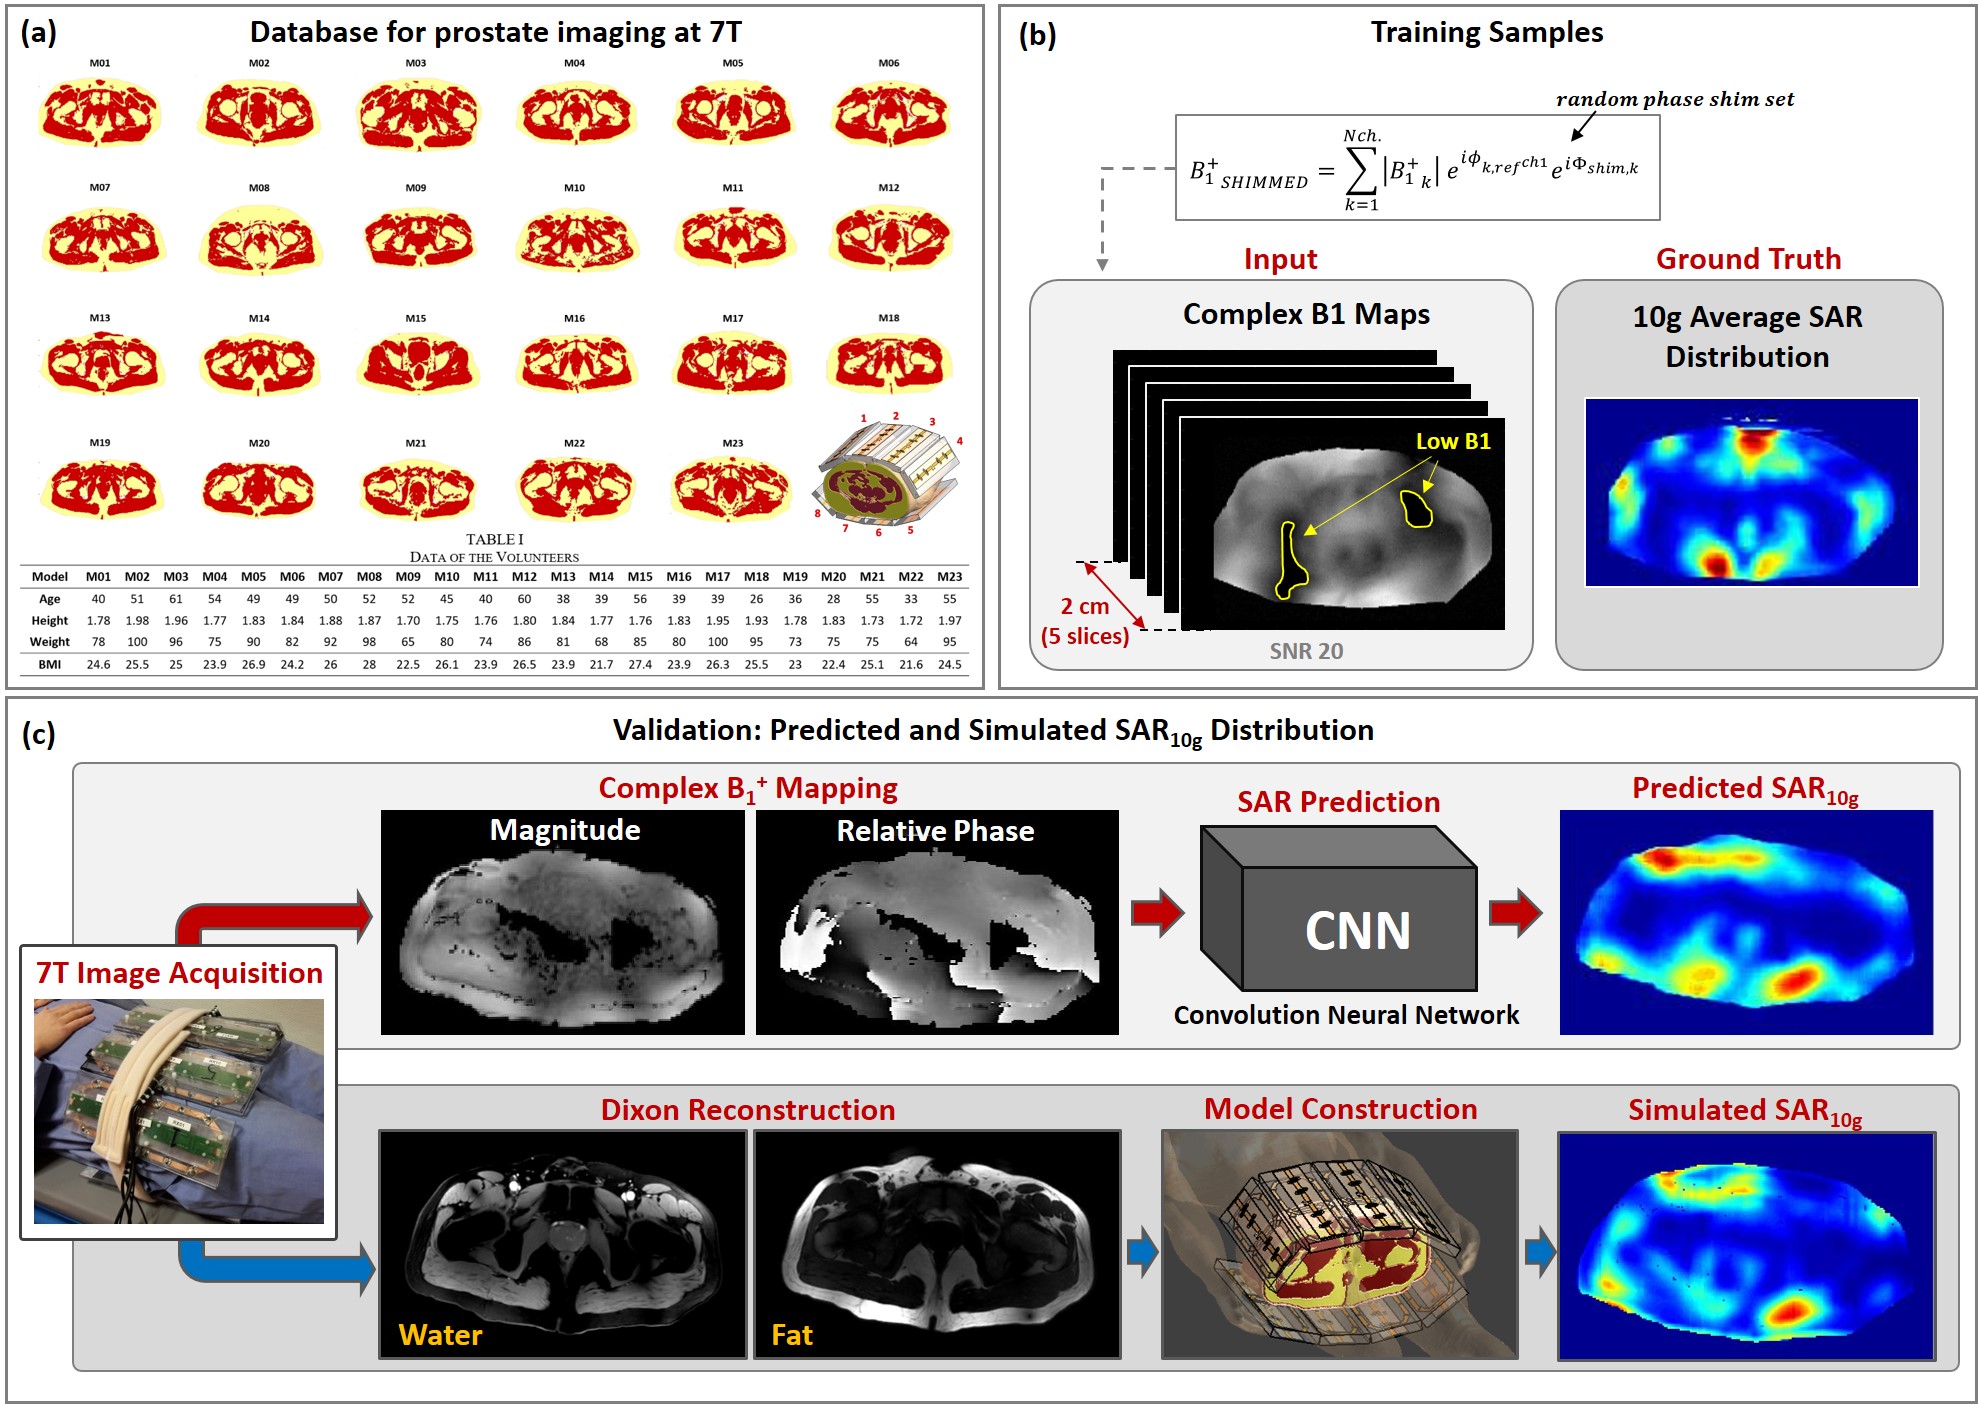
Similarly to4, a Conditional Generative Adversarial Networks (cGAN)5 was trained to map the relation between the complex B1+map, i.e. B1+ magnitude and relative phase, and the 10g-average SAR (SAR10g) distribution. The training was performed using simulated data by penalizing the underestimation error more4. Then, the trained network was used to predict SAR10g distributions based on measured B1+maps. For the validation, another independent pipeline was implemented to obtain simulated SAR10g distributions by constructing dedicated models.
Synthetic Training set
A synthetic image dataset was generated by means of our database containing simulated B1+ distributions and Q-Matrices1 of 23 subject-specific models6 with a 8-fractionated dipole array for prostate imaging at 7T7(Figure 1.a). These simulated results were processed to produce 23x250=5750 different local SAR distributions (250 random phase settings for each model).
The extent of the averaging 10g cubes in the pelvic region is about 2cm, thus to capture all required information, each training sample consists of a volume of 5 consecutive, complex transverse B1+maps 0.5cm distance apart from one another, and the corresponding ground-truth SAR10g distribution for the center slice (Figure 1.b).
To produce training samples with complex B1+maps similar to those that can be realistically acquired, the relative transmit B1+ phase distributions were obtained with respect to the first channel. Furthermore, since the DREAM8 method only presents a good accuracy for STEAM flip angles from 10° to 70°, the B1+map regions outside this range were removed (Figure 1.b).
In-Vivo Validation
Four healthy volunteers not included in our database (BMI: 21/23/24/27 kg/m2) were scanned at 7T (Achieva, Philips Healthcare, Best, The Netherlands) with a 8-channel fractionated dipole array for prostate imaging6. Written consent was obtained according to local IRB regulations.
Image Acquisition: The following sequences were performed (FOV=430x430x100mm, Voxel size=2.8x2.8x5.0mm):
- B1default: DREAM B1-mapping with default phase settings (TR/TE=4.0/0.8ms,STEAM flip angle=40°);
- B1shimmed: DREAM B1-mapping with prostate shimmed phase settings $$$p$$$ (TR/TE=4.0/0.8ms,STEAM flip angle=40°);
- FFE-dynamic: 3D Fast Field Echo with subsequently each transmit channel active alone (TR/TE=5.00/1.95ms,flip angle=1°);
- DIXON: M2D Fast Field Echo (TR/TE=10.00/2.70ms,Voxel size=1.3x1.3x5.0mm).
Complex $$$B_1^+$$$Maps: The measured images were combined as follows to obtain complex B1+maps:
$$B1_{default}^{Measured}=|B1default|\exp\left(i\arg\left(\frac{\sum_{n=1}^{N_{ch}}\left(|FFE_{dyn}\left(n\right)|\exp\left(i\Phi\left(FFE_{dyn}\left(n\right)\right)\right)\right)}{\exp\left(i\Phi\left(FFE_{dyn}\left(1\right)\right)\right)}\right)\right)$$
$$B1_{shimmed}^{Measured}=|B1shimmed|\exp\left(i\arg\left(\frac{\sum_{n=1}^{N_{ch}}\left(|FFE_{dyn}\left(n\right)|\exp\left(i\Phi\left(FFE_{dyn}\left(n\right)+p\left(n\right)\right)\right)\right)}{\exp\left(i\Phi\left(FFE_{dyn}\left(1\right)\right)\right)}\right)\right)$$
Predicted $$$SAR_{10g}$$$ Distribution: The obtained complex B1+maps were the input for the trained cGAN to generate the predicted SAR10g distributions (Figure 1.c).
$$SAR_{10g}^{Predicted}=cGAN\left(B1^{Measured}\right)$$
Simulated $$$SAR_{10g}$$$ Distribution: Following the pipeline presented in6, the DIXON images were used to build subject-specific 3-tissue models (fat/muscle/skin) of the volunteers and EM simulations (Sim4Life,ZurichMedTech,Switzerland) were performed (Figure 1.c).
For each model, the drive vector $$$s$$$ to minimize the L2-norm between the simulated and measured complex B1+maps was evaluated numerically and used to calculate the reference SAR10g distribution.
$$SAR_{10g}^{Simulated}=s^{\dagger}Q_{10g}s$$
RESULTS AND DISCUSSION
The cGAN5 was implemented in TensorFlow and trained for about 4 hours on a GPU (NVIDIA Tesla P100-PCIe-16GB).
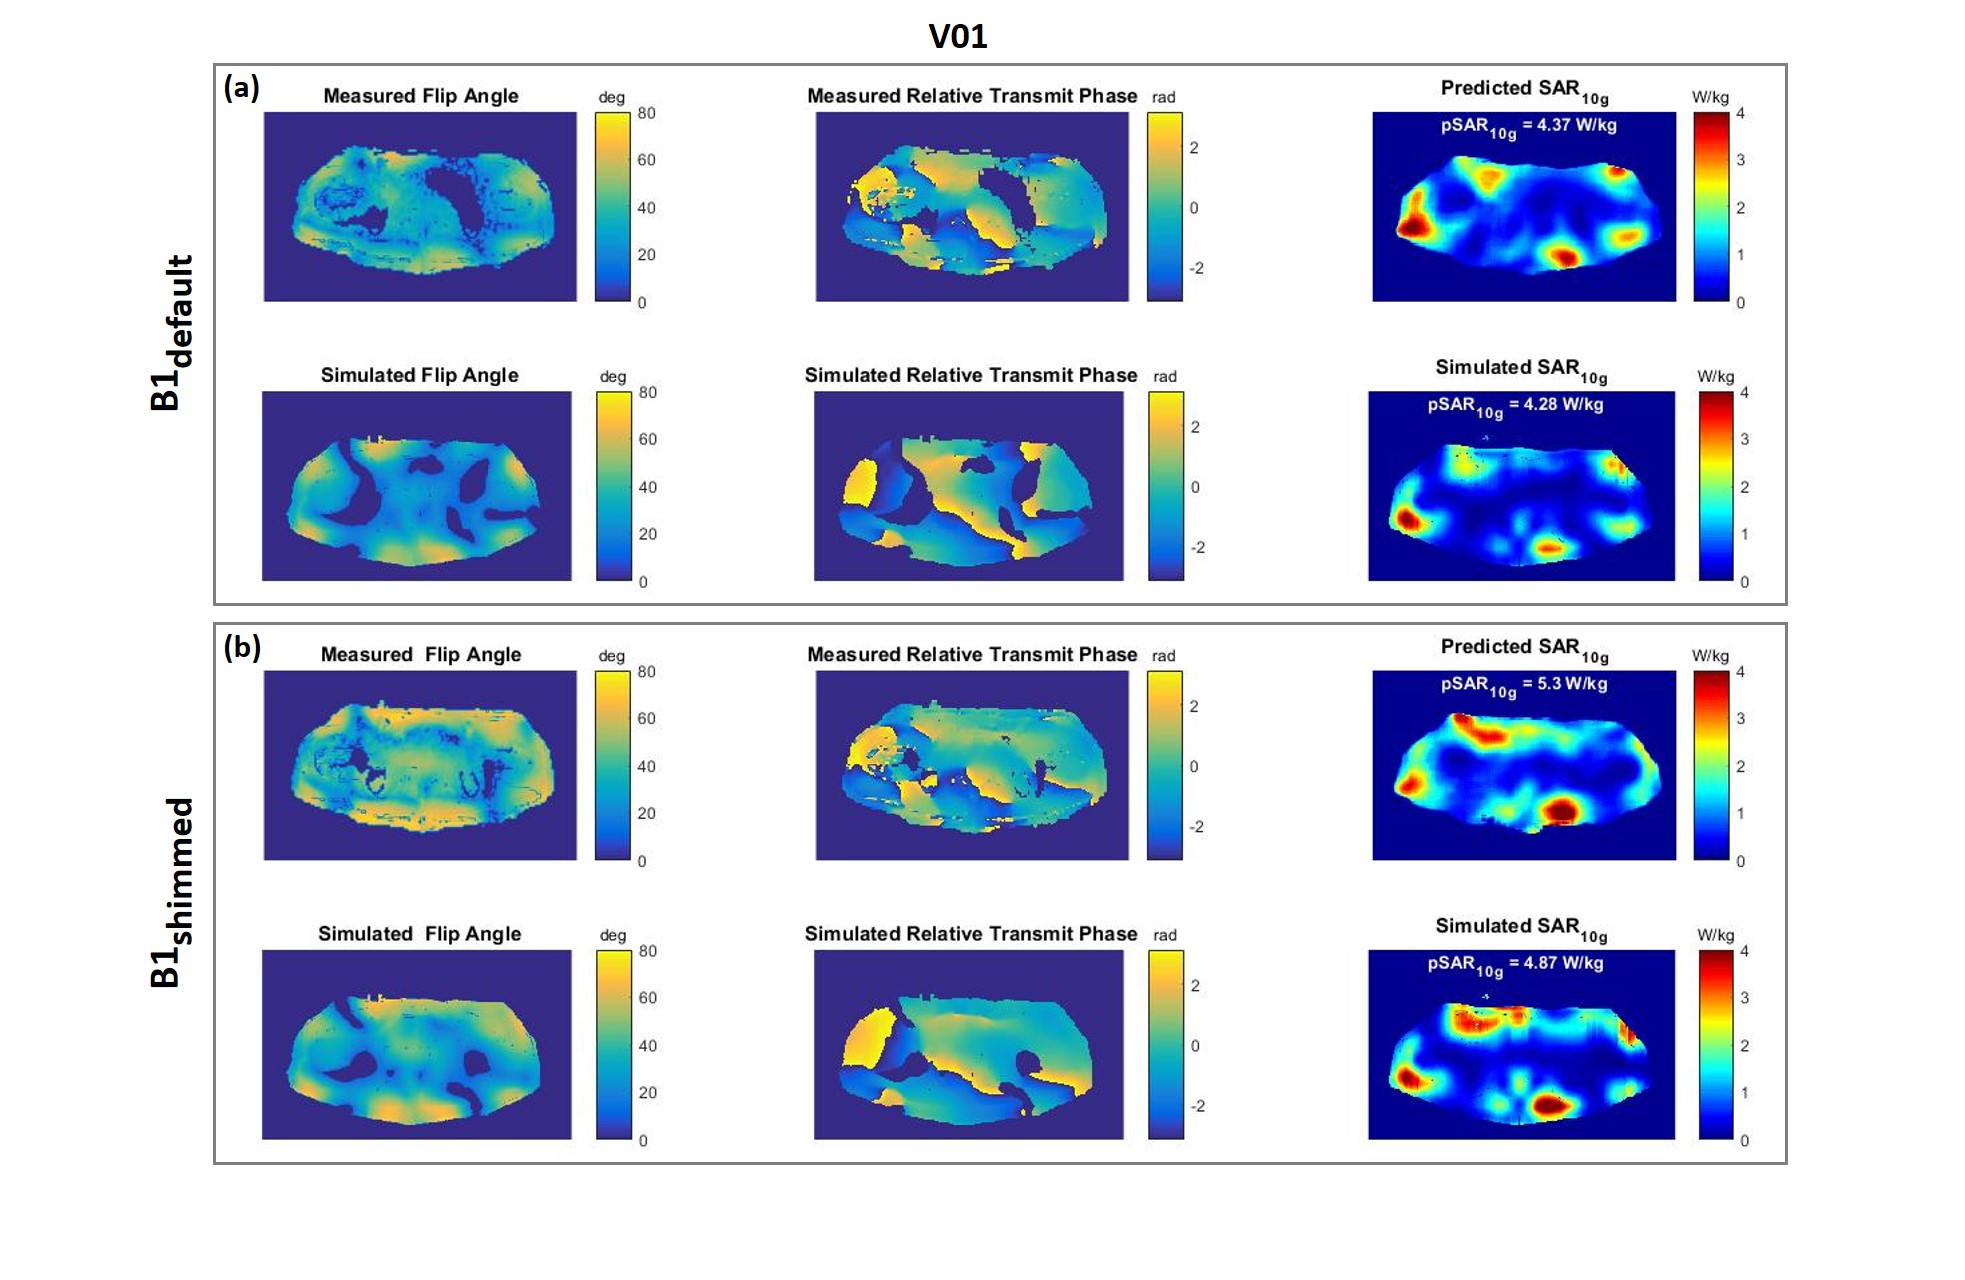
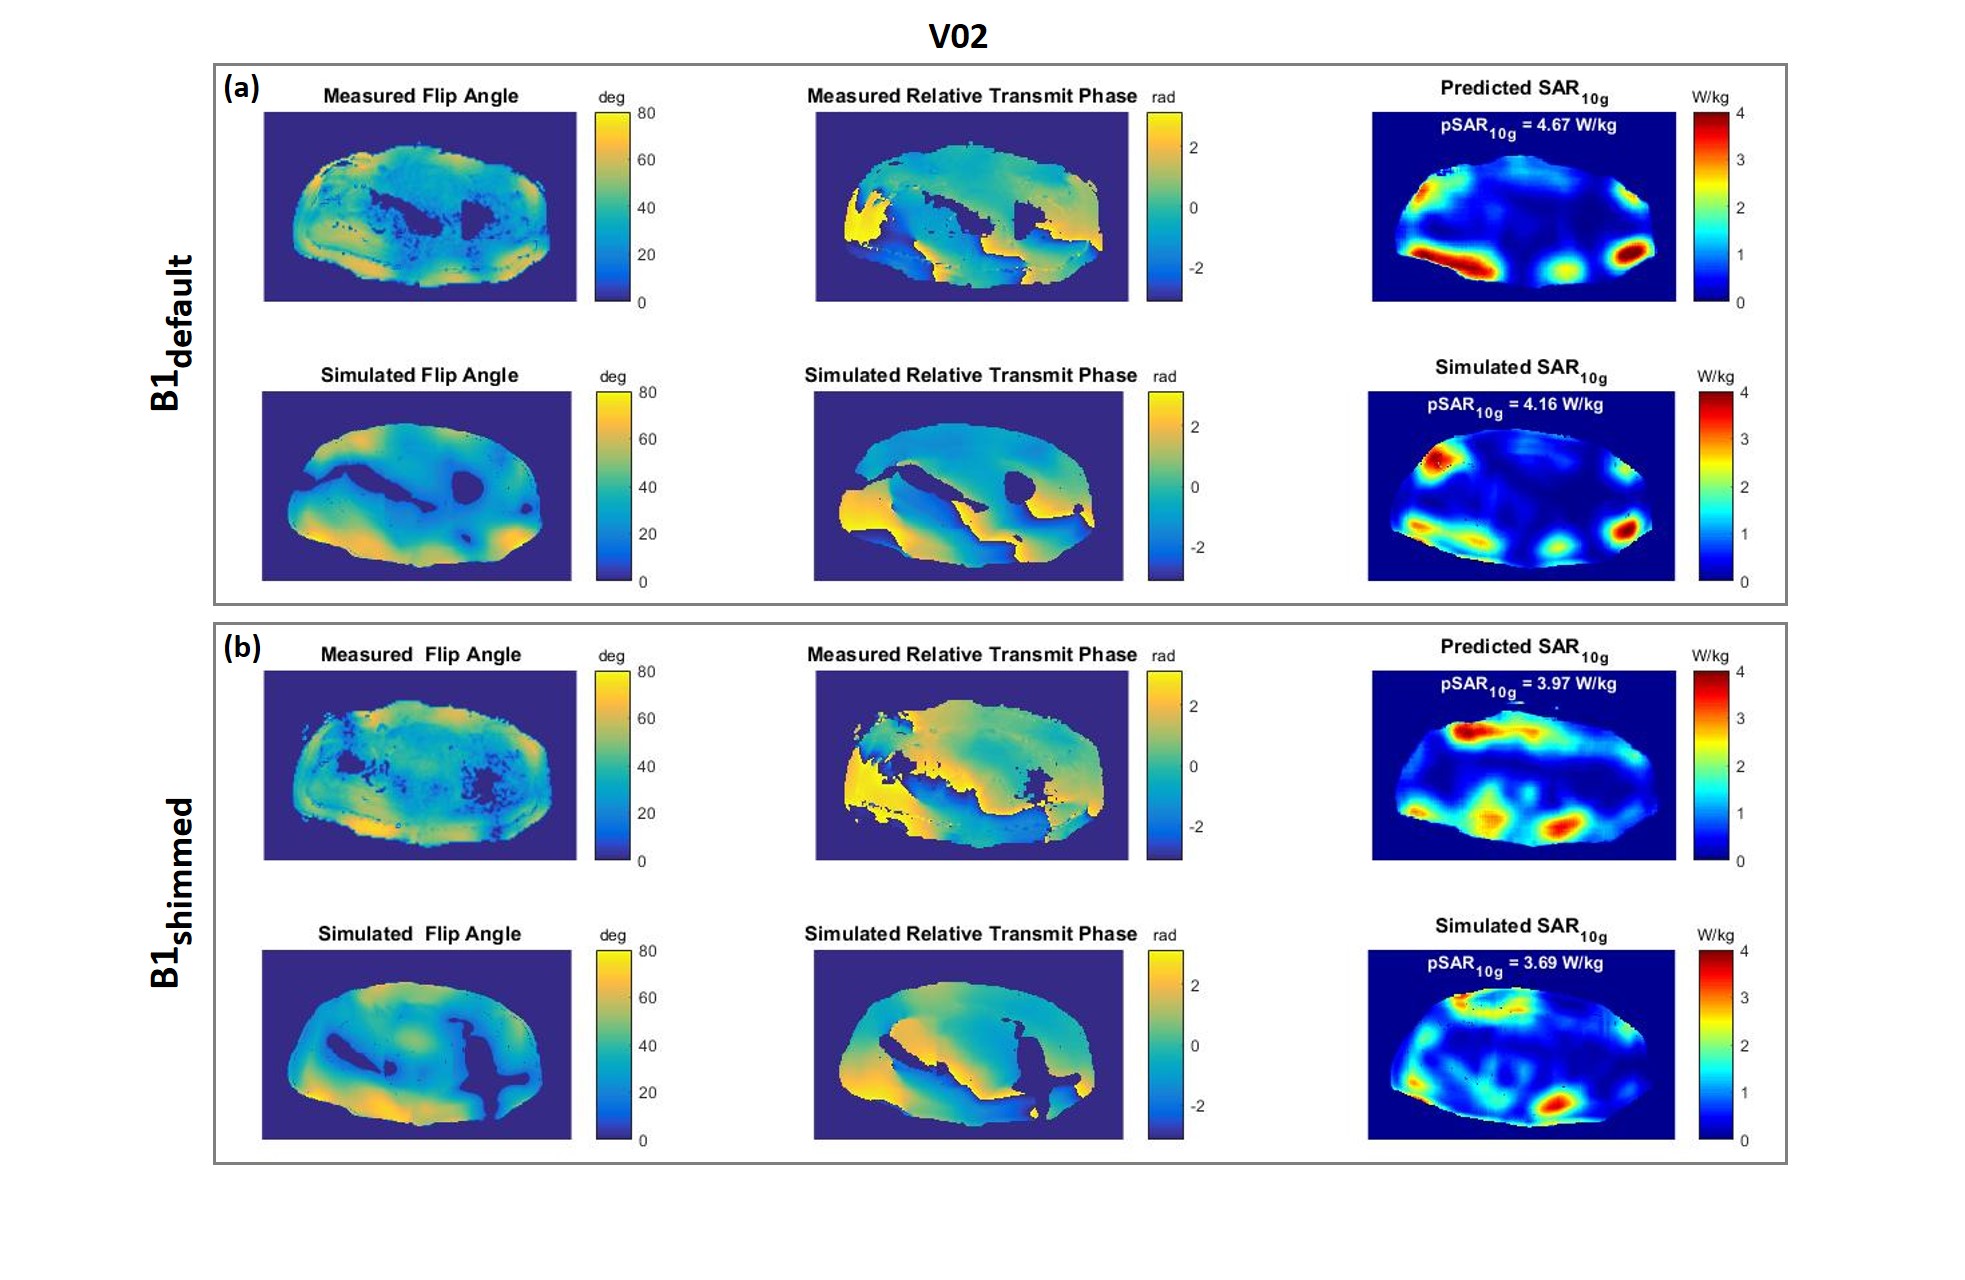
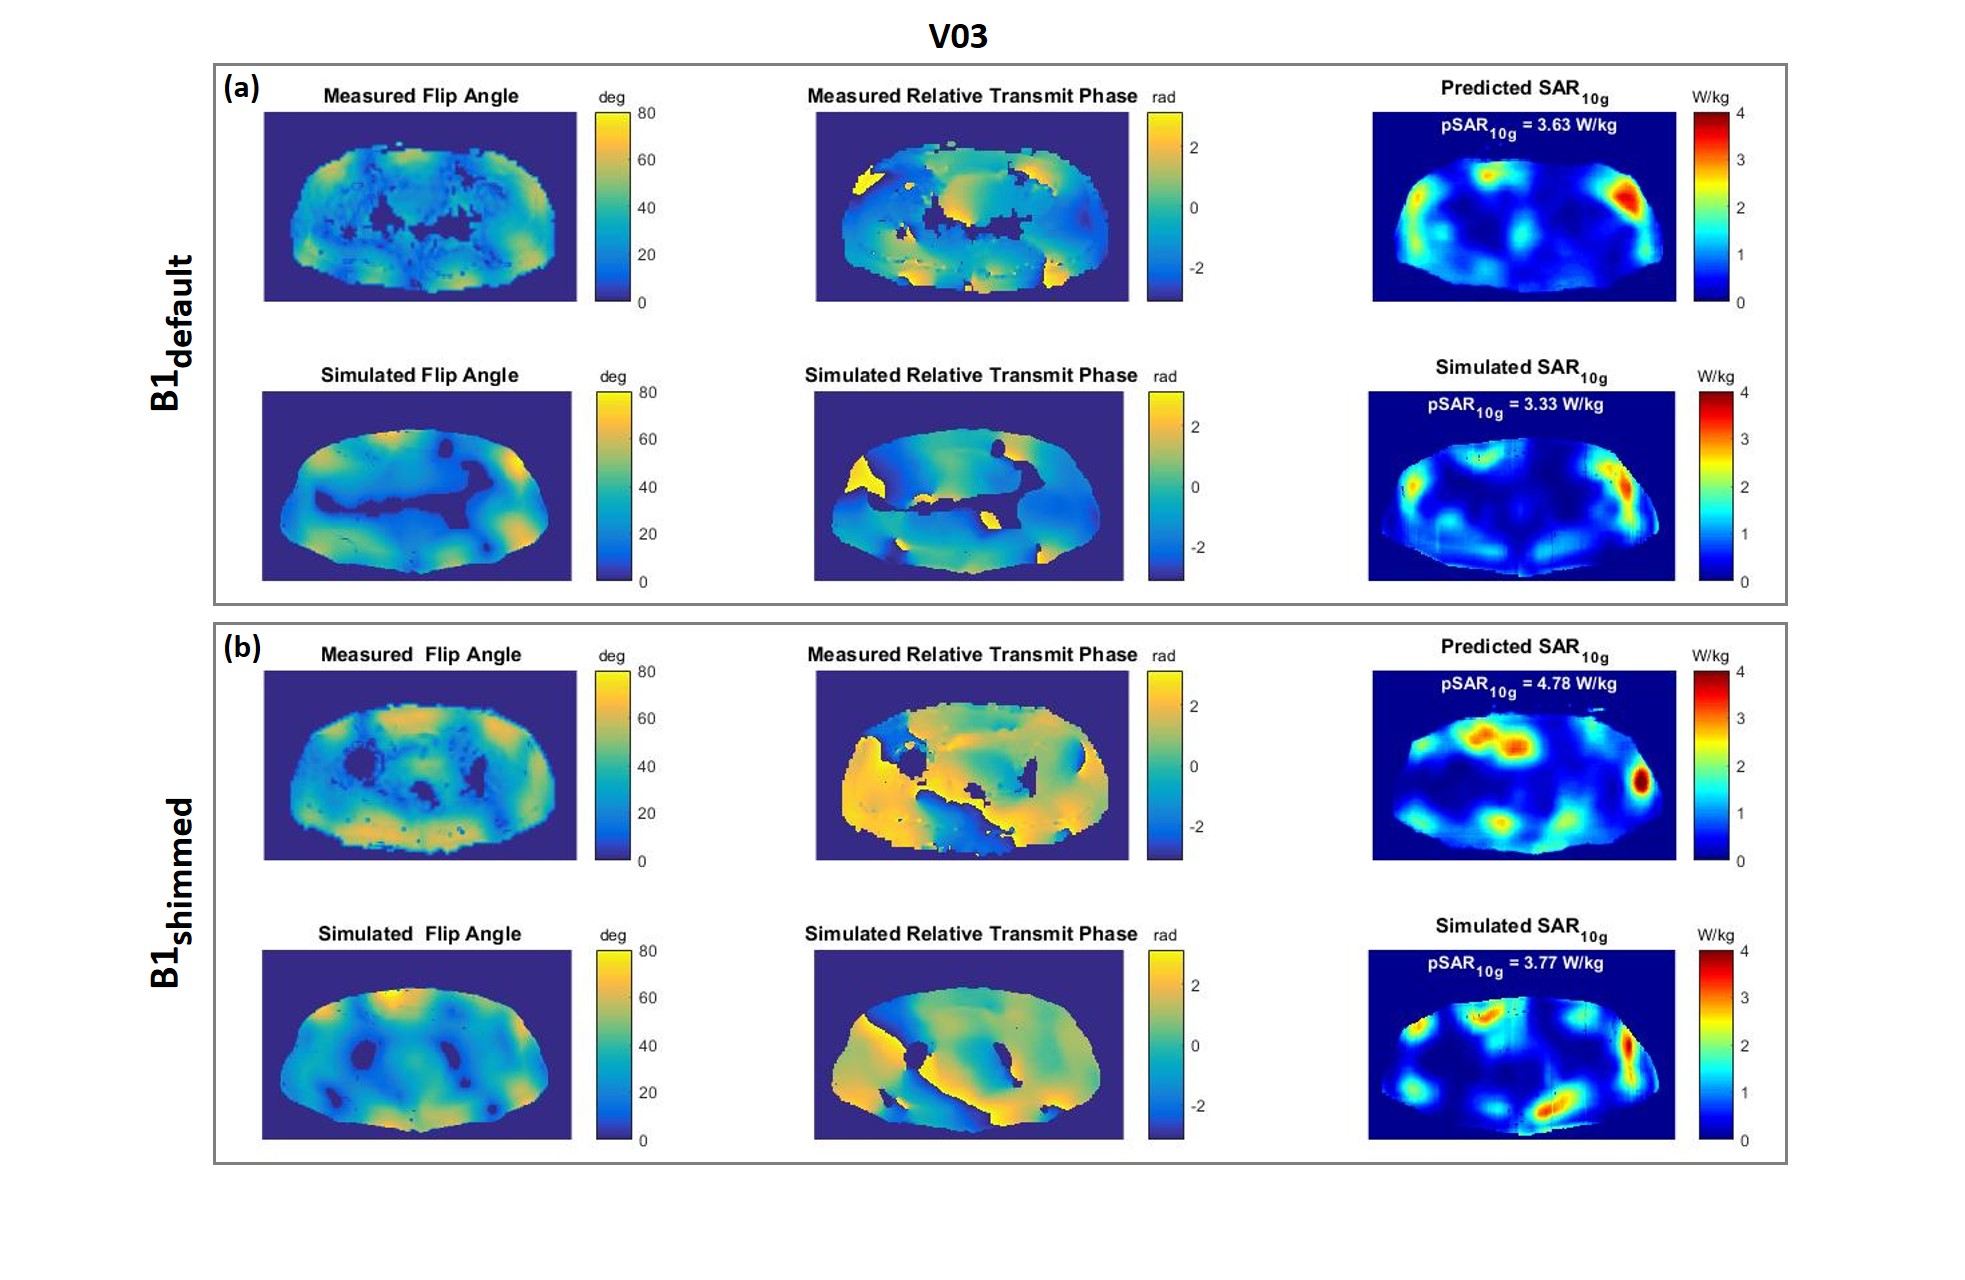
In Figures 2-5, the measured and the simulated complex B1+maps, and the predicted and simulated SAR10g distributions are reported for each volunteer. Above each SAR10g distribution the peak value (pSAR10g) is reported. All validation tests showed a good qualitative and quantitative match between predicted and simulated SAR10g distributions. In agreement with our previous study4, moderate pSAR10g overestimation errors were observed (between 2% and 21%). Only one pSAR10g underestimation error occurred (2%).
Note that complex B1+maps inherently include all relevant and exam specific information such as the patient anatomy, antenna position and reflected/lost power.
CONCLUSION
The proposed deep learning approach allows image-based subject-specific local SAR assessment which greatly diminishes the uncertainty in current state-of-the-art SAR assessment compared to standard procedures which use generic models, per channel forward/reflected power monitoring and conservative safety factors. We have shown that, in about 1sec, it adequately predicts local SAR within 21% accuracy for four investigated subjects at 7T based on measured B1+ maps. The proposed method can easily be integrated into MRI protocols. Thus, the reduced uncertainty in local SAR assessment will reduce scanning constraints and, thereby, speed up SAR-constrained sequences.Acknowledgements
No acknowledgement found.References
1I. Graesslin, H. Homann, S. Biederer, P. Börnert, K. Nehrke, P. Vernickel, G. Mens, P. Harvey, U. Katscher, A specific absorption rate prediction concept for parallel transmission MR. Magn Reson Med. 2012 Nov;68(5):1664-74.
2G. Eichfelder and M. Gebhardt, Local Specific Absorption Rate Control for Parallel Transmission by Virtual Observation Points, Magn. Reson. Med. 2011, vol. 66, no. 5, pp. 1468-1476.
3A. Sbrizzi, H. Hoogduin, J.J. Lagendijk, P. Luijten, G.L. Sleijpen and C.A.T van den Berg. Fast design of local N‐gram‐specific absorption rate–optimized radiofrequency pulses for parallel transmit systems. Magnetic resonance in medicine, 67(3), 824-834.(2012).
4E.F. Meliadò, A.J.E. Raaijmakers, M.H.F. Savenije, A. Sbrizzi, M. Maspero, P.R. Luijten, and C.A.T van den Berg. On-line Subject-Specific Local SAR Assessment by Deep Learning. Proceedings of the ISMRM 26th Annual Meeting, Paris, 16-21 June 2018.
5P. Isola, J. Zhu, T. Zhou, A.A. Efros, Image-to-Image Translation with Conditional Adversarial Networks, arXiv:1611.07004v1 [cs.CV] 21 Nov 2016.
6E.F. Meliadò, C.A.T van den Berg, P.R. Luijten, A.J.E. Raaijmakers. Intersubject specific absorption rate variability analysis through construction of 23 realistic body models for prostate imaging at 7T. Magn Reson Med. 2018;00:1–14. https://doi.org/10.1002/mrm.27518.
7A.J.E. Raaijmakers, M. Italiaander, I.J. Voogt, P.R. Luijten, J.M. Hoogduin, D.W.J. Klomp, C.A.T. van den Berg. The fractionated dipole antenna: A new antenna for body imaging at 7 Tesla. Magn Reson Med. 2015 May 2 : 10.1002/mrm.25596. Published online 2015 May 2. doi: 10.1002/mrm.25596.
8K. Nehrke and P. Börnert. DREAM—a novel approach for robust, ultrafast, multislice B1 mapping, Magnetic Resonance in Medicine 68:1517–1526 (2012).
Figures