1034
Alternative linear post-processing method for calculating viscoelastic parameters of the liver from multi-frequency MR elastograms.Akira Yamada1, Hayato Hayashihara2, Yoshihiro Kitoh2, Yasuo Adachi2, Aya Shiobara2, and Yasunari Fujinaga1
1Radiology, Shinshu University School of Medicine, Matsumoto, Japan, 2Shinshu University Hospital, Matsumoto, Japan
Synopsis
An alternative linear post-processing method that enables fast and precise calculation of viscoelastic parameters (viscosity, η and elasticity, μ) of the liver from multi-frequency MR elastograms has been shown in this study. Correlation of viscoelastic parameters between linear and non-linear calculation methods was significantly high in phantom (r = 0.980 for μ, r = 0.983 for η) and patients study (r = 0.932 for μ, r = 0.935 for η). Calculation speed by linear method (0.42 s) was significantly faster than that by non-linear method (47.14 s). The proposed method will promote clinical application of viscoelastic analysis of liver diseases using MR elastography.
Background
Viscoelastic characterization of liver tissue using MR elastography (MRE) has been getting attention because correlation between viscoelastic parameters (viscosity, η and elasticity, μ) and histological changes in development of chronic liver diseases such as fibrosis and inflammation has been shown. These findings are especially important for distinguishing nonalcoholic fatty liver disease from simple steatosis in clinical liver imaging.1-3 Multi-frequency MRE and non-linear calculation method has been used as a standard method for estimating viscoelastic parameters of the liver.4 However, non-linear calculation method is time consuming and difficult to perform in clinical setting because dedicated post-processing application to calculate viscoelastic parameters has not been commercially available. Therefore, it is important to develop alternative simple post-processing method for promoting viscoelastic analysis of liver diseases using MRE. The purpose of this study is to develop fast and precise method for calculation of viscoelastic parameters using multi-frequency MRE.Methods
Observed velocity of elastic wave, Y(ω) was determined from perfect elastic body model elasticity, Μ(ω) on single-frequency MR elastogram by following equation: Y(ω) = (Μ(ω)/ρ)0.5, ω = 2πf. Where f and ρ are frequency of pneumatic driver and density. Theoretical velocity of elastic wave, υ(ω) in Voigt viscoelastic model was determined from following equations: υ(ω) = 1/Re|(ρ/G(ω))0.5|, G(ω) = μ + iωη, where G(ω) is complex shear module consist from viscosity (η) and elasticity (μ). Re|| means real part of complex number. Then, η and μ were determined by non-linear calculation method such as least square method minimizing cost function J = Σ{Y(ωn) - υ(ωn)}2/N (ωn: n = 1, 2, …N) using multi-frequency MRE.4 In Voigt viscoelastic model, squared absolute value for G(ω) with higher and lower angular frequencies (ωH and ωL) are given by following equations: |G(ωH)|2 = μ2 + ωH2η2, |G(ωL)|2 = μ2 + ωL2η2. Solving these equations, η and μ can be linearly approximated by following equations using perfect elastic body model elasticity, Μ(ω) on multi-frequency MR elastograms: η = α[{M(ωH)2 - M(ωL)2}/(ωH2 - ωL2)]0.5, μ = β[{ωL2|M(ωH)|2 - ωH2|M(ωL)|2}/(ωL2 – ωH2)]0.5, where α and β are proportional constants. Eventual value for viscoelastic parameters (η and μ) were determined by average of viscoelastic parameters (ηn and μn) obtained from all combination of 2 frequencies (ωHn and ωLn) from given number of frequencies N, (n = 1, 2, … NC2). Proportional constants α and β were determined from computer simulation with various η, μ, and f (0 < η < 20 Pas, 0 < μ < 20,000 Pa, 40 < f < 150 Hz). Correlation of obtained viscoelastic parameters and time to calculation were statistically analyzed between linear and non-linear methods by phantom and patients study using 1.5-T MR system. In phantom study, polyvinyl alcohol (PVA)-boric acid hydrogel phantom containing various viscoelastic properties prepared by mixing PVA solution (approximately 10 wt%) and boric acid solution (5, 10, and 20 wt%) was evaluated by multi-frequency MRE (f = 150, 130, 110, 90, 70 Hz). Calculation was repeated at every pixel (80 x 80 pixels) in phantom on MR elastograms filtered by 25 x 25 averaging filter. In patients study, consecutive 19 patients who underwent multi-frequency MRE (f = 80, 60, 40 Hz) for evaluation of chronic liver diseases were included. Calculation was performed using single region of interest (25 x 25 pixels) located in the liver on MR elastograms.Results
Linear approximation equations for viscosity (η) and elasticity (μ) obtained from computer simulation were as follows: η = 0.68675[{Μ(ωH)2 -Μ(ωL)2}/(ωH2 – ωL2)]0.5, μ = 1.0165[{ωL2Μ(ωH)2 – ωH2Μ(ωL)2}/(ωL2 – ωH2)]0.5. In PVA-boric acid hydrogel phantom study, correlation coefficient between viscoelastic parameters calculated by linear and non-linear methods were 0.980 (P < 0.001) for μ and 0.983 (P < 0.001) for η, respectively. Time for calculation was significantly short in linear method (0.42 s) compared to non-linear method (47.14 s) (P < 0.001). In patient study, correlation coefficient between viscoelastic parameters calculated by linear and non-linear methods were 0.932 (P < 0.001) for μ and 0.935 (P < 0.001) for η, respectively.Discussion
Correlation of viscoelastic parameters between linear and non-linear calculation methods was significantly high in phantom and patients study. Further more, calculation speed by linear method was significantly faster than that by non-linear method. These results assure clinical application of linear calculation method as an alternative to non-linear method that has been regarded as a standard in viscoelastic characterization by multi-frequency MR elastography.4Conclusion
Linear approximation method enables fast and precise calculation of viscoelastic parameters of the liver using multi-frequency MR elastograms. This method will promote clinical application of viscoelastic analysis of liver diseases using MRE.Acknowledgements
No acknowledgement found.References
- Sinkus R, Lambert S, Abd-Elmoniem KZ, et al. Rheological determinants for simultaneous staging of hepatic fibrosis and inflammation in patients with chronic liver disease. NMRBiomed. 2018;31(10):e3956.
- Zhang X, Gao X, Zhang P, et al. Dynamic mechanical analysis to assess viscoelasticity of liver tissue in a rat model of nonalcoholic fatty liver disease. Med Eng Phys. 2017;44:79-86.
- Salameh N, Larrat B, Abarca-Quinones J, et al. Early detection of steatohepatitis in fatty rat liver by using MR elastography. Radiology. 2009 253(1):90-7.
- Leclerc GE, Charleux F, Robert L, et al. Analysis of liver viscosity behavior as a function of multifrequency magnetic resonance elastography (MMRE) postprocessing. J Magn Reson Imaging. 2013;38(2):422–428.
Figures
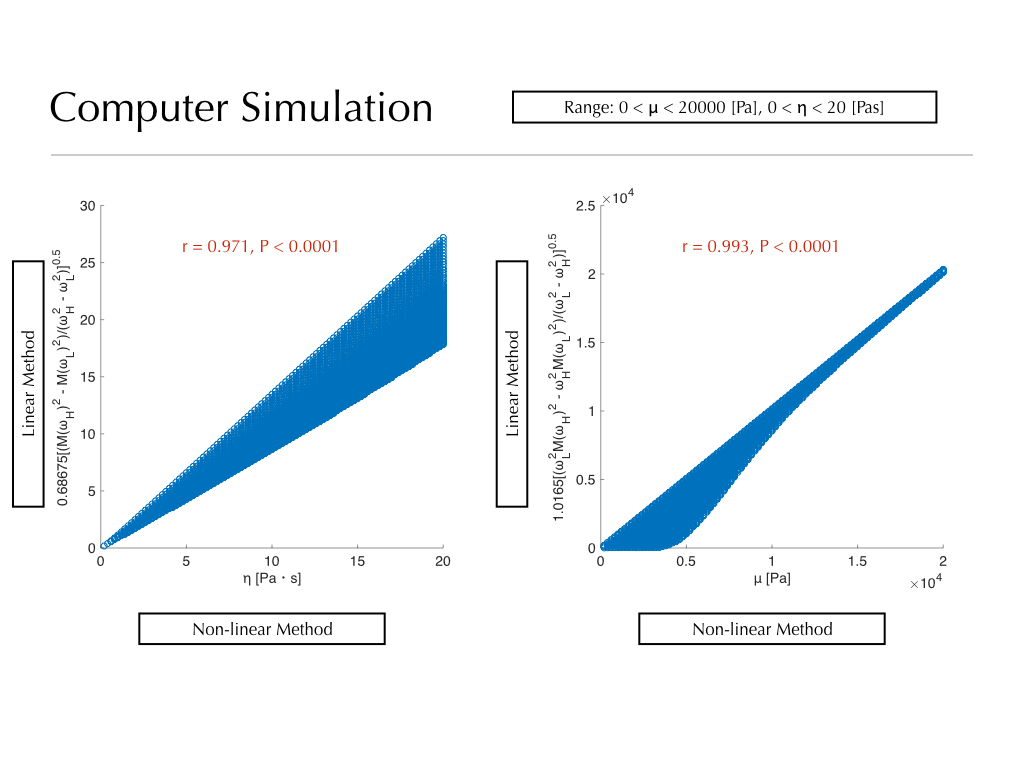
Scatter plots showing computer simulation results for viscoelastic parameters (viscosity, η and elasticity, μ) and approximation values calculated by linear method from perfect elastic body model elasticity M(ω) and angular frequency ω on multi-frequency MR elastograms. Significantly close correlation was observed between approximation values and viscoelastic parameters (r = 0.971 for η, r = 0.993 for μ).
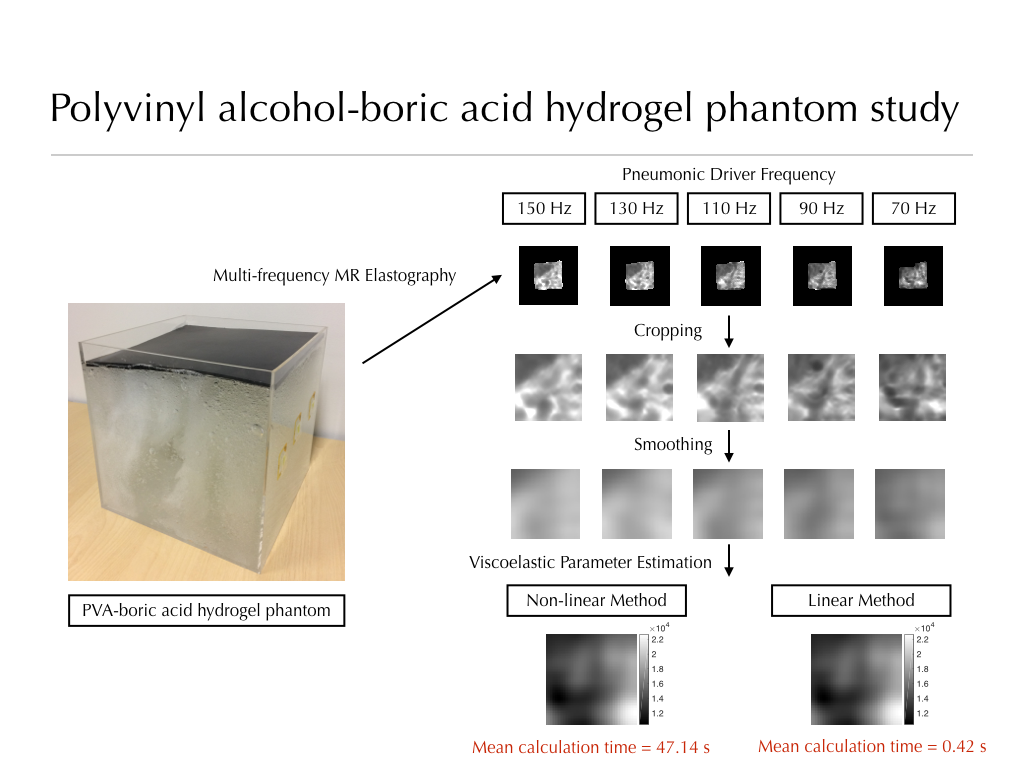
Diagramatic representation of phantom study using polyvinyl alcohol-boric acid phantom. Time to calculate pixel-by-pixel viscoelastic parameters (80 x 80 pixels) were significantly
short in linear method (0.42 s) compared to non-linear method (47.14 s) (P <
0.001).
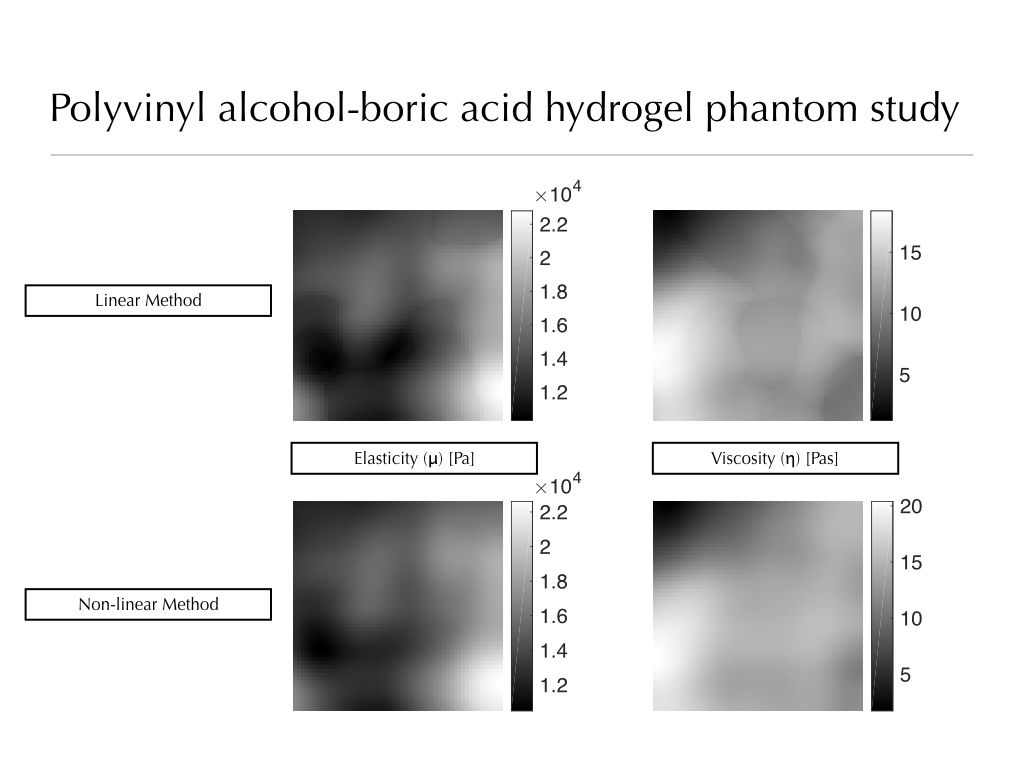
Comparison of generated viscoelastic parameter map by different calculation methods, non-linear and linear methods.
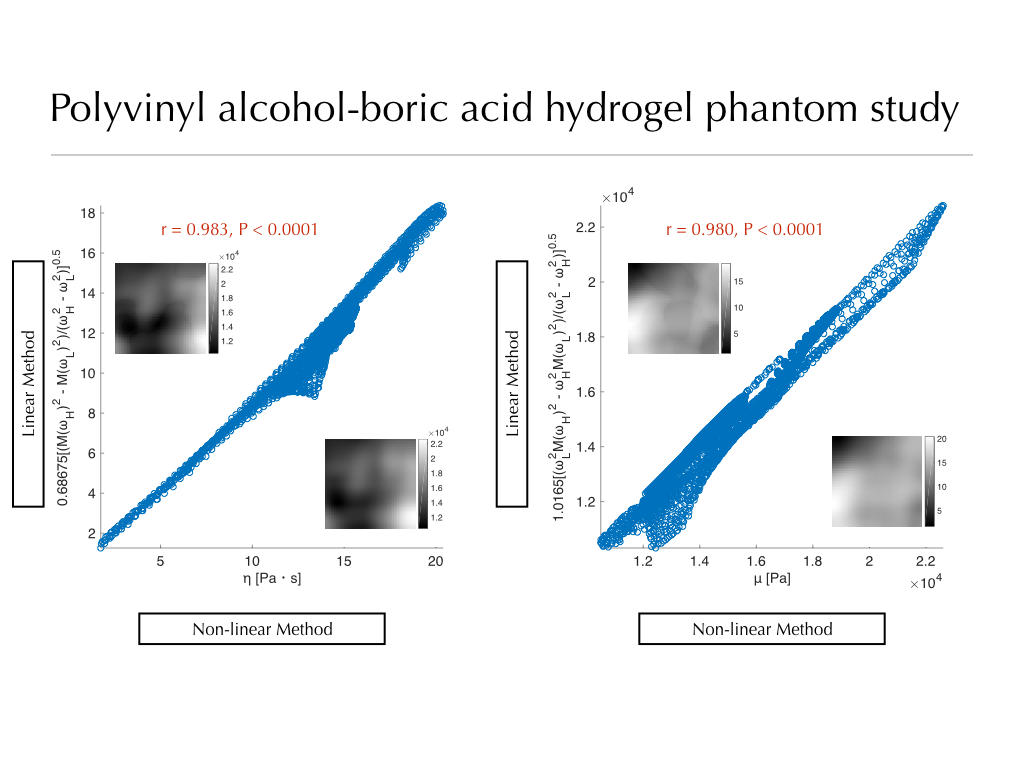
Scatter plots showing phantom study results for viscoelastic parameters (viscosity, η and elasticity, μ) calculated by non-linear method and approximation values calculated by linear method. Significantly close correlation was observed between two methods (r = 0.983 for η, r = 0.980 for μ).
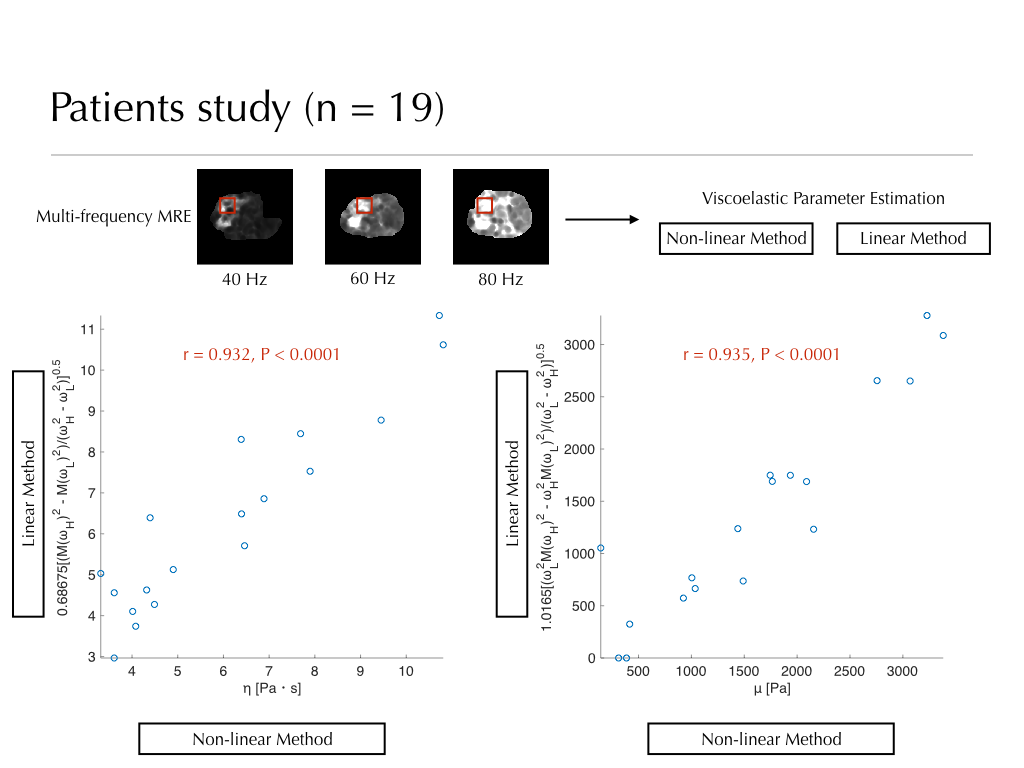
Scatter plots showing patients study results for viscoelastic parameters (viscosity, η and elasticity, μ) calculated by non-linear method and approximation values calculated by linear method. Significantly close correlation was observed between two methods (r = 0.932 for η, r = 0.935 for μ).