1033
Comparison of FerriScan- versus R2*-Derived Liver Iron Concentration (LIC) for Clinical Decision Making in Patients with Liver Iron Overload Disease1Medical Imaging, University Health Network, Toronto, ON, Canada, 2Division of Medical Oncology & Hematology, University Health Network, Toronto, ON, Canada, 3University Health Network, Toronto, ON, Canada
Synopsis
This study compared clinical decision making between FerriScan and an R2*-based method in patients with iron overload disease. FerriScan is the current gold standard. However, it is expensive, and data must be transferred offsite. FerriScan and R2* techniques were both used to manage (simulated) patient chelator dosing. The agreement between different reviewers assessing the same FerriScan data was the same as the agreement when the same reviewer used R2*- compared to FerriScan-derived LIC values. Thus, switching to R2*-based decision making from FerriScan is no more likely to cause a difference in patient management than switching from one hematologist to another.
INTRODUCTION
Patients with iron overload disease are often placed on chelation therapy. The objective of this therapy is to maintain the liver iron concentration (LIC) between 3 and 7 mg iron/g liver. The assessment of LIC is therefore essential in the management of the disease. The reference standard for LIC assessment is the R2-mapping FerriScan technique [1]. However, FerriScan is expensive and data must be transferred offsite. Alternative R2*-based LIC techniques have not gained widespread clinical acceptance. This is likely due to concern that LIC values provided by an alternate technique may lead to different clinical decisions relative to FerriScan. In this abstract we explore clinical decision making using both FerriScan as well as an alternate R2*-based LIC quantification method [2].METHODS
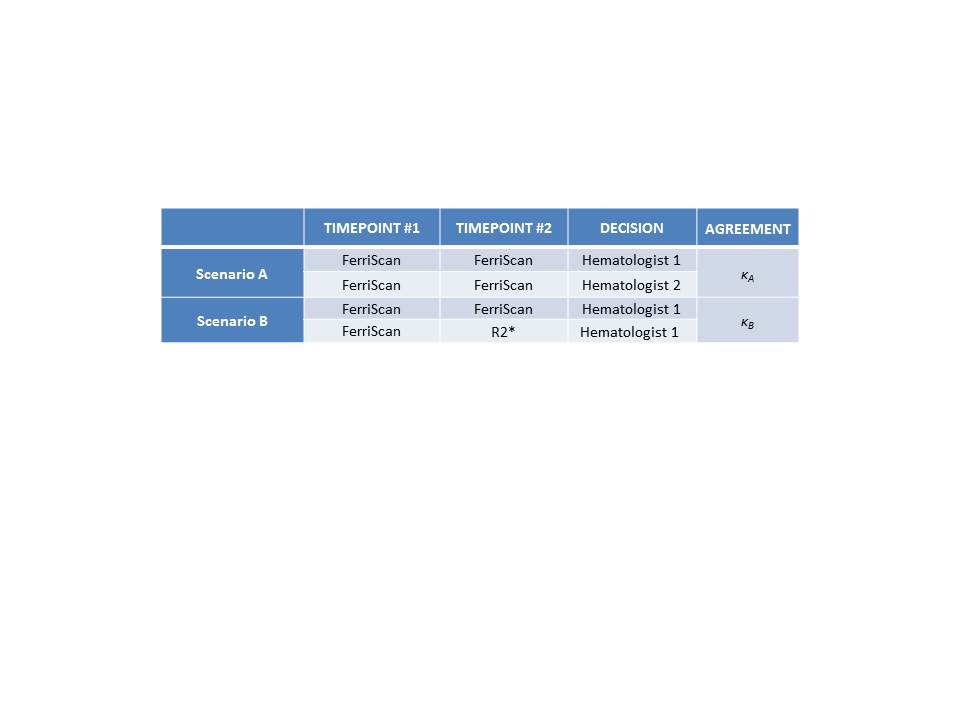
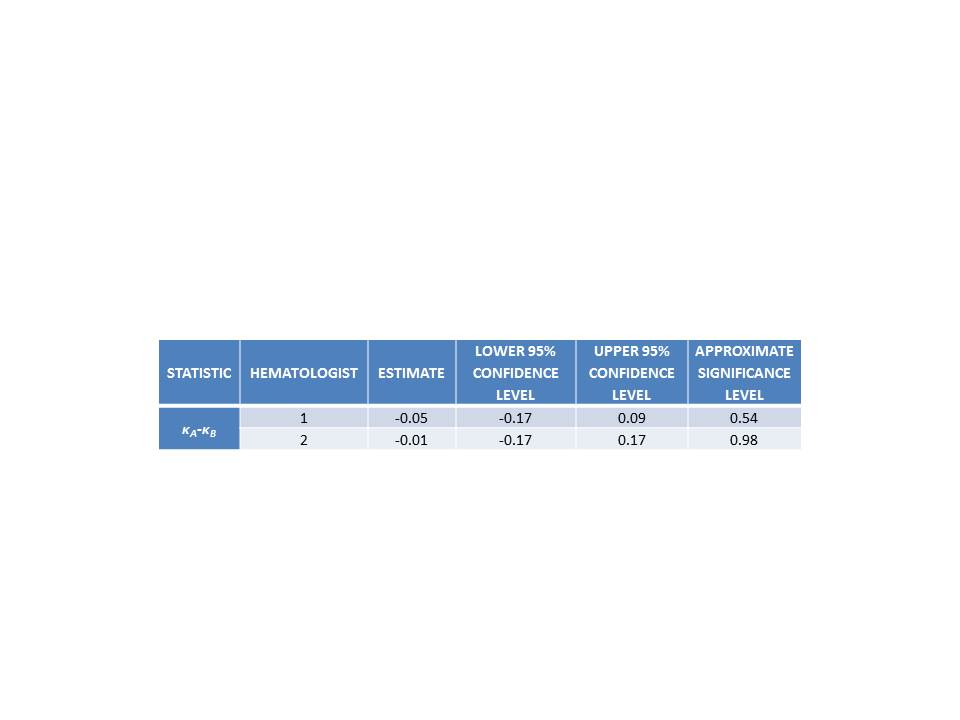
One-hundred-and-eight iron overload patients were imaged at two consecutive timepoints (454 +/- 158 days). For both exams, patients underwent the standard FerriScan protocol. During the second exam, each patient additionally underwent R2*-mapping. R2* values were converted into LIC using a previously calculated calibration curve [2]. For each patient, a clinical decision was made to increase, decrease, or maintain chelator levels. To analyze the impact of R2*- vs. FerriScan derived LIC values, clinical decisions were made using two separate models: The first model supposes that decisions are strictly guided by fixed LIC thresholds. Specifically, chelator dose is increased if LIC>7mg iron/g liver, decreased if LIC<3mg iron/g liver, and maintained otherwise. Using FerriScan as a reference standard, true/false positive/negative rates were calculated for R2*-based decision making on the second timepoint. This model does not require any clinician input. The second model utilizes decisions made by hematologists in (simulated) patient management based on trends across the two LIC timepoints. The agreement between hematologists (≡κA) was compared to the agreement between a single hematologist using the two different LIC techniques (≡κB) (see Table 1). A blocked bootstrap method was used to compare the Kappa values. Significance was set at the 95% confidence level.RESULTS
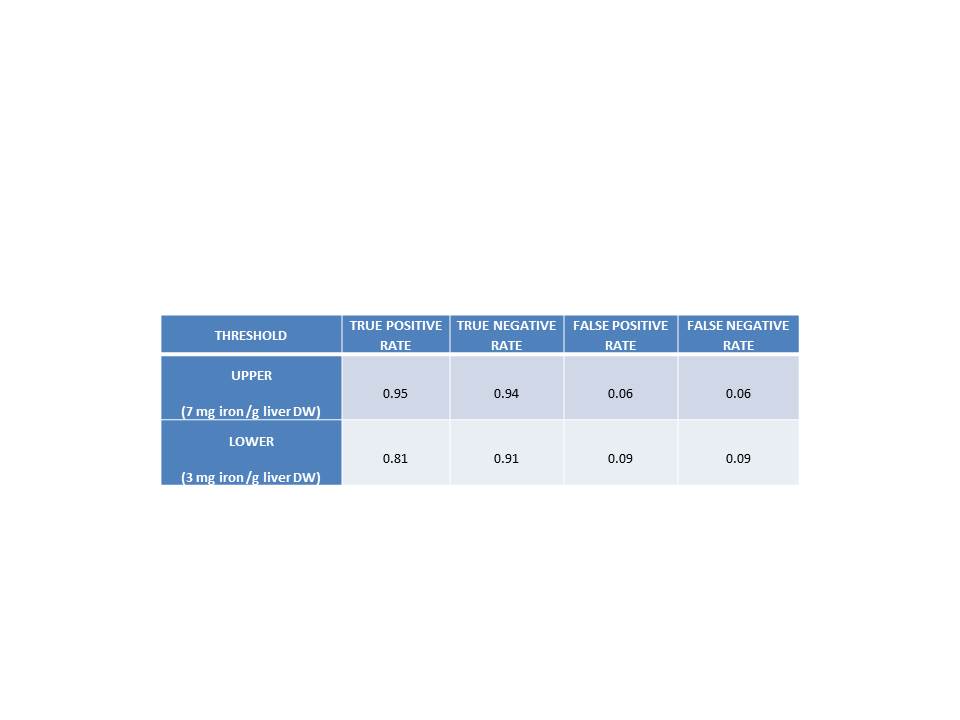
For the fixed threshold model, Table 2 lists the true/false positive and true/false negative rates for upper and lower thresholds of 7 and 3 mg iron/g.
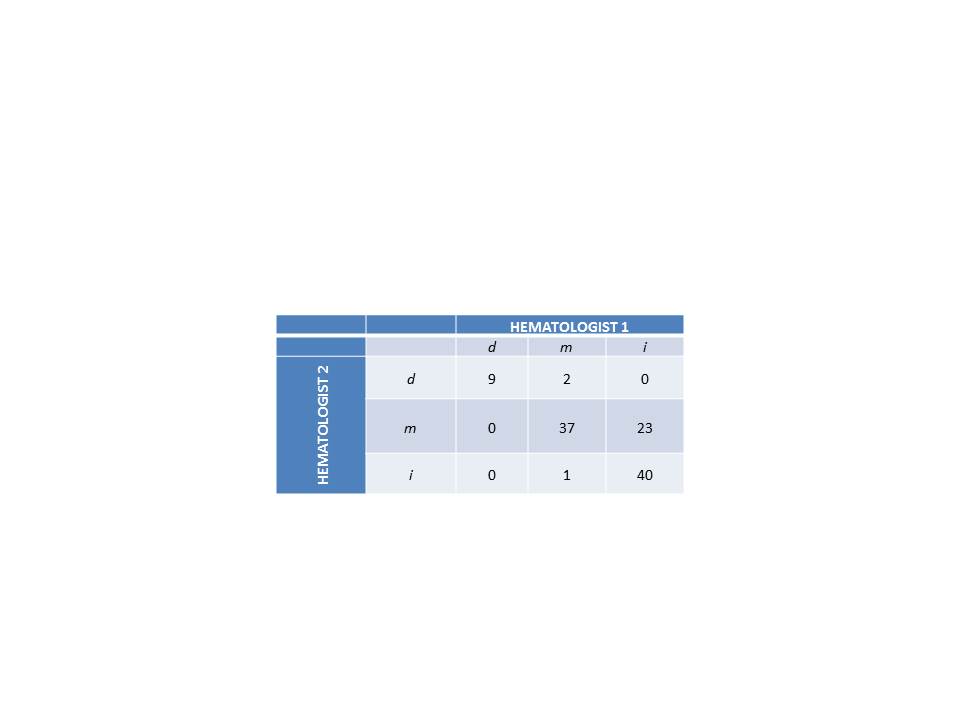
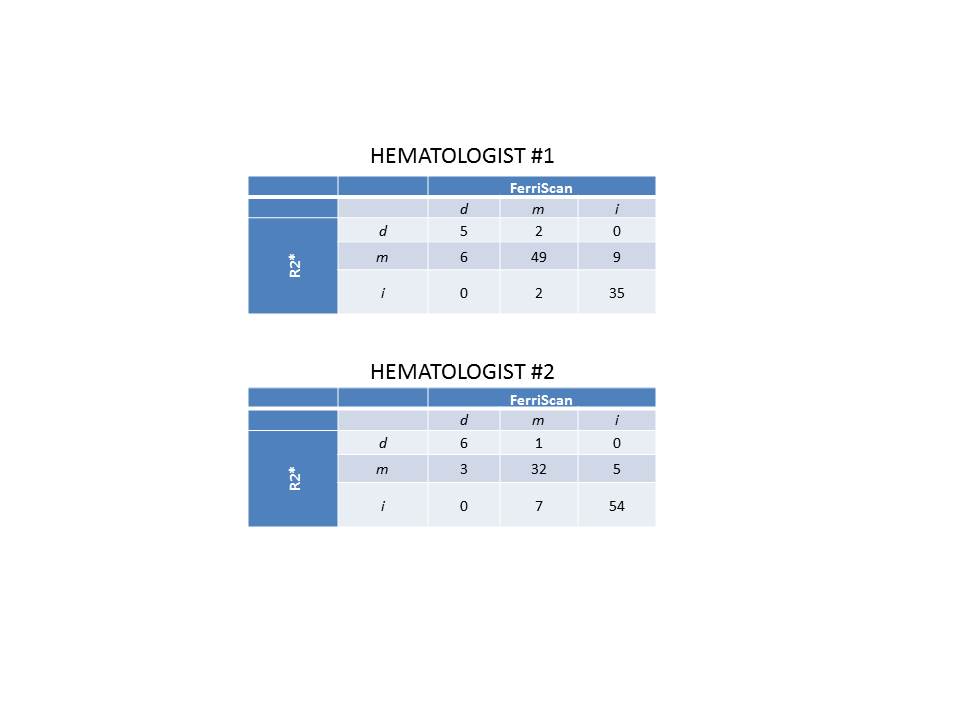
For the simulated patient management model, Table 3 lists the agreement between hematologists. Table 4 lists the agreement for a single hematologist making decisions alternately with FerriScan- and R2*-derived LIC values. Table 5 indicates that there is no significant difference at the 95% confidence level between either of the above cases for either hematologist. This implies that the level of agreement in switching to R2*- vs. FerriScan-derived LIC measures is the same as the level agreement associated with different clinicians assessing the same data.
DISCUSSION
In the fixed threshold model, there was good agreement between FerriScan- and R2*-based decision making. True positive/negative rates were above 90%, except for the lower threshold true positive rate (80%). False positive/negative rates were below 10%
In the simulated management model, the results indicated that agreement between different reviewers assessing the same FerriScan data (i.e. inter-observer variability) was the same magnitude as the agreement when the same reviewer used R2*- compared to FerriScan-derived LIC values. Thus, from a statistical point of view, switching to R2*-based decision making from FerriScan is no more likely to cause a difference in patient management than simply switching decision making from one hematologist to another.
The clinical decision models used in this study assumed that FerriScan provides gold standard measures of LIC. In turn, this implied that any discrepancy between R2*- and FerriScan-derived LIC values was due to deficiencies in the R2* technique. In reality, a significant component of the discrepancy between R2*- and FerriScan-derived LIC values is caused by iron heterogeneity over the different regions of the liver analyzed by the two techniques [2]. Although it is the current standard-of-care, there is (to our knowledge) no study which demonstrates that FerriScan’s regions are necessarily optimal for patient management. Therefore, although there may be some discrepancies between R2*- and FerriScan-derived LIC’s, it is not clear that decision making based on the former would necessarily result in poorer patient outcomes than the latter.
CONCLUSIONS
The objective of this study was to examine clinical decision making in iron overload patients using FerriScan R2- and an R2*-based approach. It was found that the agreement in clinical decision making associated with using R2* rather than FerriScan was the same as the inter-observer agreement using FerriScan alone.Acknowledgements
No acknowledgement found.References
[1] St Pierre, T.G., et al., Noninvasive measurement and imaging of liver iron concentrations using proton magnetic resonance. Blood, 2005. 105(2): p. 855-861.
[2] Sussman, M.S. et al., Prospective Evaluation of an R2* method for Assessing Liver Iron Concentration (LIC) against FerriScan: Derivation of the Calibration Curve and Characterization of the Nature and Source of Uncertainty in the Relationship. JMRI, in press.
Figures