1032
Characterization of Abdominal Neoplasms using a Fast Inversion Recovery Radial SSFP T1 Mapping Technique1Medical Imaging, University of Arizona, Tucson, AZ, United States, 2Biomedical Engineering, University of Arizona, Tucson, AZ, United States, 3Electrical and Computer Engineering, University of Arizona, Tucson, AZ, United States
Synopsis
We present a rapid technique for high-resolution multi-slice T1 mapping of the abdomen using the inversion recovery radial steady-state free-precision (IR-radSSFP) pulse sequence. We propose a joint two-component fit to estimate accurate T1 maps in the presence of partial volume. The utility of the sequence has been demonstrated for the characterization of abdominal neoplasms using data acquired on 22 clinical patients.
INTRODUCTION
Abdominal T1 mapping has been used for the quantification of various pathologies including the characterization of focal liver lesions1-9. T1 mapping techniques such as MOLLI9,10 suffer from low spatial and/or temporal resolution and require long acquisition times for multi-slice acquisitions. This limits their use in T1 estimation of small structures and in applications that need good anatomical coverage.
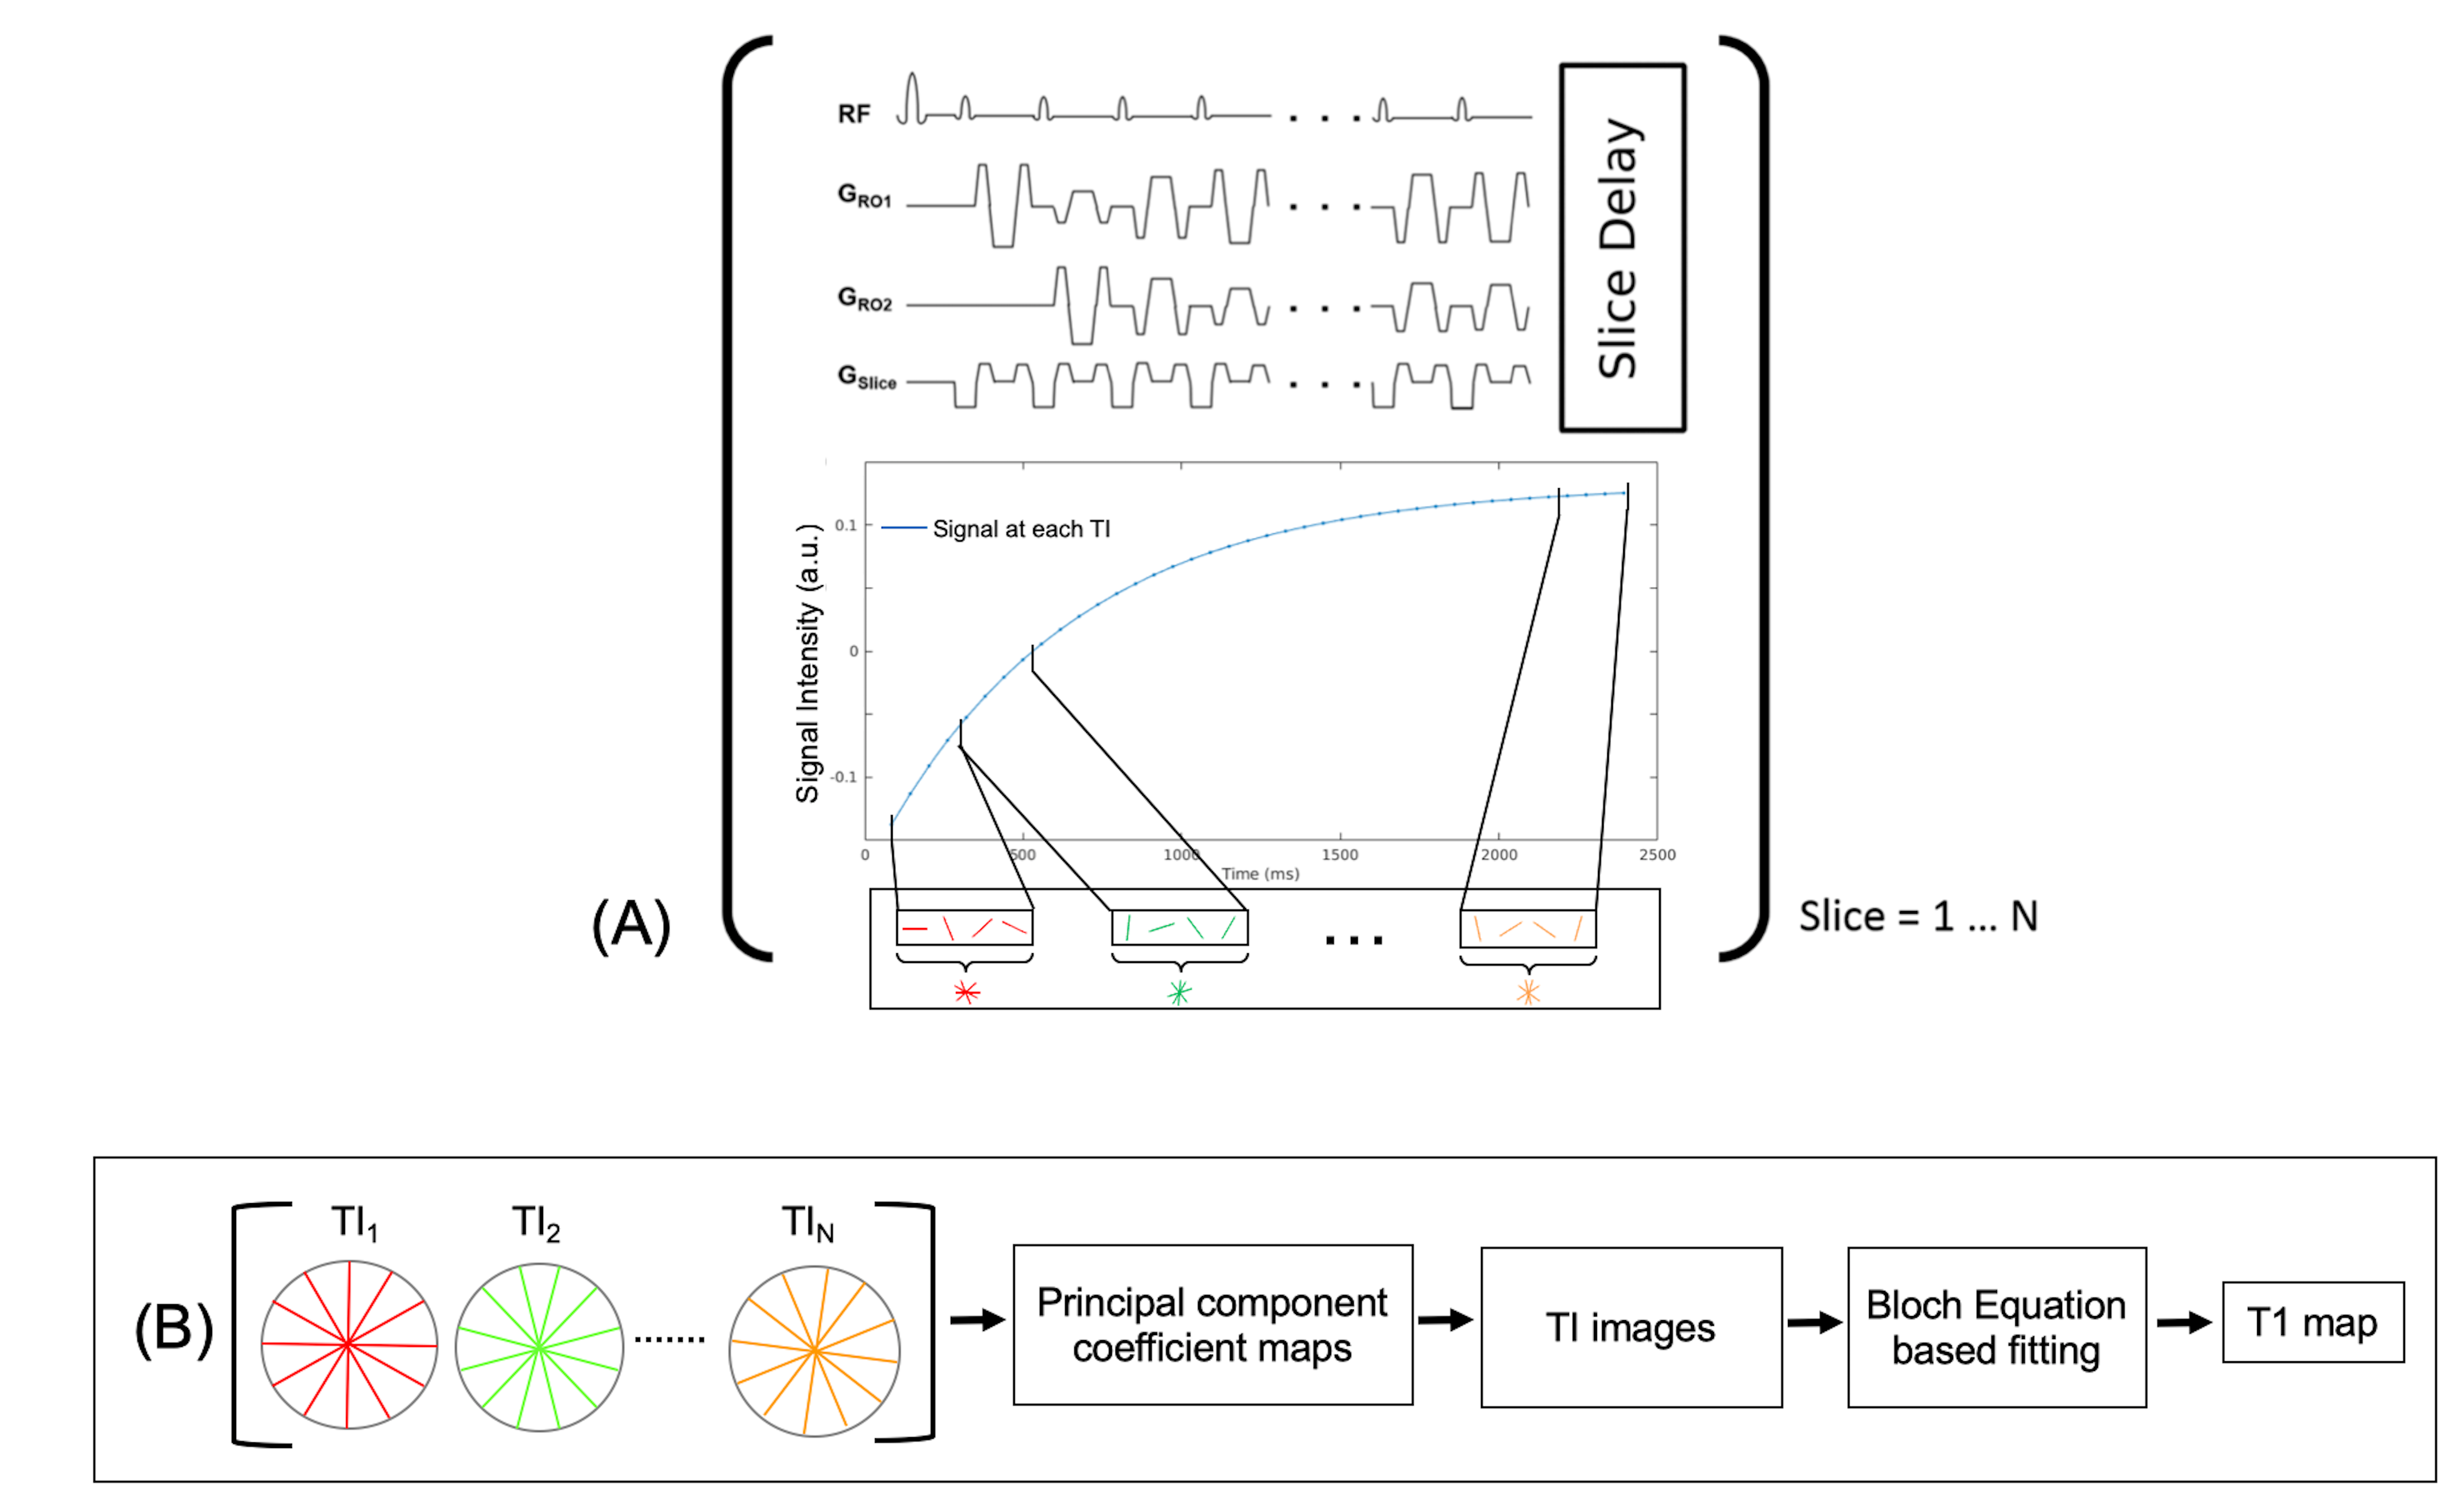
Recently, we proposed11 an inversion recovery radial balanced-SSFP (IR-radSSFP) technique for multi-slice high resolution T1 mapping (Figure 1). The technique is designed to acquire co-registered data with high spatio-temporal resolution in a short period of time (~2s per slice), allowing whole liver coverage in 2-3 breath holds.
Partial volume (PV), arising from the presence of two tissue types in the voxel, affect T1 estimation. Due to the lower T1 of liver, PV causes T1 underestimation and can lead to mis-classification of lesions. Robust T1 estimation requires the use of a two-component model that accounts for the presence of lesion and background tissues in each voxel.
In this work, we investigate the utility of IR-radSSFP based T1 mapping for the classification of abdominal neoplasms and present a joint two-component fitting approach for T1 estimation in the presence of PV.
MATERIALS AND METHODS
T1 Estimation in the Presence of PV: For accurate T1 mapping in the presence of PV, we use a two-component signal model that accounts for lesion and background. The signal model representing the observed signal in a voxel at a time TI is: $$s(TI)=I_{bg} f(T1_{bg},T2_{bg},B0,TE,TR,TI)+ I_{les} f(T1_{les},T2_{les},B0,TE,TR,TI)$$ where, the subscripts $$$bg$$$ and $$$les$$$ denote the background (liver) and lesion, respectively. $$$I_{bg}$$$ and $$$I_{les}$$$ are the equilibrium magnetization for the two components, and $$$f(.)$$$ is the Bloch equation model.
T1 estimation is performed by extending our previously proposed joint fitting framework12, where the background and lesion T1s are considered homogeneous within the lesion’s ROI (a valid assumption for benign lesions and small malignancies). Thus, all voxels within the lesion’s ROI are constrained in the estimation to a single $$$T1_{les}$$$ and $$$T1_{bg}$$$. Initial conditions for lesion and background are obtained from a single-component fit.
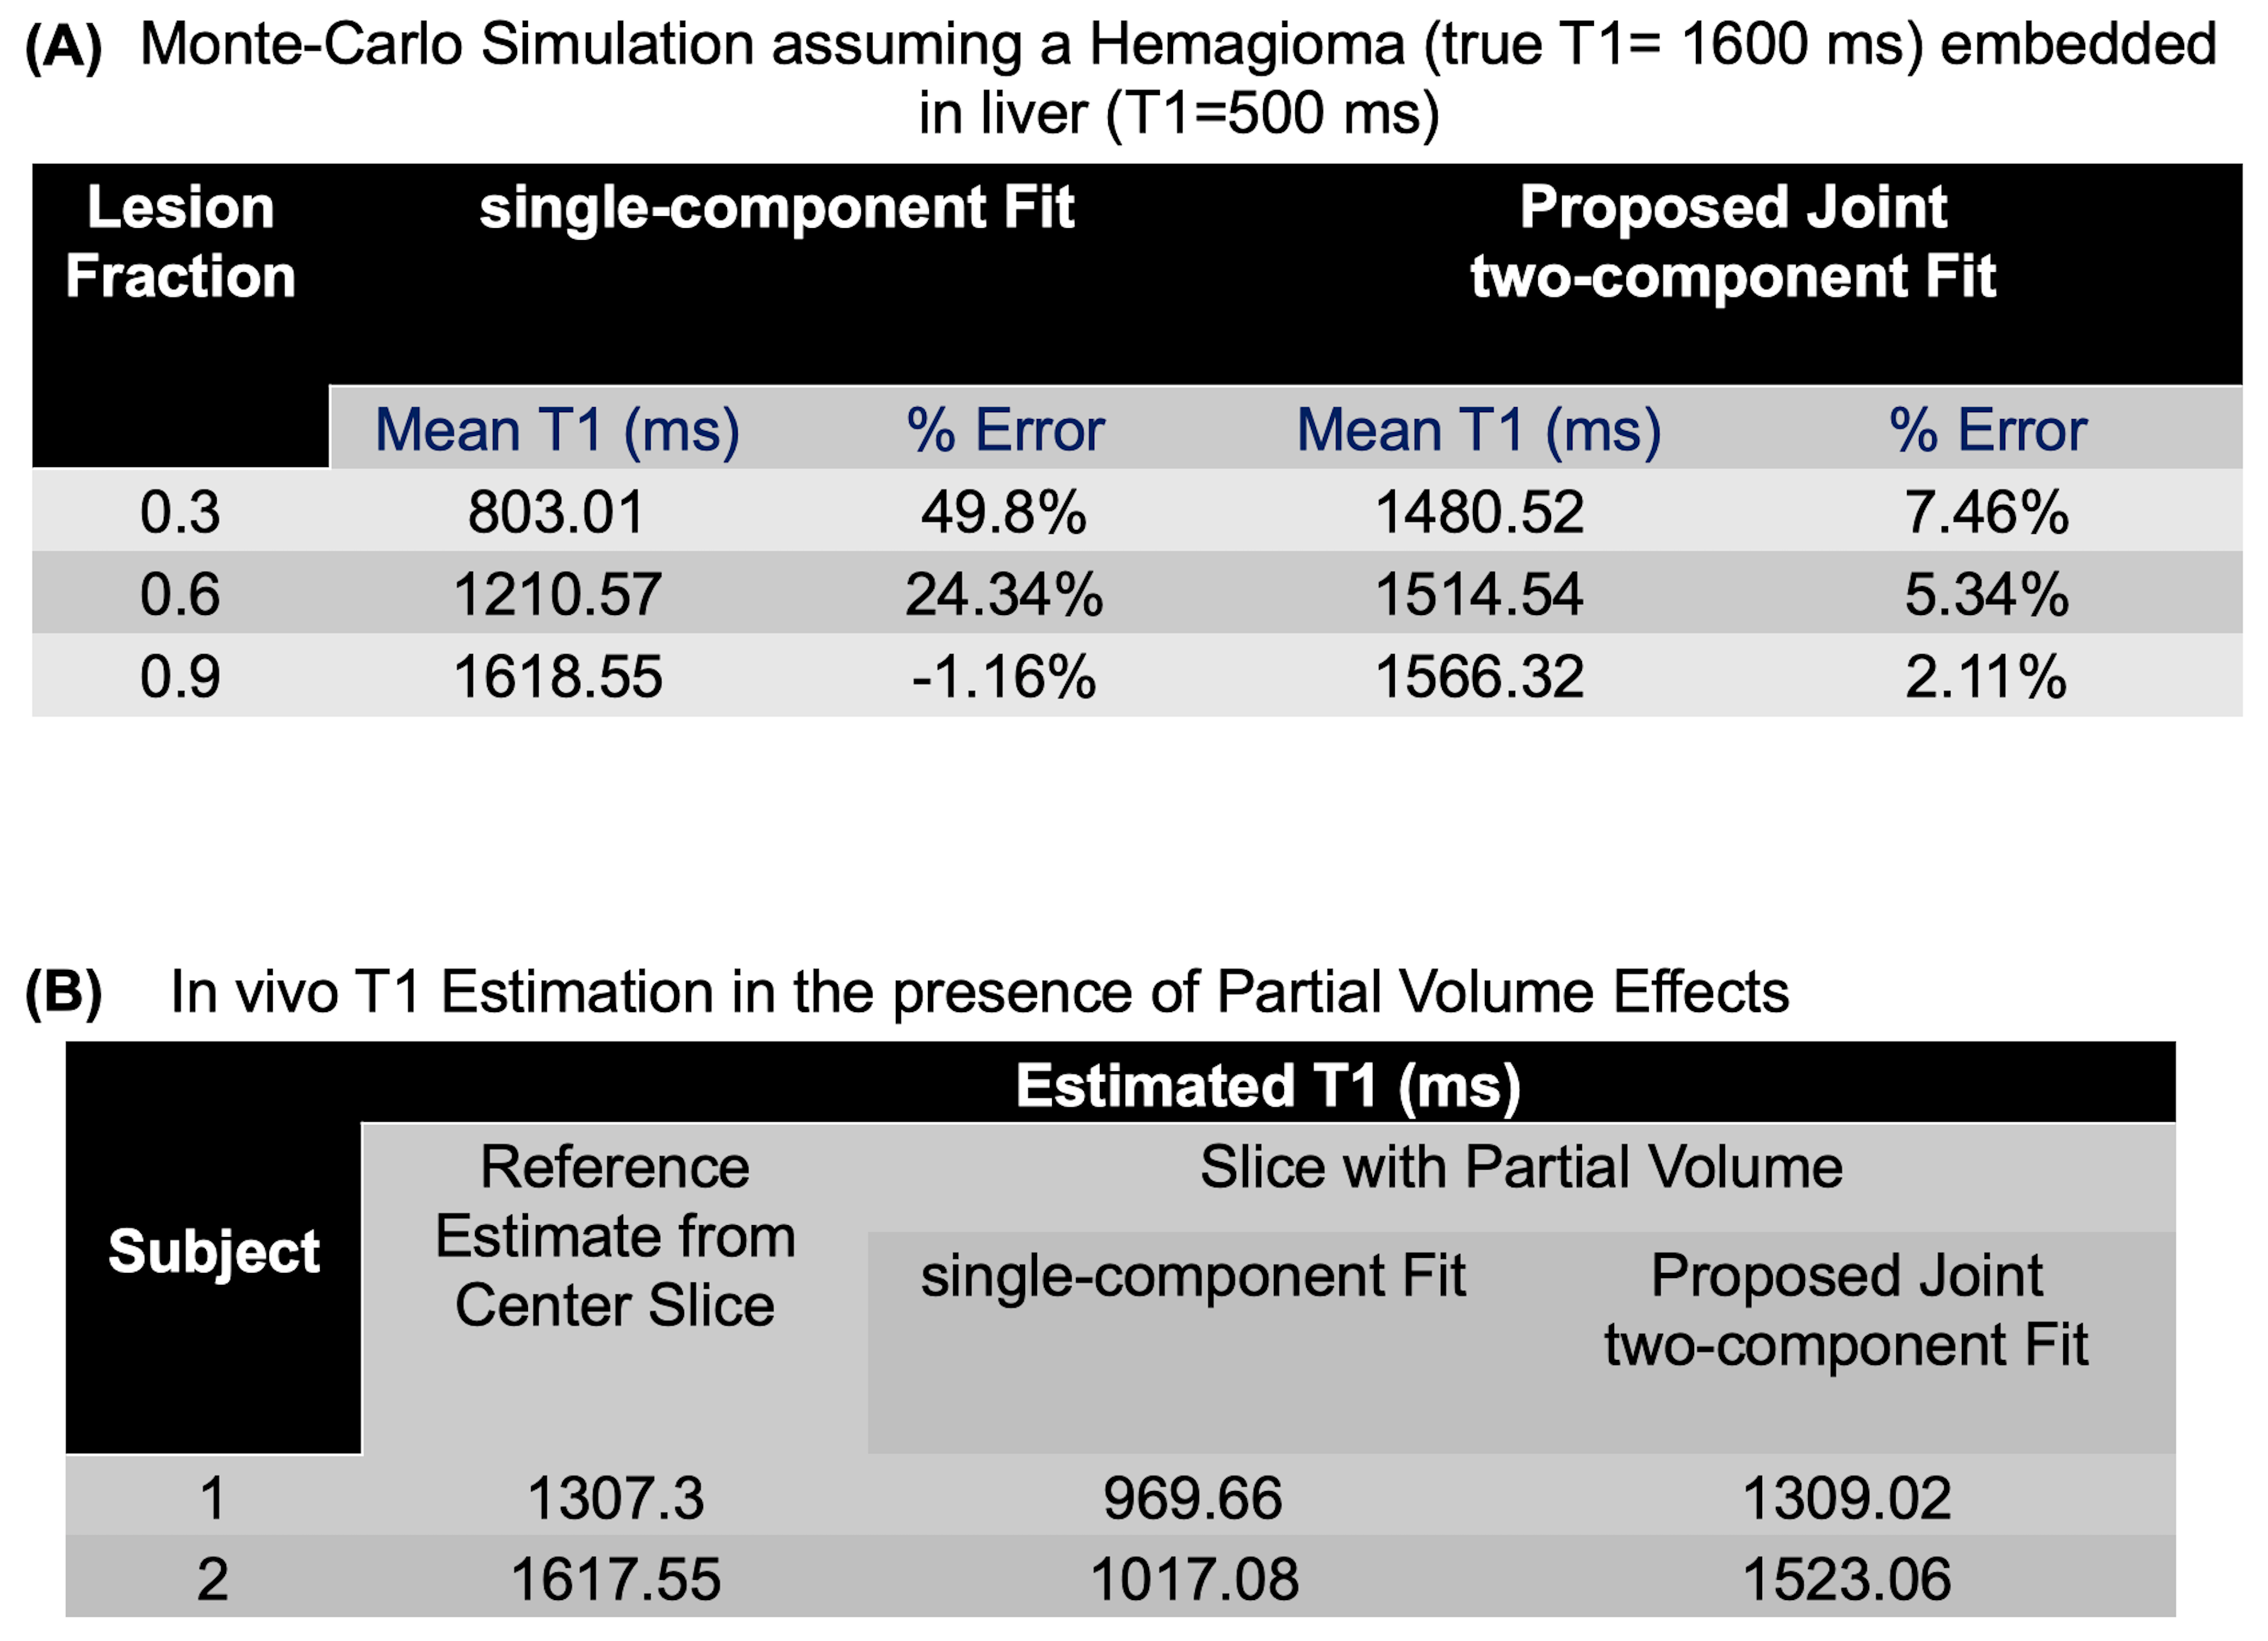
Simulations: Monte-Carlo simulations were performed to evaluate performance of the joint 2-component fitting. Data were simulated assuming a hemangioma (T1=1600ms) embedded within the liver (T1=500 ms).
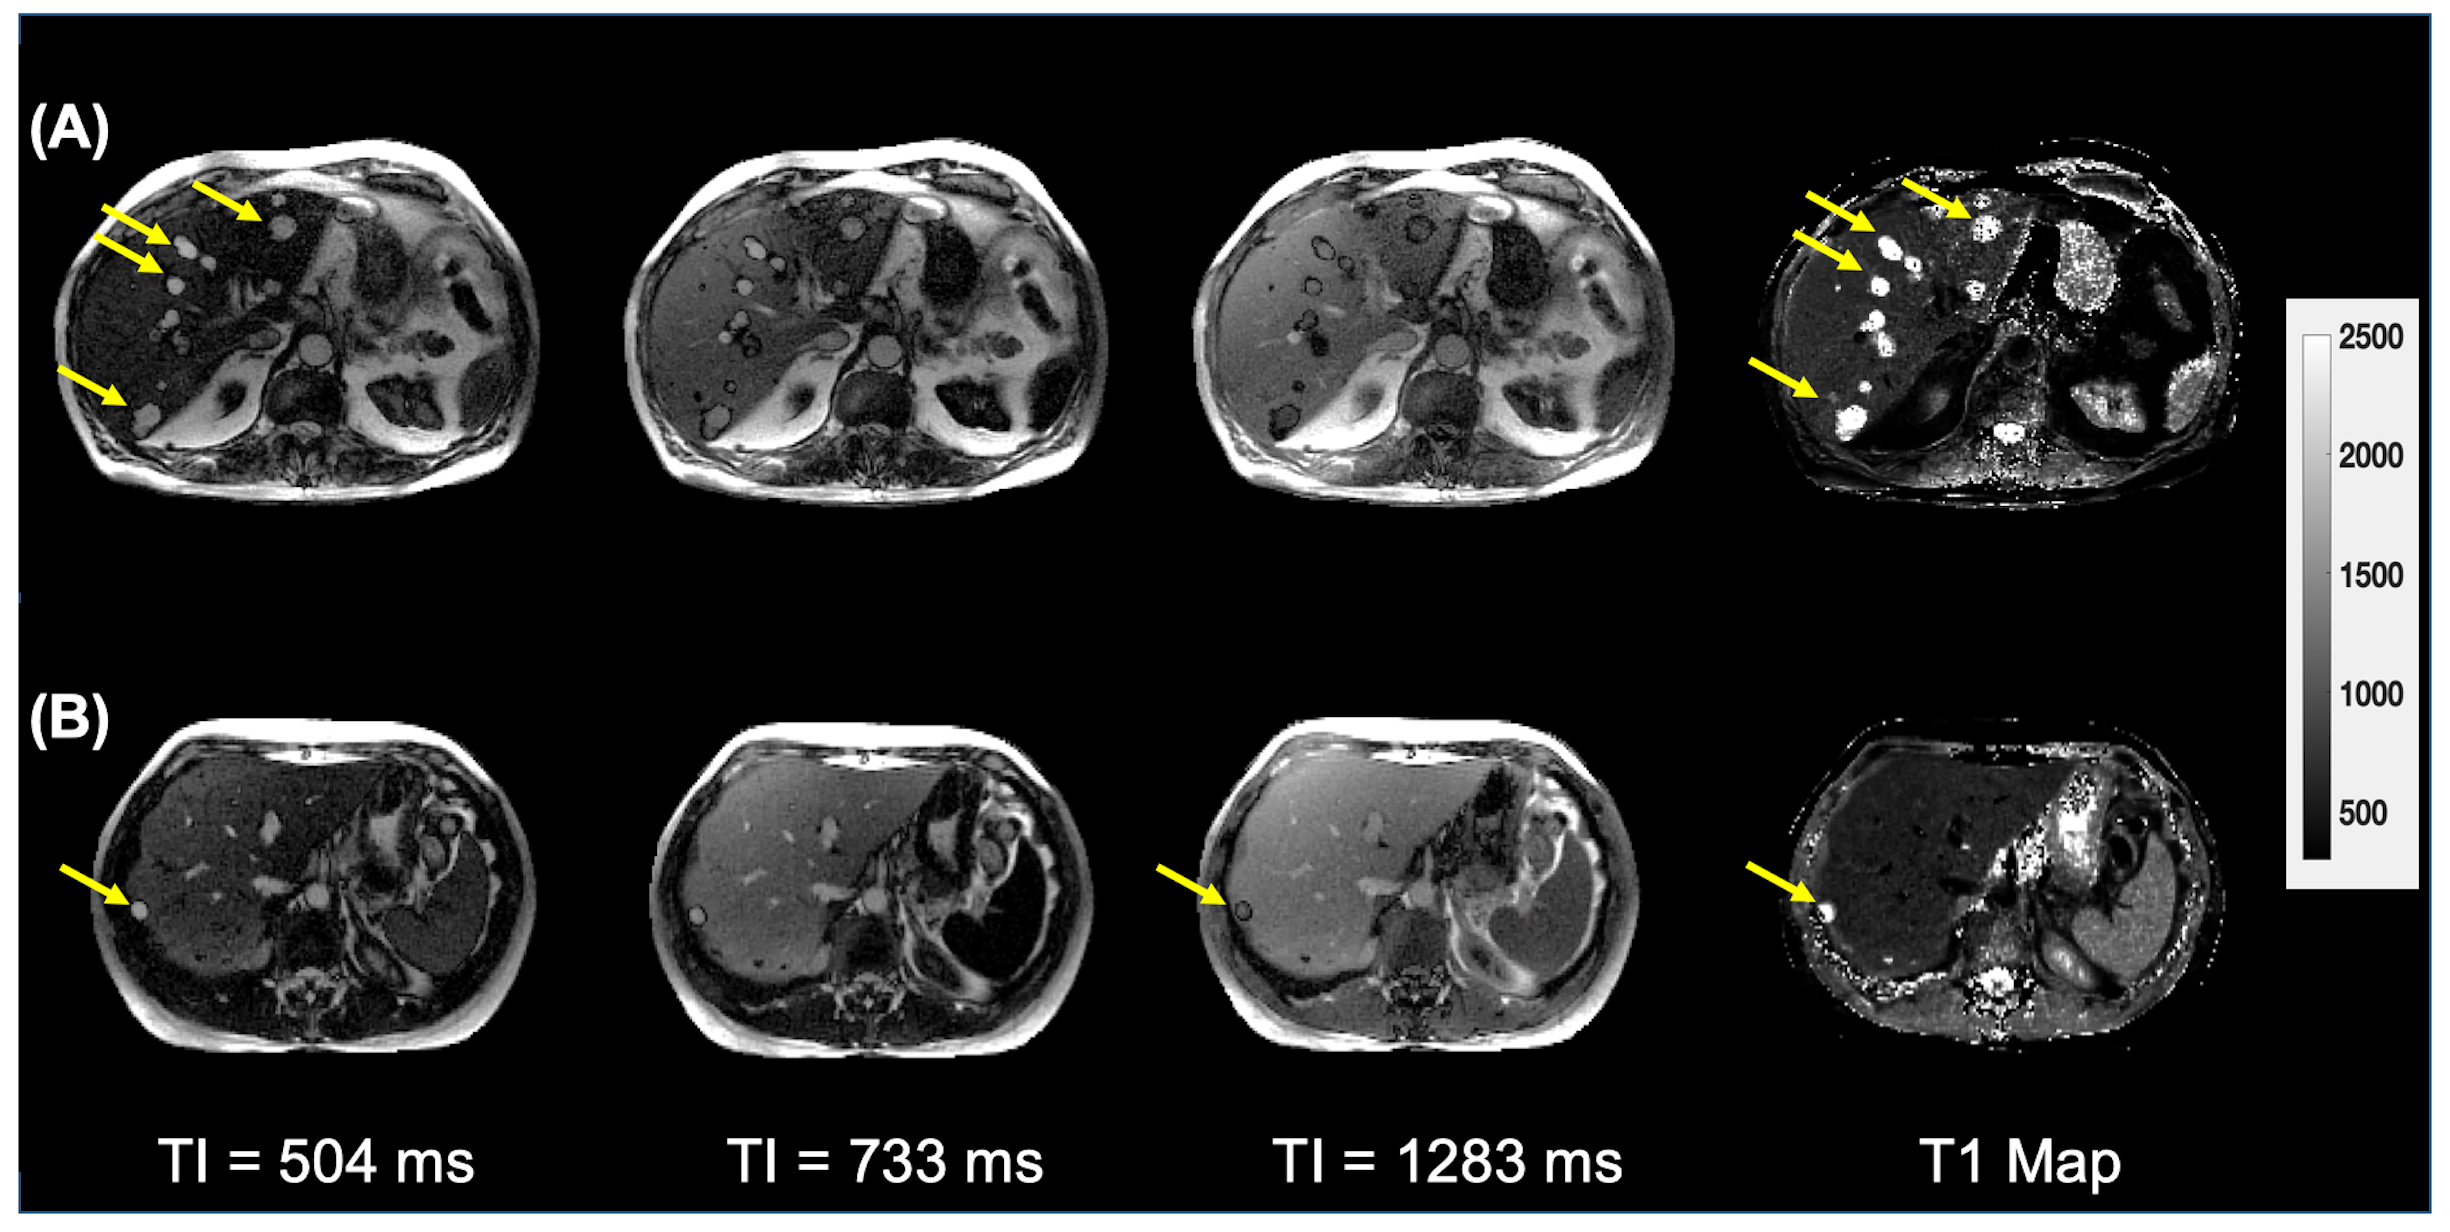
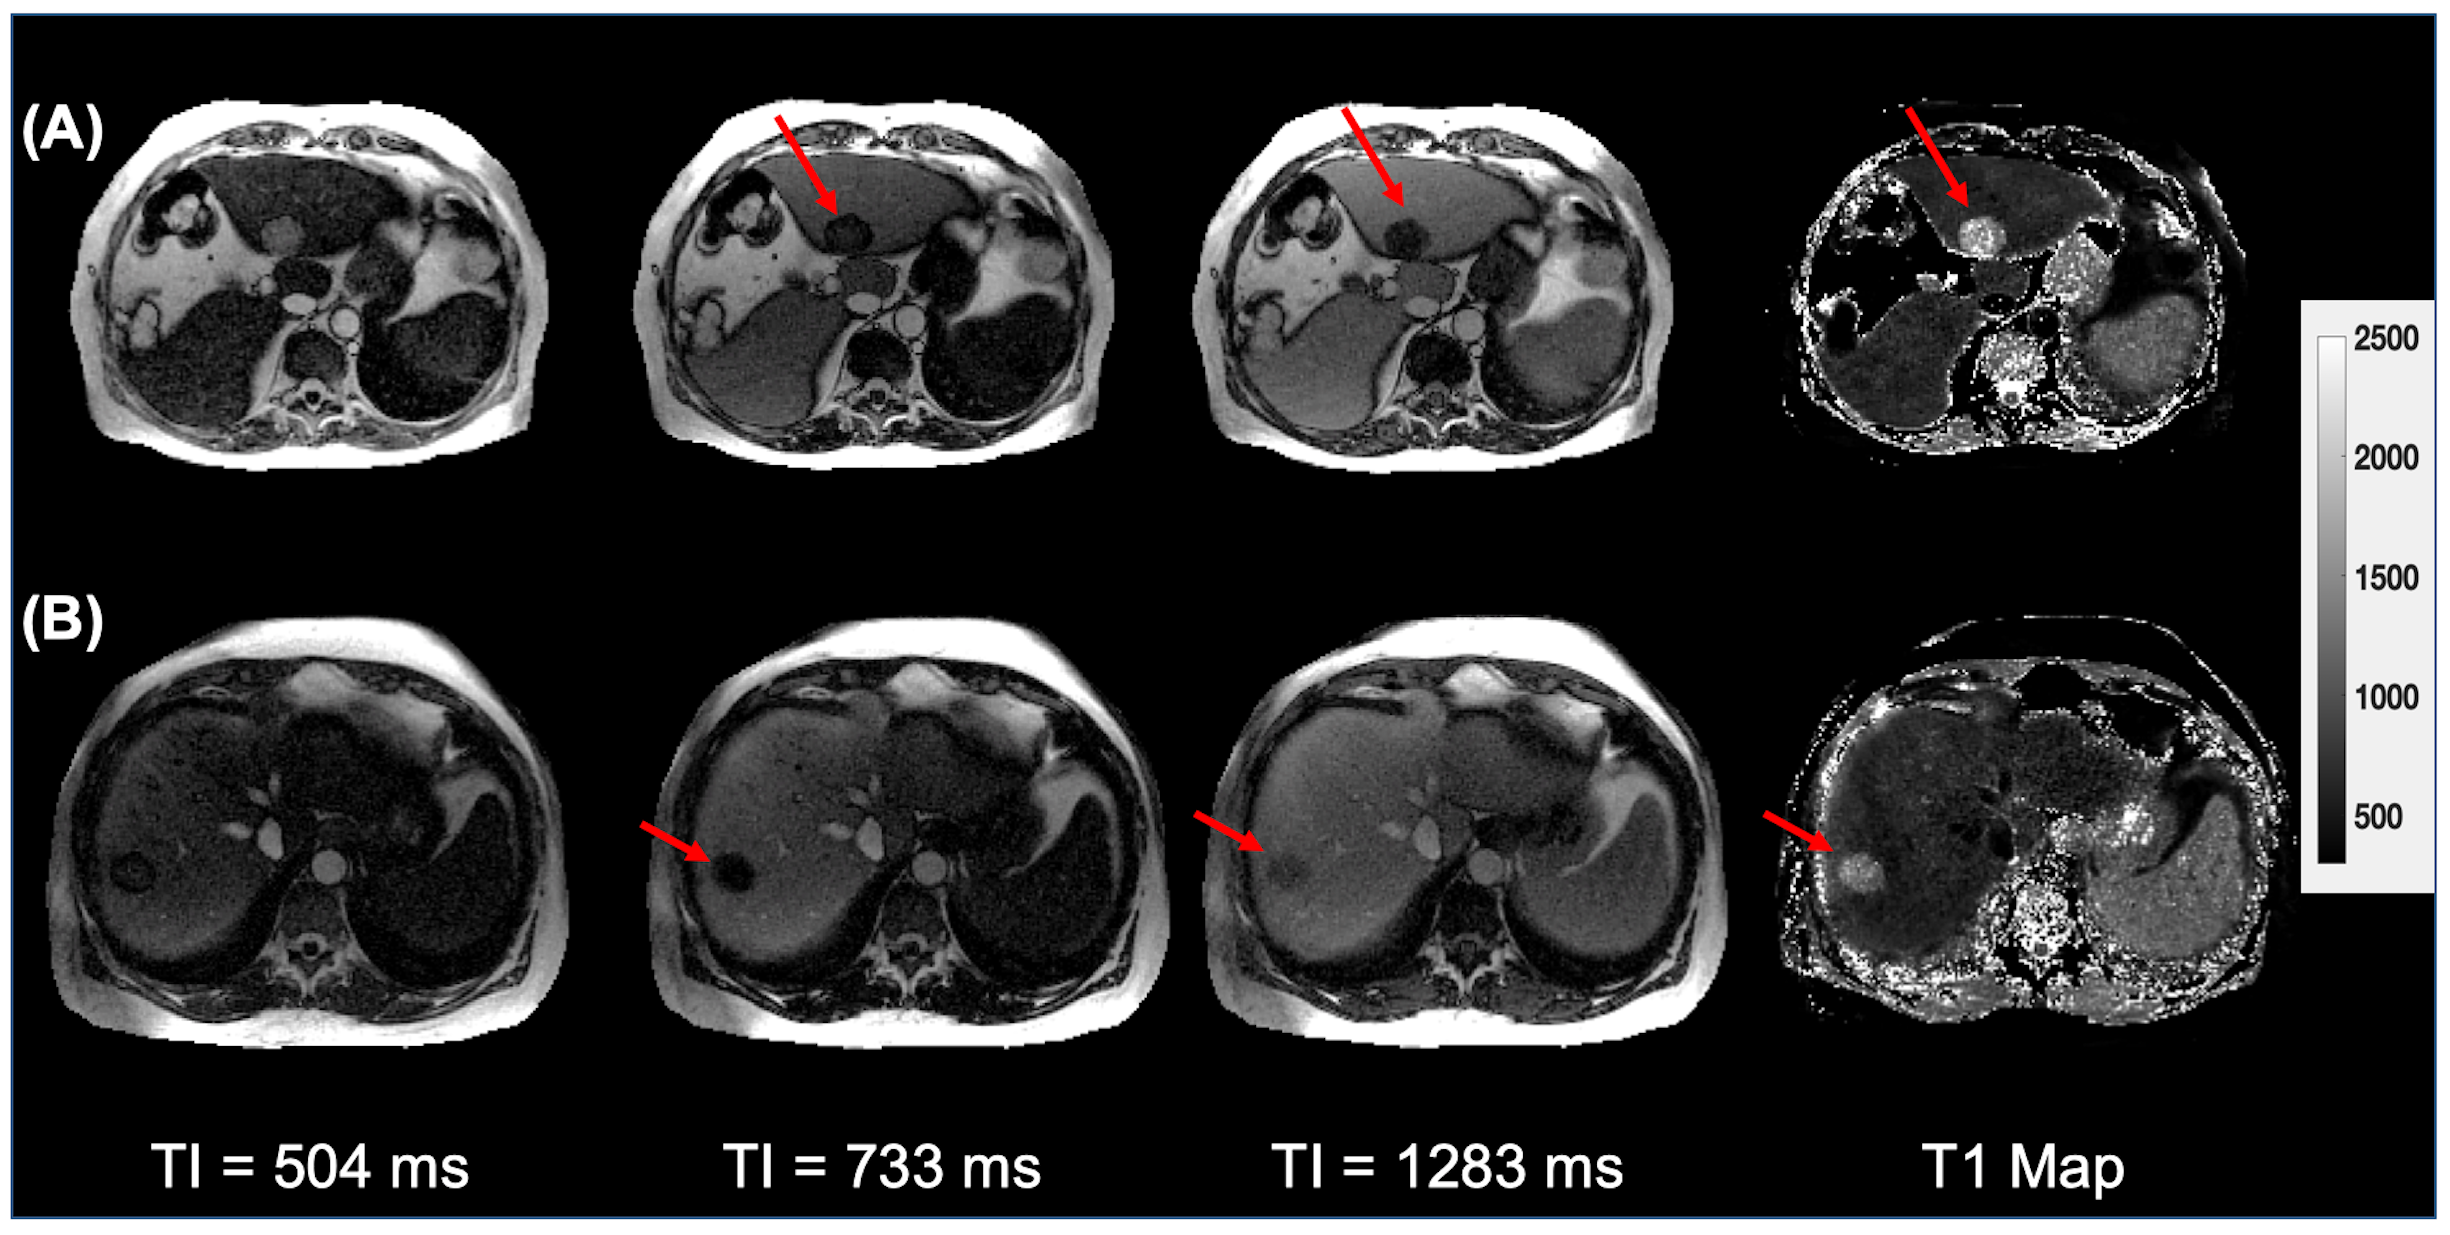
In vivo Imaging: Informed consent was obtained in compliance with the Institutional Review Board. Pre-contrast breath-held abdominal imaging was performed using IR-radSSFP on a 1.5T Siemens Aera scanner with: FOV=40cm, base-resolution=256, radial views=512, TR=1.53ms, TE=1.36ms, TI=70ms, resolution=1.56x1.56mm, slice thickness=5mm, and scan time=18s (for a 10 slice acquisition). Data from 28 neoplasms (8 metastases, 1 HCC, 2 hemangiomas, and 17 bile hamartomas) from 22 subjects were analyzed.
RESULTS
Figure 2 shows 3 (out of 32 TI images) and T1 maps for two subjects with bile duct hamartomas. Note that the hamartomas are very conspicuous and appear hyper-intense relative to liver in the TI images at 504ms and the T1 maps. Figure 3 shows representative images from subjects with metastatic lesions. Compared to the benign lesions, these have a lower T1 value and are most conspicuous at longer TIs. The use of a selective 180o inversion pulse suppresses signal from blood flow and improves the identification of liver lesions.
Results from the Monte-Carlo simulations are shown in Figure 4(A) for different lesion fractions using both a single-component and the joint two-component fit. Note that the mean error from the single-component fit increases with decreasing lesion fraction, while the joint two-component fit has <8% error for all cases. The joint fitting approach was evaluated in vivo by estimating the lesion’s T1s on slices suspected of PV (e.g., end slices) and compared to the T1 for the same lesion from a slice which did not have PV (e.g., a central slice). As shown in Figure 4(B), the T1 estimates from the edge slices using the joint-fitting approach are much closer to the center slice T1 values compared to the single-component fit.
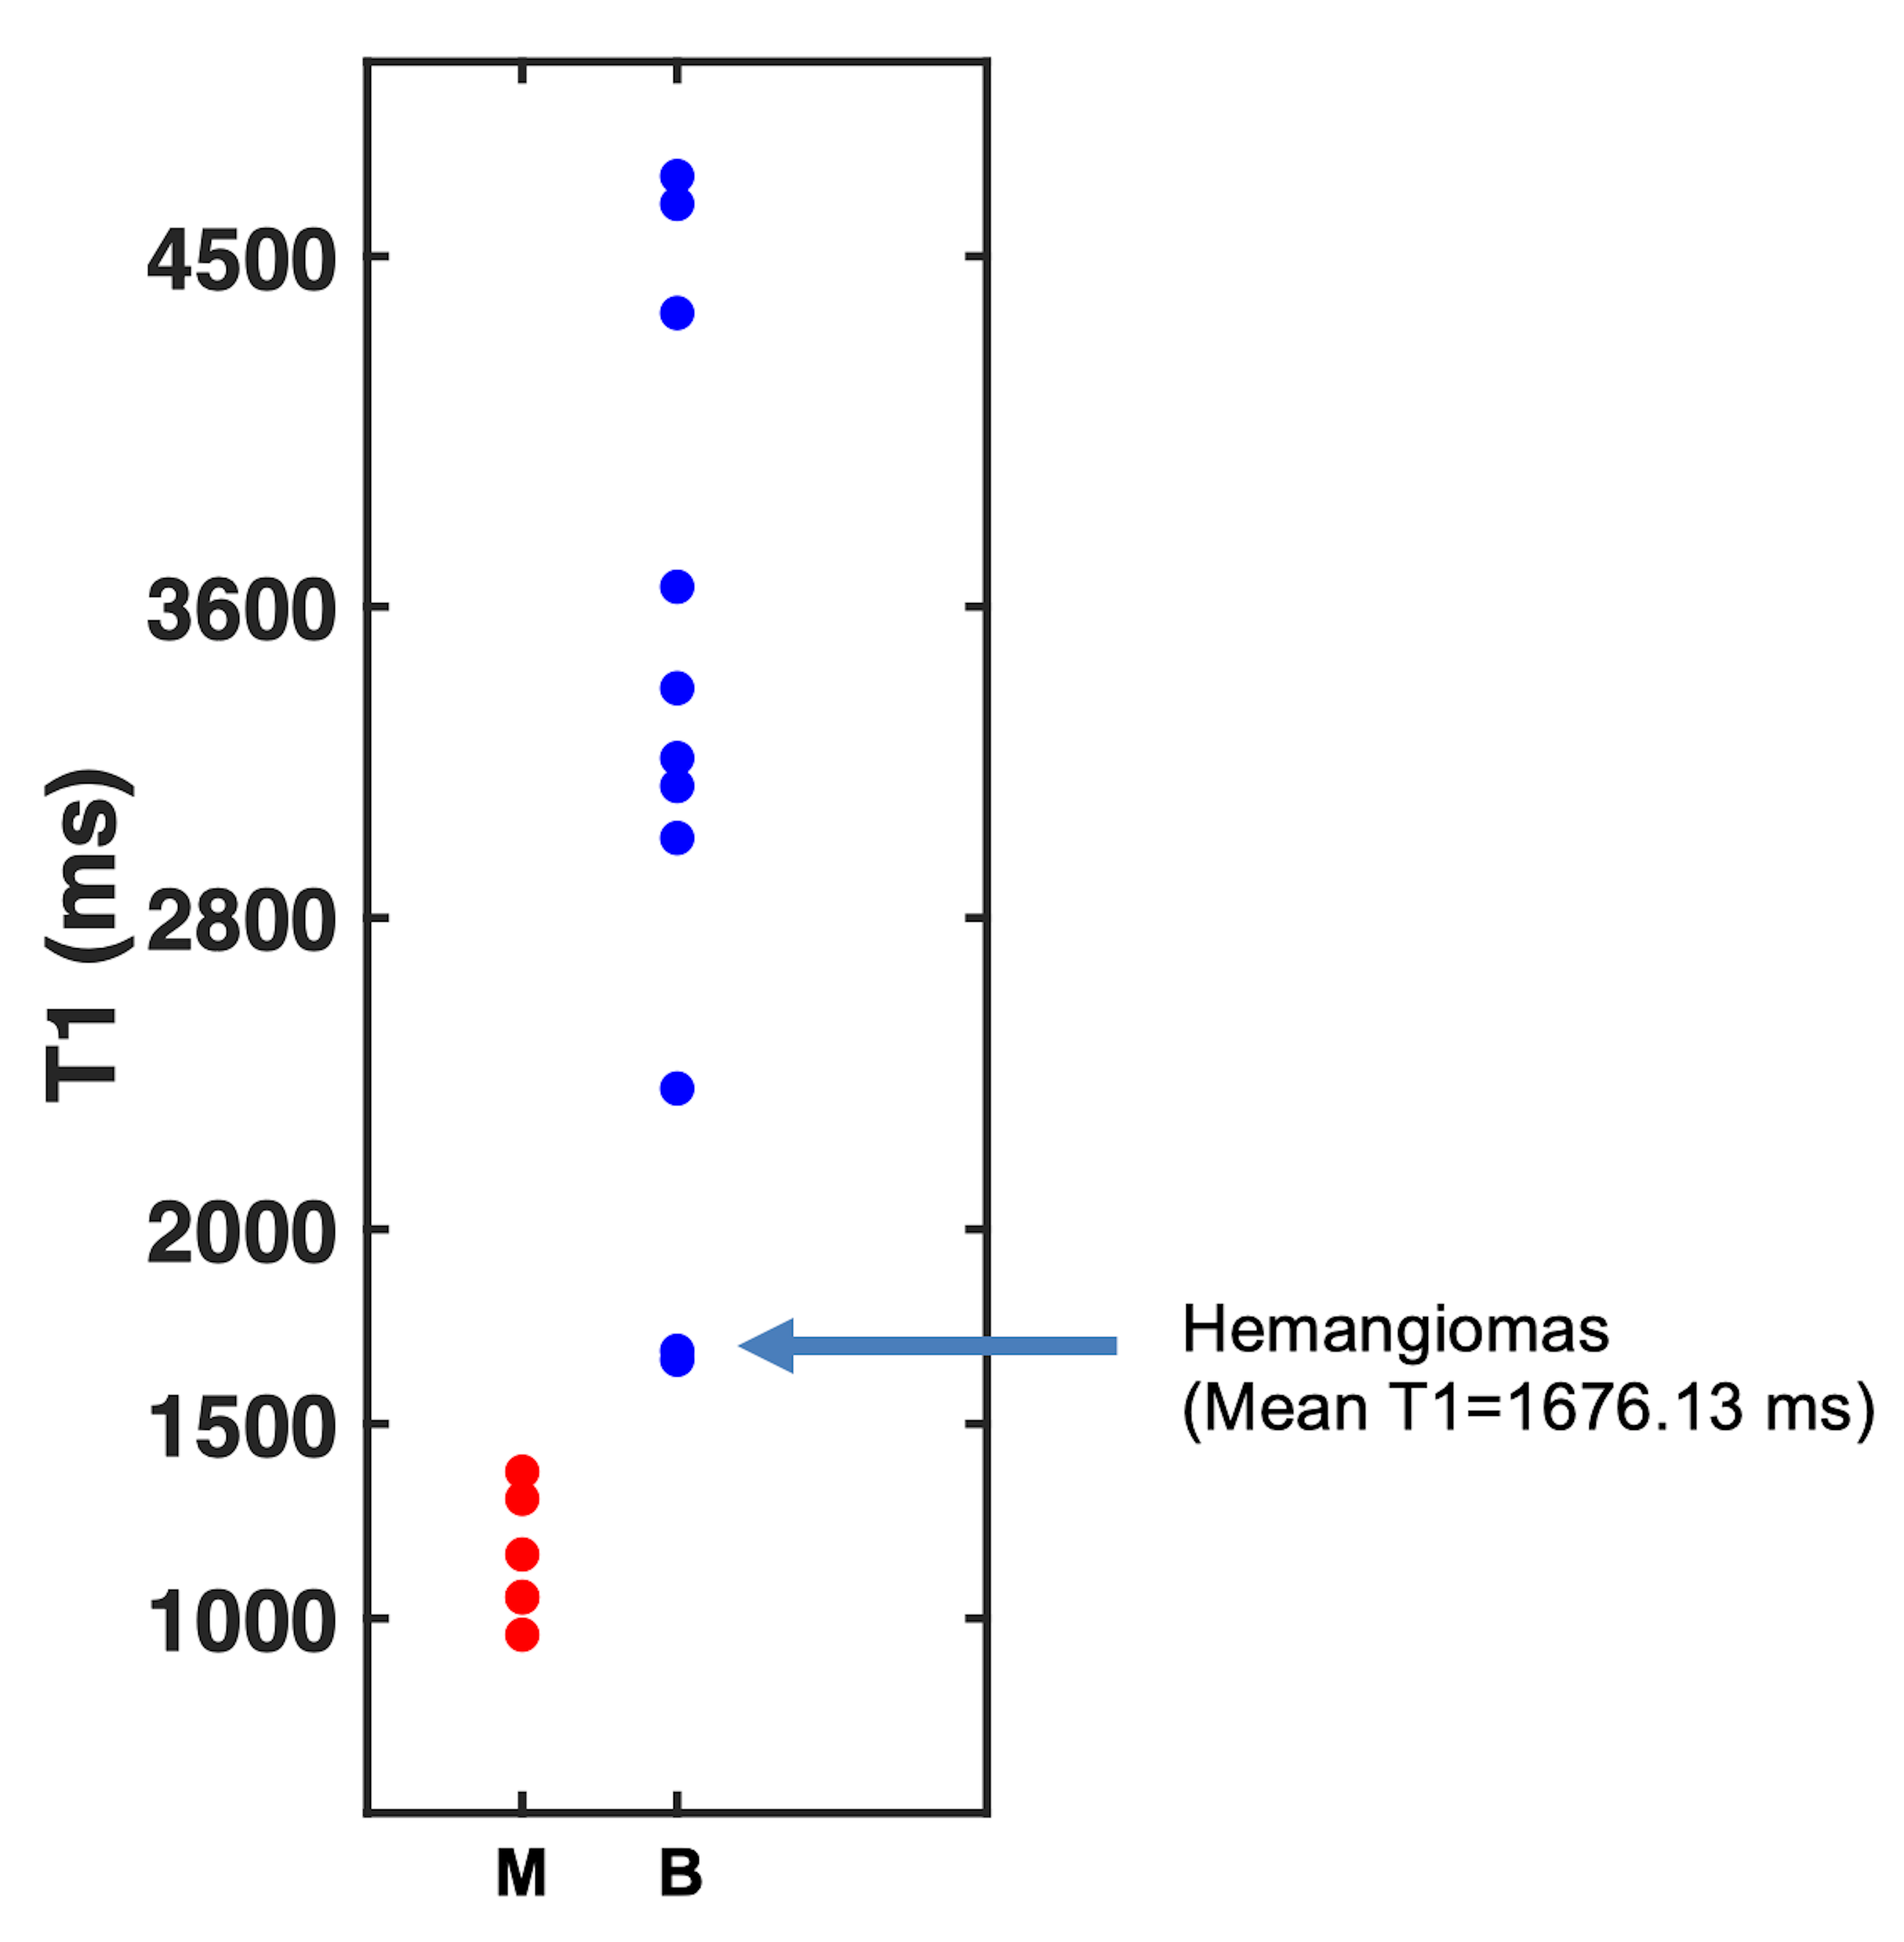
Figure 5 shows T1 estimates for all 28 lesions analyzed (ranging from 7mm to 5cm in diameter) demonstrating excellent separation between the two lesion classes even in the presence of PV. The mean T1s for malignancies (1097±207ms) are significantly different (p-value<1e-4,α=0.05) from benign lesions (4594±1354ms). Mean T1 of the liver (610±68ms) and spleen (1130±40ms) were also measured; T1s were comparable to reported values13.
CONCLUSION
We have presented a rapid technique for high-resolution multi-slice T1 mapping of the abdomen. The use of a joint two-component fit yields accurate T1 maps in the presence of partial volume. The utility of the sequence has been demonstrated for the characterization of abdominal neoplasms.Acknowledgements
The authors would like to acknowledge support from the Arizona Biomedical Research Commission (Grant ADHS14-082996) and the Technology and Research Initiative Fund (TRIF) Improving Health InitiativeReferences
[1] Curcic J, Sauter M, Schwizer W, Fried M, Boesiger P, Steingoetter A. Validation of a golden angle radial sequence (GOLD) for abdominal T1 mapping during free breathing: demonstrating clinical feasibility for quantifying gastric secretion and emptying. Journal of Magnetic Resonance Imaging. 2015 Jan;41(1):157-64.
[2] Ding Y, Rao SX, Zhu T, Chen CZ, Li RC, Zeng MS. Liver fibrosis staging using T1 mapping on gadoxetic acid-enhanced MRI compared with DW imaging. Clinical radiology. 2015 Oct 31;70(10):1096-103.
[3] Treier R, Steingoetter A, Goetze O, Fox M, Fried M, Schwizer W, Boesiger P. Fast and optimized T1 mapping technique for the noninvasive quantification of gastric secretion. Journal of Magnetic Resonance Imaging: An Official Journal of the International Society for Magnetic Resonance in Medicine. 2008 Jul;28(1):96-102.
[4] Kamimura K, Fukukura Y, Yoneyama T, Takumi K, Tateyama A, Umanodan A, Shindo T, Kumagae Y, Ueno SI, Koriyama C, Nakajo M. Quantitative evaluation of liver function with T1 relaxation time index on Gd‐EOB‐DTPA‐enhanced MRI: Comparison with signal intensity‐based indices. Journal of Magnetic Resonance Imaging. 2014 Oct;40(4):884-9.
[5] Cassinotto C, Feldis M, Vergniol J, Mouries A, Cochet H, Lapuyade B, Hocquelet A, Juanola E, Foucher J, Laurent F, De Ledinghen V. MR relaxometry in chronic liver diseases: comparison of T1 mapping, T2 mapping, and diffusion-weighted imaging for assessing cirrhosis diagnosis and severity. European journal of radiology. 2015 Aug 1;84(8):1459-65.
[6] Gambarota, G., Veltien, A., Van Laarhoven, H., Philippens, M., Jonker, A., Mook, O.R., Frederiks, W.M. and Heerschap, A., 2004. Measurements of T 1 and T 2 relaxation times of colon cancer metastases in rat liver at 7 T. Magnetic Resonance Materials in Physics, Biology and Medicine, 17(3-6), pp.281-287.
[7] Shah, B., Anderson, S.W., Scalera, J., Jara, H. and Soto, J.A., 2011. Quantitative MR imaging: physical principles and sequence design in abdominal imaging. Radiographics, 31(3), pp.867-880.
[8] Chen Y, Jiang Y, Pahwa S, Ma D, Lu L, Twieg MD, Wright KL, Seiberlich N, Griswold MA, Gulani V. MR fingerprinting for rapid quantitative abdominal imaging. Radiology. 2016 Jan 21;279(1):278-86.
[9] Katsube T, Okada M, Kumano S, Hori M, Imaoka I, Ishii K, Kudo M, Kitagaki H, Murakami T. Estimation of liver function using T1 mapping on Gd-EOB-DTPA-enhanced magnetic resonance imaging. Investigative radiology. 2011 Apr 1;46(4):277-83.
[10] Banerjee, R., Pavlides, M., Tunnicliffe, E. M., Piechnik, S. K., Sarania, N., Philips, R., Collier, J. D., Booth, J. C., Schneider, J. E., Wang, L. M., Delaney, D. W., Fleming, K. A., Robson, M. D., Barnes, E., … Neubauer, S. (2014). Multiparametric magnetic resonance for the non-invasive diagnosis of liver disease. Journal of hepatology, 60(1), 69-77.
[11] Li Z, Bilgin A, Johnson K, Galons JP, Vedantham S, Martin DR, Altbach MI. Rapid High‐Resolution T1 Mapping Using a Highly Accelerated Radial Steady‐state Free‐precession Technique. Journal of Magnetic Resonance Imaging. 2018 Aug 24.
[12] Huang, Chuan, et al. "Correcting partial volume effects in biexponential T2 estimation of small lesions." Magnetic resonance in medicine 73.4 (2015): 1632-1642.
[13] De Bazelaire CM, Duhamel GD, Rofsky NM, Alsop DC. MR imaging relaxation times of abdominal and pelvic tissues measured in vivo at 3.0 T: preliminary results. Radiology. 2004 Mar;230(3):652-9.
Figures