1026
Liver glycogen concentration and body hydration status are predictors of liver shMOLLI T1 measurements1Radcliffe Department of Medicine, University of Oxford, Oxford, United Kingdom, 2Department of Imaging Methods, Institute of Measurement Science, Slovak Academy of Sciences, Bratislava, Slovakia, 3Perspectum Diagnostics, Oxford, United Kingdom
Synopsis
Liver T1 measurements can be used to characterise liver disease but are also sensitive to physiologically normal liver changes. In this work, a set of metabolic interventions were performed to assess the effect of liver glycogen concentration and body hydration status on liver shMOLLI T1 measurements in healthy volunteers. Glycogen showed an in vivo relaxivity in keeping with literature phantom data and hydration status showed a smaller effect. Our results will impact the way T1 measurements of participants with impaired glycogen storage are interpreted, as well as instructions given to participants before their scans.
Introduction
The global prevalence of non-alcoholic fatty liver disease is estimated to be 20% and rising1. There is therefore an increased need for non-invasive diagnostic and therapy monitoring methods for this condition as an alternative to liver biopsy – the current gold-standard of diagnosing NAFLD. Recent studies have indicated that shortened modified Look-Locker inversion recovery (shMOLLI) T1 mapping of the liver may be a suitable option2,3. However, the relatively high standard deviation in shMOLLI T1 measurements of healthy individuals’ livers is still unexplained (coefficients of variation 6.8 % in liver2 compared to 2.6 % in myocardium4). We hypothesise that differences in glycogen and body hydration between participants contribute to this standard deviation. The aim of this study was to explore the effects of liver glycogen concentration and hydration changes on liver shMOLLI T1 values in healthy participants.Methods
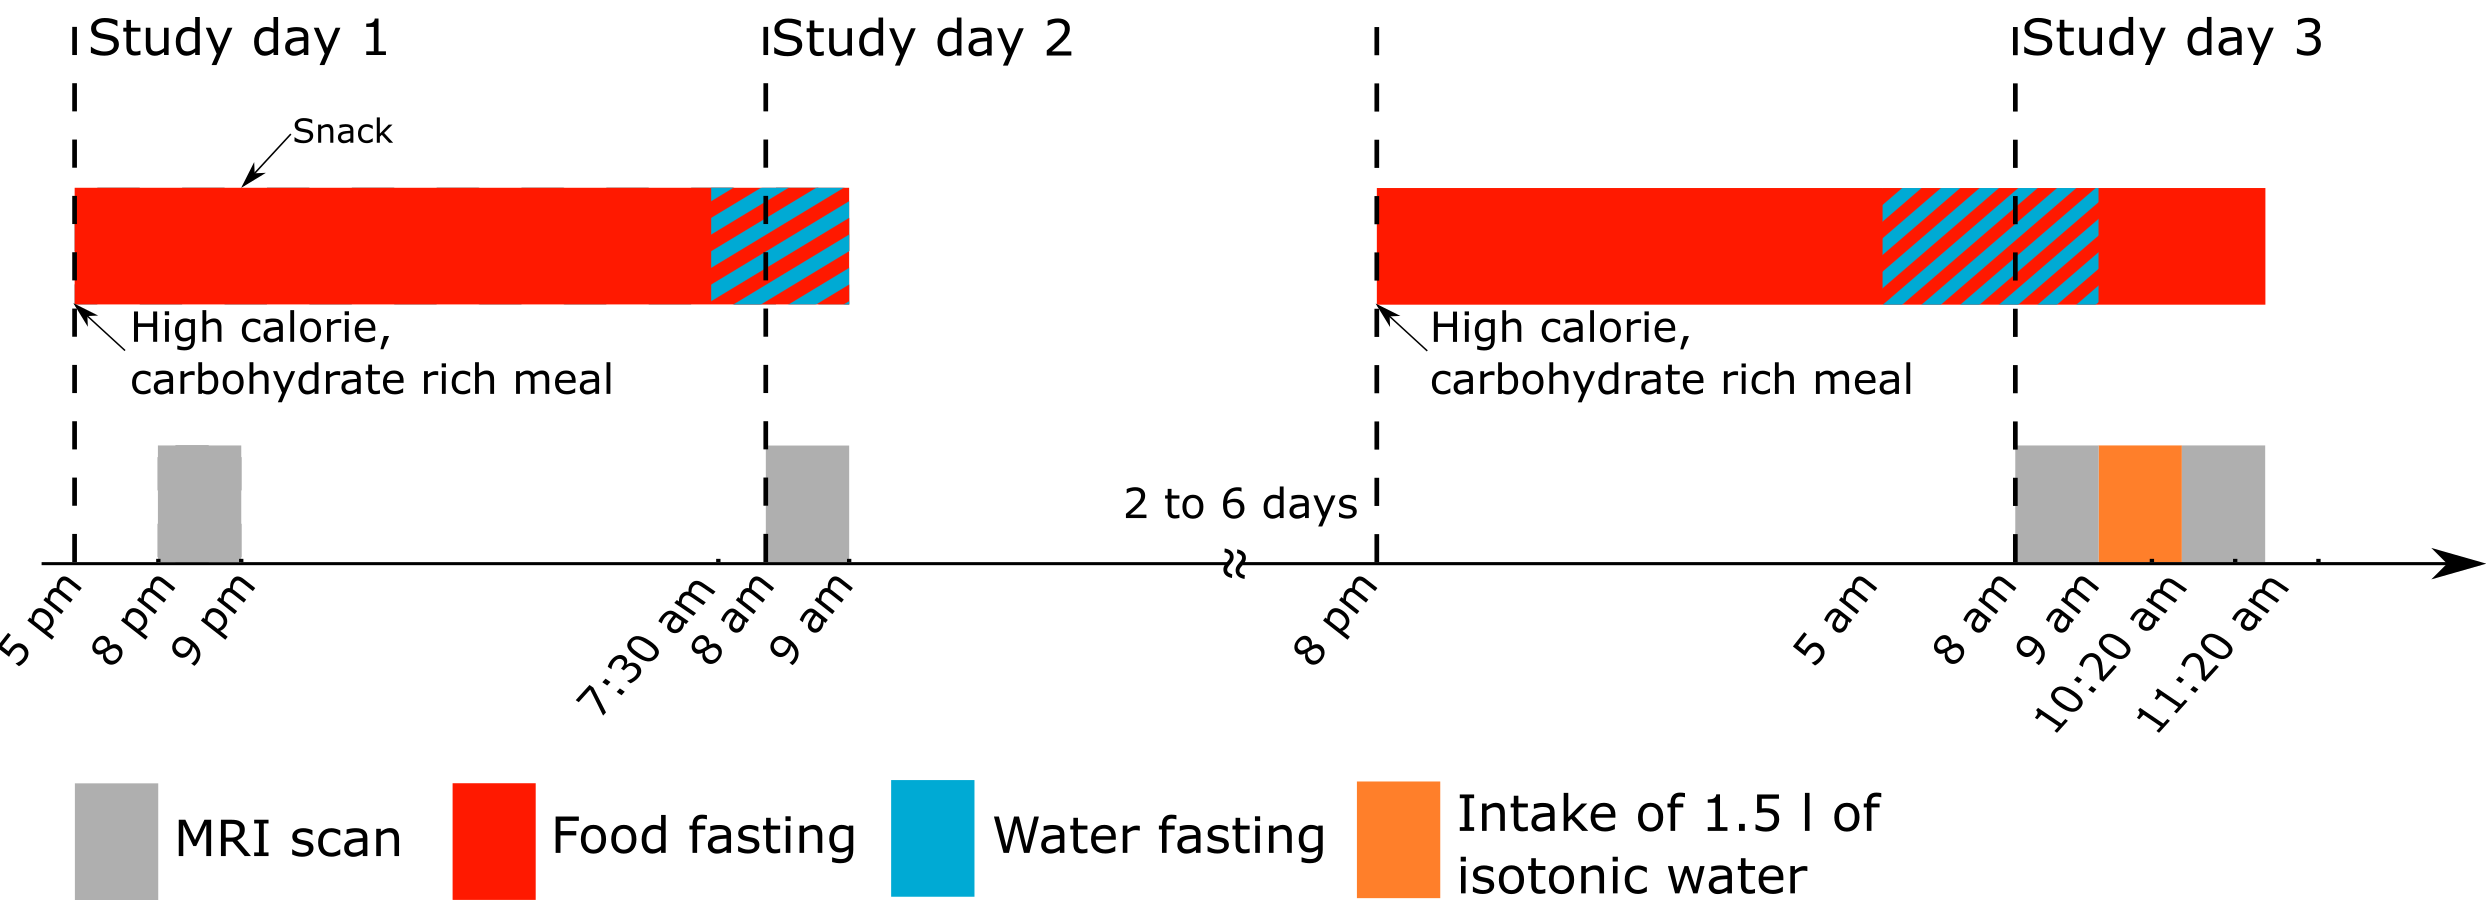
Eight healthy volunteers (3 female, mean age: 31±7 yrs) underwent shMOLLI T1 mapping, T2* mapping, magnetic resonance spectroscopy PDFF and non-localised natural abundance 13C spectroscopy on a 3 T Siemens Prisma imager (Erlangen, Germany) at four defined time points (fig. 1): 2 hours after the consumption of a 1300 kcal meal, 12 hours after the first scan after an overnight fasting period, then, on a subsequent visit, after 12 hours of fasting including 3 hours of water fasting following another 1300 kcal meal, and finally 1 hour later after drinking 1.5 dm3 of isotonic water. The ratio of the cross-sectional area of the inferior vena cava and the aorta (IVC/Ao) was used as a surrogate marker of hydration, and glycogen concentrations were derived from the 13C MRS data using the phantom replacement method5. Paired t-tests were used to compare shMOLLI T1 values before and after the interventions, as well as glycogen before and after fasting and IVC/Ao before and after hydration. Linear mixed models were used to determine shMOLLI T1 dependence on glycogen concentration and IVC/Ao. This in vivo glycogen relaxivity was compared to published glycogen relaxivities in phantoms. IVC/Ao was also used to estimate central venous pressure (CVP)6 and thence liver blood volume7. The range in change in blood volume was input to an existing Bloch simulation-based model8 for liver T1 for comparison with the changes in T1 measured with hydration.Results
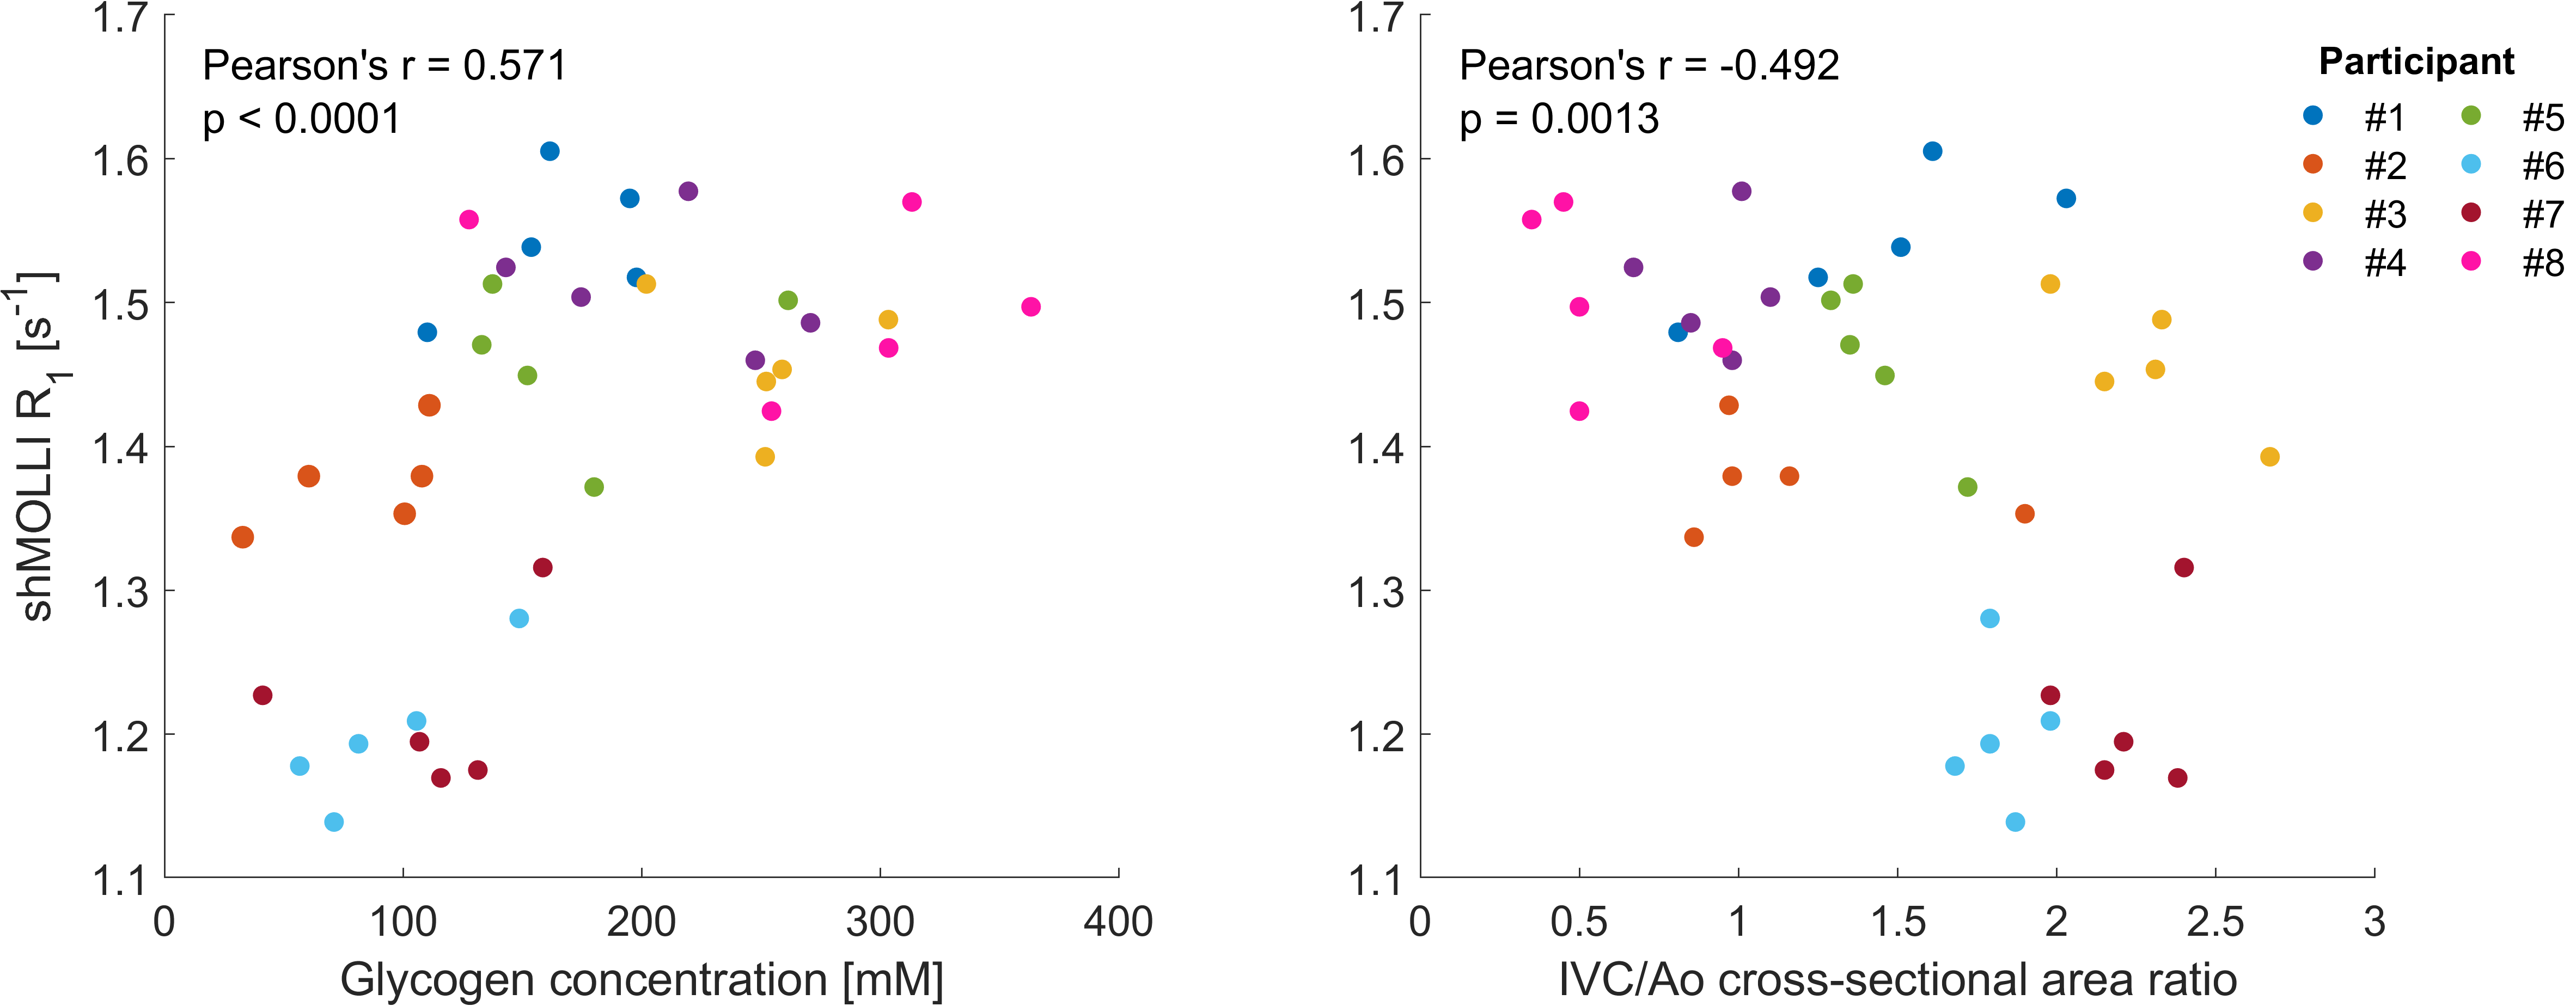
All participants had T2*>17 ms and their PDFF ranged from 0.27% to 3.13%. There was a mean decrease of 35 ms (p=0.004) between the fed and the fasted shMOLLI T1 measurements, associated with a mean decrease in glycogen of 46 mM (p<0.001). The relationship between shMOLLI R1 and liver glycogen concentration was: $$$1/T_1(Hz)=1.18+1.17[Glyco](M)$$$. There was a mean increase of 19 ms (p=0.103) between the water-fasted and the well-hydrated shMOLLI T1 measurements. The mean increase in IVC/Ao of 0.09 (p=0.047) implied an increase in CVP of around 2 mmHg, corresponding to a change in liver blood percentage from 18.5% to 20%. In simulations this led to an increase in T1 of 16 ms. The implied relationship between shMOLLI R1 values and IVC/Ao ratio was: $$$1/T_1(Hz)=1.48–0.05IVC/Ao$$$.Discussion and conclusion
Using metabolic interventions we have shown that liver T1 values of healthy volunteers are affected by liver glycogen concentration and overall body hydration status. The in vivo relaxivity of glycogen is comparable to the relaxivity derived in phantoms at 3 T of 1 M-1s-1 9. Similarly, the changes seen with hydration, while not statistically significant, are in line with modelling predictions. The changes, on the order of 20-30 ms in T1, correspond to half an Ishak stage when compared to T1 changes in patients with liver fibrosis8. This change in T1 is similar in size to the change predicted by our model when considering [Glyco] = 160 mM for healthy volunteers and [Glyco] = 100 mM for diabetic patients10. A large study in an older normal population who did not receive instructions regarding food or drink consumption prior to their MRI scans11 found interquartile ranges in men and post-menopausal women of around 70 ms. Given a normal range in hepatic glycogen of 100-200 mM10 and based on their median T1 of 666 ms, we would expect to see a range, purely based on normal glycogen variation, from 635 ms to 700 ms. We note that glycogen is a direct relaxation agent on T1, and our results can be generalised to other liver T1 measurement methods. We expect that our findings will impact the instructions given to liver MRI study participants before scans. Our results also affect interpretation of data from subjects who are dieting and patients with impaired liver glycogen storage and therefore, care should be taken when planning new studies, depending on the desired achievable effect size reflected by T1 values.Acknowledgements
The research was funded by a UK Medical Research Council Doctoral Training Award (MR/K501256/1), a Scatcherd European Scholarship, the RDM Scholars Programme, and by the National Institute for Health Research (NIHR) Oxford Biomedical Research Centre Programme. The views expressed are those of the authors and not necessarily those of the NHS, the NIHR or the Department of Health.References
1. Younossi, Z. M. et al. Global epidemiology of nonalcoholic fatty liver disease-Meta-analytic assessment of prevalence, incidence, and outcomes. Hepatology 64, 73–84 (2016).
2. Banerjee, R. et al. Multiparametric magnetic resonance for the non-invasive diagnosis of liver disease. J. Hepatol. 60, 69–77 (2014).
3. Pavlides, M. et al. Multiparametric magnetic resonance imaging predicts clinical outcomes in patients with chronic liver disease. J. Hepatol. 64, 308–315 (2016).
4. Piechnik, S. K. et al. Normal variation of magnetic resonance T1 relaxation times in the human population at 1.5 T using ShMOLLI. J. Cardiovasc. Magn. Reson. 15, 13 (2013).
5. Lei, H., Morgenthaler, F., Yue, T. & Gruetter, R. Direct validation of in vivo localized13C MRS measurements of brain glycogen. Magn. Reson. Med. 57, 243–248 (2007).
6. El-Baradey, G. F. & El-Shmaa, N. S. Does caval aorta index correlate with central venous pressure in intravascular volume assessment in patients undergoing endoscopic transuretheral resection of prostate? Saudi J. Anaesth. 10, 174–8 (2016).
7. Sato, T., Shirataka, M., Ikeda, N. & Grodins, F. S. Steady-state systems analysis of hepatic hemodynamics in the isolated perfused canine liver. Am. J. Physiol. Integr. Comp. Physiol. 233, R188–R197 (1977).
8. Tunnicliffe, E. M., Banerjee, R., Pavlides, M., Neubauer, S. & Robson, M. D. A model for hepatic fibrosis: the competing effects of cell loss and iron on shortened modified Look-Locker inversion recovery T1 (shMOLLI-T1) in the liver. J. Magn. Reson. Imaging (2016). doi:10.1002/jmri.25392
9. Mozes, F. E., Tunnicliffe, E. M. & Robson, M. D. Correction of the effects of asymmetric bSSFP echo on (sh)MOLLI T1 maps of water-fat mixtures at 3 T an its implication on fatty liver imaging. in Proceedings of the ISMRM Workshop on Quantitative Body Imaging (2018).
10. Stephenson, M. C. et al. Simultaneous Changes in Liver Volume, Lipid Content and Glycogen Cntent in Type 2 Diabetes, Obese Subjects and Normal Controls after a Mixed Meal. in Proc. Intl. Soc. Mag. Reson. Med. 17 2138 (2009).
11. Mojtahed, A. et al. Reference range of liver corrected T1 values in a population at low risk for fatty liver disease—a UK Biobank sub-study, with an appendix of interesting cases. Abdom. Radiol. 1–13 (2018). doi:10.1007/s00261-018-1701-2
Figures