1025
Imaging Diamagnetic Susceptibility of Collagen in Hepatic Fibrosis using Susceptibility Tensor ImagingHongjiang Wei1 and Chunlei Liu1
1University of California, Berkeley, Berkeley, CA, United States
Synopsis
We propose to quantify susceptibility anisotropy of collagen in the liver using susceptibility tensor imaging (STI). Magnetic susceptibility anisotropy measured by STI differentiates the anisotropic collagen fibers which
Introduction
Liver fibrosis is a typical complication of chronic liver diseases and characterized by the accumulation of extracellular matrix proteins such as collagen in the liver interstitial space1. Previous studies have shown that magnetic susceptibility anisotropy exists in the collagen of myofibers and in the collagen fibril in the articular cartilage2. In this study, we propose to quantify susceptibility anisotropy of collagen in the liver fibrotic tissues using susceptibility tensor imaging (STI)3. Magnetic susceptibility anisotropy measured by STI differentiates the anisotropic collagen fibers which is associated with the severity of liver fibrosis from iron deposition. The results are compared with histology to inform the interpretation of collagen content in the liver fibrosis tissues. Our results suggest that magnetic susceptibility anisotropy is a quantitative marker for collagen content in cirrhotic liver disease.Methods
Liver tissues obtained at biopsy or transplant were immersed in 10% formalin and then immersed in 10 mM phosphate buffered saline (PBS). A 3D GRE sequence was used with the following parameters: TE1/TE spacing/TE15=5.8/9.6/63.4 ms, TR=100ms, isotropic spatial resolution=57μm. 12 image orientations were acquired for each specimen. DTI datasets were acquired using two spin-echo (SE) scans with b=0 s/mm2 and 12 diffusion-encoded SE scans with b = 1500 s/mm2 (isotropic resolution=100μm). The susceptibility tensor was calculated using STISuite software. The eigenvalues of the susceptibility tensor (χ1, χ2, χ3), mean magnetic susceptibility (MMS) = (χ1 + χ2 + χ3)/3, MSA given by 𝛥χ = χ1 – (χ2 + χ3)/2 were calculated. After the MRI scan, liver specimens were examined using standard hematoxylin-eosin (H&E) staining, iron staining, and Masson’s trichrome staining.Results
Fig. 1 shows the variation of R2* signal, of GRE phase and of QSM images measured at three orientations. The fibrotic tissue exhibits a decrease R2* compared to surroundings. The GRE phase of the collagen fibers were strongly dependent on orientation. The phase values were positive when collagen fiber was perpendicular to B0 but negative when collagen fiber parallel to B0. Compared to the strongly orientation-dependent phase images, the computed magnetic susceptibility maps show clear orientation dependency as indicated by yellow arrows in Fig.1 and the line profiles in Fig.2. Fig. 3 compares the tensor eigenvalues, MMS, MSA, MD and FA. There are dramatic visual differences between the diagonal terms of susceptibility and diffusion tensors. The susceptibility tensor provides higher image contrast than the diffusion tensor. White arrows indicate the similarities shared by STI and DTI for detecting large septa. MSA exhibits dramatic susceptibility anisotropy of collagen while DTI FA map shows weak contrast and is prone to noise corruptions and other artifacts. Fig.4 shows the typical H&E, iron and Masson’s trichrome staining of livers with fibrosis at stage 2 and 5. Fig.4f shows more severe liver damage compared to Fig.4e, as evidenced by the disruption of the tissue architecture, large fibrous septa formation, and fibers accumulation. Representative slices of MSA maps showed a clear difference between the two fibrotic tissues.Discussion
In this study, we demonstrated the diamagnetic susceptibility of collagen fiber within the fibrotic liver and assessed the utility of STI for imaging the susceptibility anisotropy of collagen fibers at different stages of liver fibrosis. We compared susceptibility measurements to diffusion measurements and concluded that susceptibility has a higher sensitivity to collagen fibers as measured by anisotropy values. Finally, we demonstrated that MSA provides a more specific marker for collagen fibers while differentiating the confounding iron deposition which tends to have isotropic and paramagnetic susceptibility.Conclusion
The experimental results in this study demonstrated the feasibility of imaging and quantifying magnetic susceptibility of the collagen fibers within fibrotic liver tissues ex vivo. MSA measured by STI excludes the susceptibility from iron and can quantify collagen fibers which is associated with the severity of liver fibrosis.Acknowledgements
No acknowledgement found.References
1. Moradpour D. et al., The molecular pathogenesis of hepatocellular carcinoma. J Viral Hepat, 194;1:17-31. 2. Dibb, R., et al., Magnetic susceptibility anisotropy outside the central nervous system. NMR Biomed, 2017. 30(4). 3. Liu, C., Susceptibility tensor imaging. Magn Reson Med, 2010. 63(6): p. 1471-7.Figures
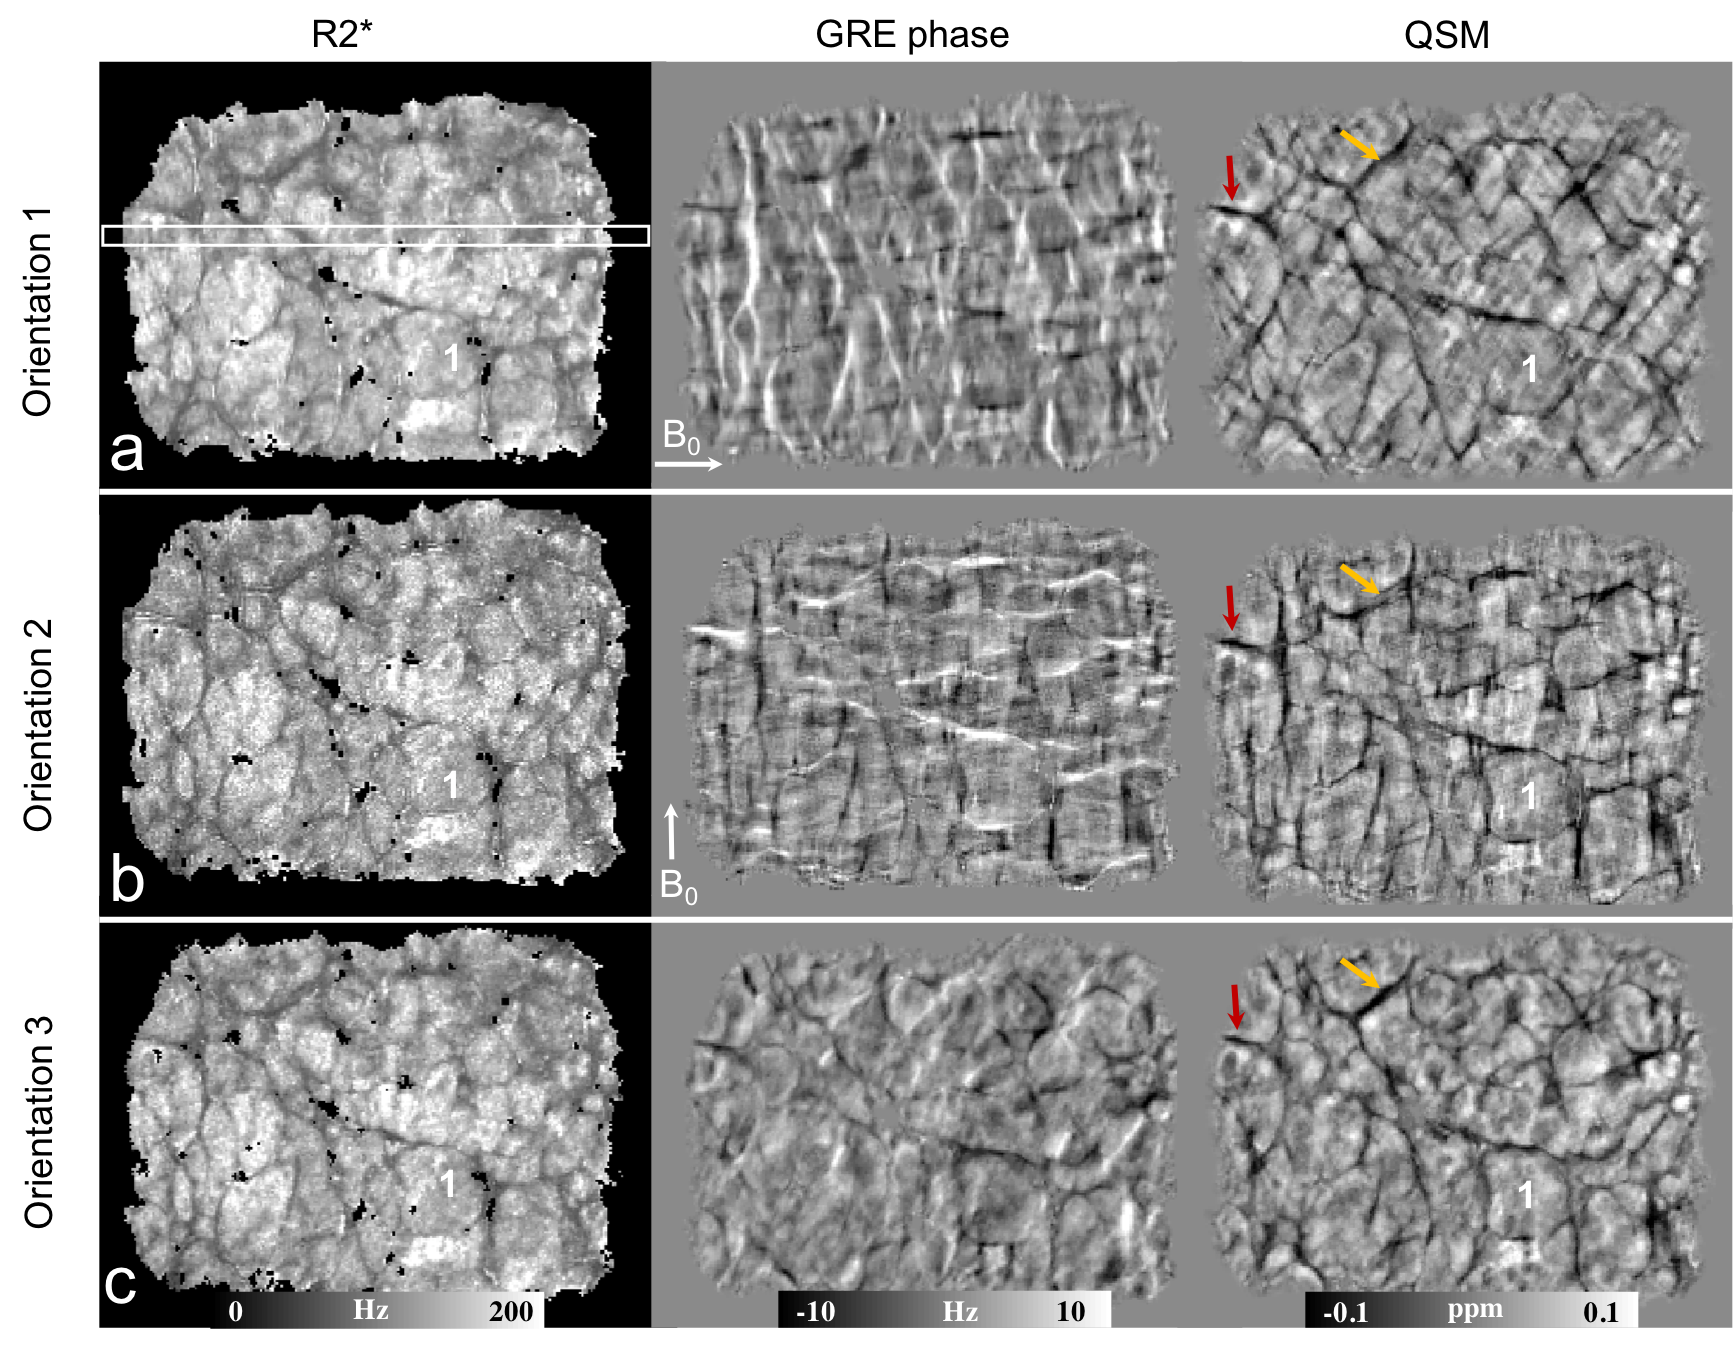
Fig. 1. B0-orientation-dependent modulation of R2*, GRE phase and magnetic susceptibility contrast in liver fibrosis tissue in three orientations (top, B0 is along the left-right direction; middle, B0 is along the up-down direction; bottom, B0 is approximately along diagonal orientation). The GRE phase of the liver tissue varies markedly from one orientation to another. The magnetic susceptibility of the collagen shows a relative small B0 field-orientation dependency. For example, yellow arrows indicate the collagen fiber has a large orientation-dependent magnetic susceptibility than that indicated by red arrows.
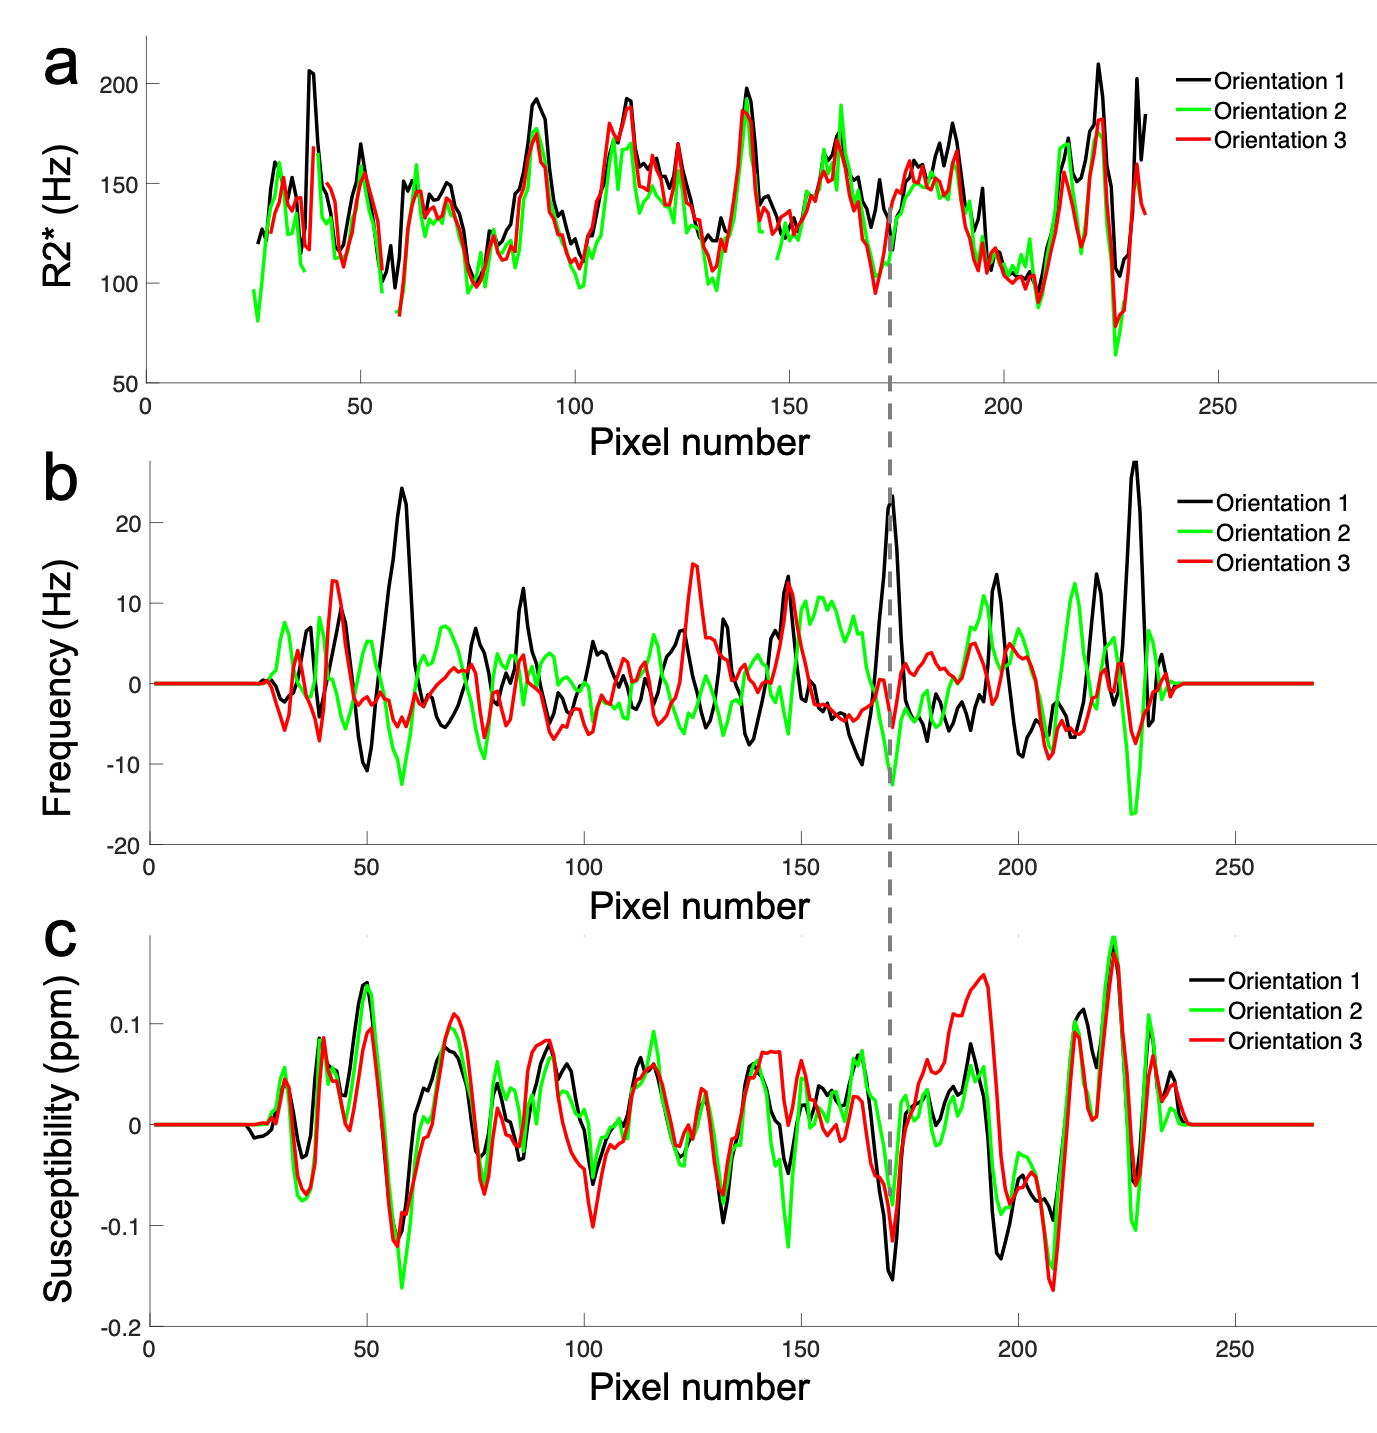
Fig. 2. R2*, GRE phase and susceptibility profiles along a single projection through the tissue within the white box in Fig.1a. All the image contrasts exhibit orientation dependency as indicated by vertical dashed line.
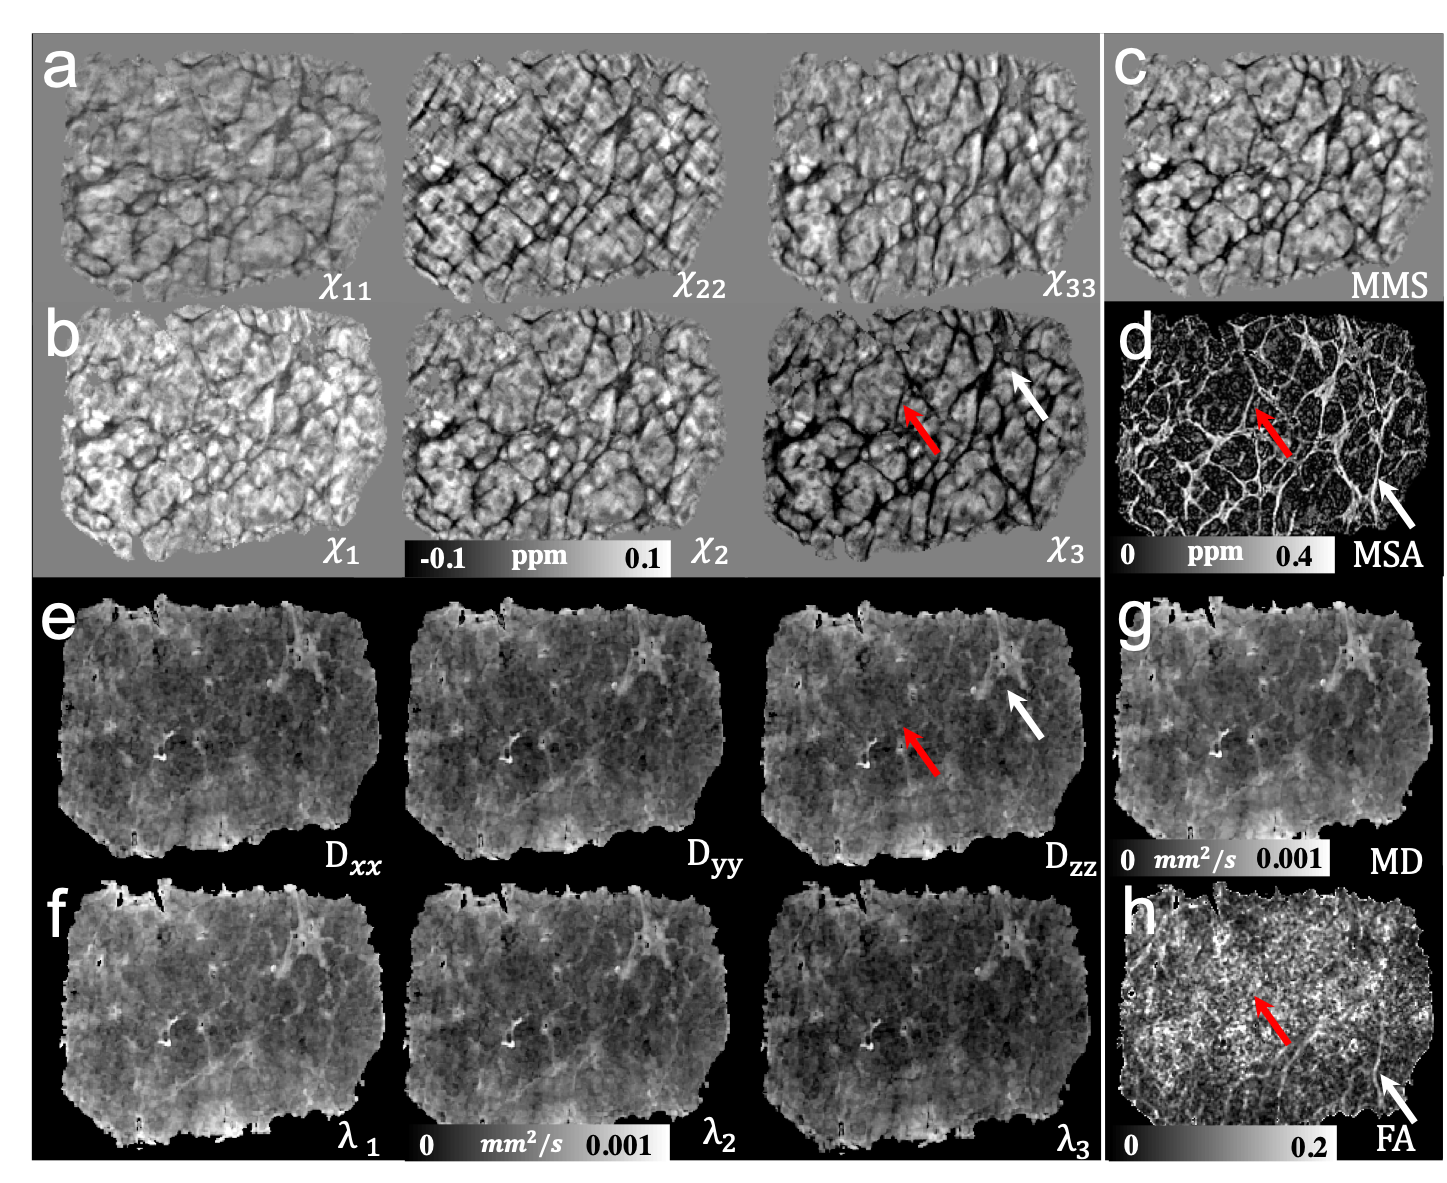
Fig. 3. Maps of (a) the diagonal terms
and (b) the eigenvalues of the susceptibility tensors. (c) Mean magnetic
susceptibility (MMS). (d) Magnetic susceptibility anisotropy (MSA). Maps of (e)
the diagonal terms and (f) the eigenvalues of the diffusion tensors. (g) Mean
diffusivity (MD). (h) Fractional anisotropy (FA).
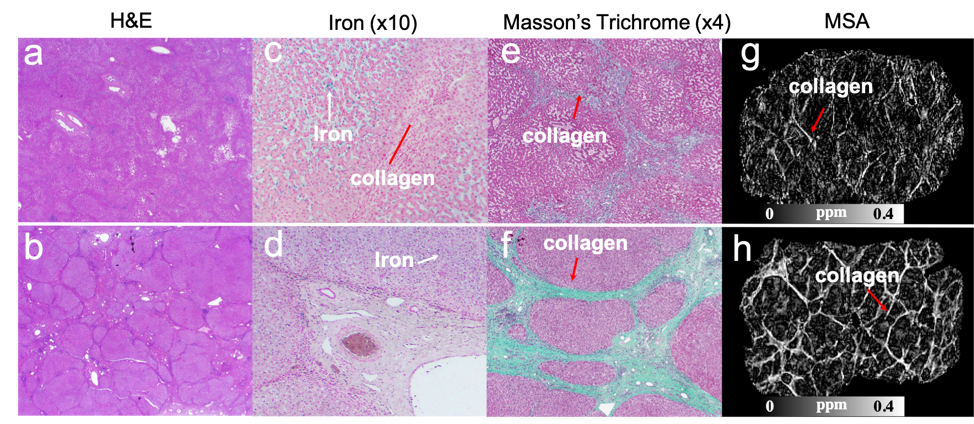
Fig. 4. Typical
H&E staining, iron staining and Masson’s trichrome staining of two liver
fibrosis tissues. (a) liver fibrosis with stage 2 shows that collagen
deposition (red arrows) and iron co-exist within the tissue. (b) liver fibrosis
with stage 5 exhibits clear septa formation with dense collagen deposition. MSA
demonstrates clear difference between (a) and (b).