1023
Multi-Site, Multi-Vendor, and Multi-Platform Reproducibility and Accuracy of Quantitative Proton-Density Fat Fraction (PDFF) at 1.5 and 3 Tesla with a Standardized Spherical Phantom: Preliminary Results from a Study by the RSNA QIBA PDFF Committee1Radiology, Nationwide Children's Hospital, Columbus, OH, United States, 2Radiology, UT Southwestern Medical Center, Dallas, TX, United States, 3Medical Physics, Radiology, and Biomedical Engineering, University of Wisconsin Madison, Madison, WI, United States, 4Calimetrix, LLC, Madison, WI, United States, 5Radiology, Division of Gastroenterology, and Center for Advanced Magnetic Resonance Development, Duke University Medical Center, Durham, NC, United States, 6Liver Imaging Group, Radiology, UC San Diego, San Diego, CA, United States, 7Radiology, Children's Hospital of Philadelphia, Philadelphia, PA, United States, 8Radiology, University of Michigan, Ann Arbor, MI, United States, 9Radiology, Mayo Clinic, Rochester, MN, United States, 10Radiology, Cinncinati Children's Hospital Medical Center, Cinncinati, OH, United States, 11Radiology, University of Wisconsin Madison, Madison, WI, United States, 12RSNA, Oak Brook, IL, United States
Synopsis
Proton Density Fat Fraction (PDFF) is a widely-accepted quantitative MRI biomarker of hepatic steatosis. Formed in 2015, the PDFF Committee of the RSNA QIBA initiative promotes standardized usage of PDFF for clinical care and research. In this work, the committee describes preliminary results from a multi-center, multi-vendor, multi-platform, and multi-protocol study to characterize the accuracy and reproducibility of PDFF as measured by commercially-available 2D and 3D spoiled-gradient-recalled-echo sequences in a standardized phantom with known PDFF reference targets ranging from 0-100%. Results show that confounder-corrected PDFF reconstructed from multi-fat-spectral peak modeling is an accurate and precise quantitative measurement of PDFF, with minimal bias and strong linearity.
Introduction
Proton Density Fat Fraction (PDFF) has emerged as a robust and widely accepted imaging biomarker of hepatic steatosis (1-4). The PDFF Biomarker Committee was formed in 2015 as a part of the Quantitative Imaging Biomarkers Alliance (QIBA) of the Radiological Society of North America (RSNA). It is tasked with initiatives that promote standardized usage of MRI-based PDFF for clinical care and research. The committee also aims to facilitate adoption and standardization of quantitative PDFF protocols across institutions and vendors. An important mission of QIBA is to comprehensively characterize biomarker performance in terms of bias, repeatability, and reproducibility, under real-world variations in MRI hardware and software (i.e., reconstruction algorithms) across vendors and operators. As a part of this QIBA effort, the committee is currently conducting a multi-center and multi-vendor phantom study to characterize the accuracy and reproducibility of PDFF as measured by vendor-native spoiled-gradient-recalled-echo chemical-shift-encoded sequences against a set of known PDFF values.
Materials and Methods
At the time of abstract submission in November 2018, four sites have performed scans of the standardized PDFF phantom (described below). Fig.1 summarizes the distribution of three vendors (V1, V2, V3), the scanner field strengths, and corresponding data acquired for three protocols (P1, P2, P3) at each of the four sites. A wide array of commercially-available 1.5T and 3T platforms from GE Healthcare, Siemens Medical Solutions, and Philips Healthcare have been included in the study.
Phantom: A photo and PDFF image of the phantom is shown in Fig.1. The phantom was constructed by Calimetrix (Madison, Wisconsin). Blinded to the ground-truth PDFF values, each site was instructed to use an available multi-channel torso coil array or a standard head array coil and acquire data in the axial plane with the phantom oriented as shown in Fig.1. The phantom was placed in a storage case fitted with contoured foam padding and shipped via courier between sites.
Protocols: P1 was the vendor-sourced “out-of-the-box” quantitative liver PDFF protocol. Each site was instructed to run P1 “as is”, using default parameters for GE Healthcare’s IDEAL-IQ, Siemens Medical Solutions’ LiverLab, and Philips Healthcare’s mDIXON-Quant. P2 was the QIBA committee’s recommended protocol for PDFF acquisition. P3 was the Liver Imaging of Phase-interference signal Oscillation and Quantification (LIPO-Quant) protocol. Each site was instructed to follow P2 and P3 data acquisition parameters outlined in Fig.2 as closely as possible, and submit the data to an independent evaluator at Site 3 for confirmation and quality check. For P1 and P2, each individual vendor’s online multi-fat-peak complex-based data reconstruction algorithm and software was used for PDFF generation, with no modifications to reconstruction parameters. No work-in-progress software was used in this work. For P3, DICOM source multi-echo data were sent to an additional independent site (not one of the four scan sites) for multi-fat-peak magnitude-based data reconstruction and LIPO-Quant PDFF generation.
Preliminary Analysis: ROI-based measurements of PDFF from each vial, acquisition, protocol, and site were made by a single observer at Site 3, who performed statistical analysis and created data plots. The average ROI encompassed between 60-80 voxels within the cross section of each vial. Since LIPO-Quant is a magnitude-based technique that only computes PDFF from 0-50%, ROI measurements for Vial #12 (PDFF=100%) for P3 are not included in the Results.
Results
Fig.3 summarizes intra-institution repeatability data for Sites 3-4 where test-retest scans were performed approximately one week apart. Bland-Altman statistics (i.e., differences between two measurements) are shown on the last row, where the 95% confidence interval includes zero (i.e., no difference) for all paired measurements.
Fig.4 tabulates
results from Sites 1-2. Multiple One-way ANOVA tests performed across all permutations of four sites, three vendors, two field strengths, and three protocols revealed no statistically significant differences in measured PDFF in the 12 vials.
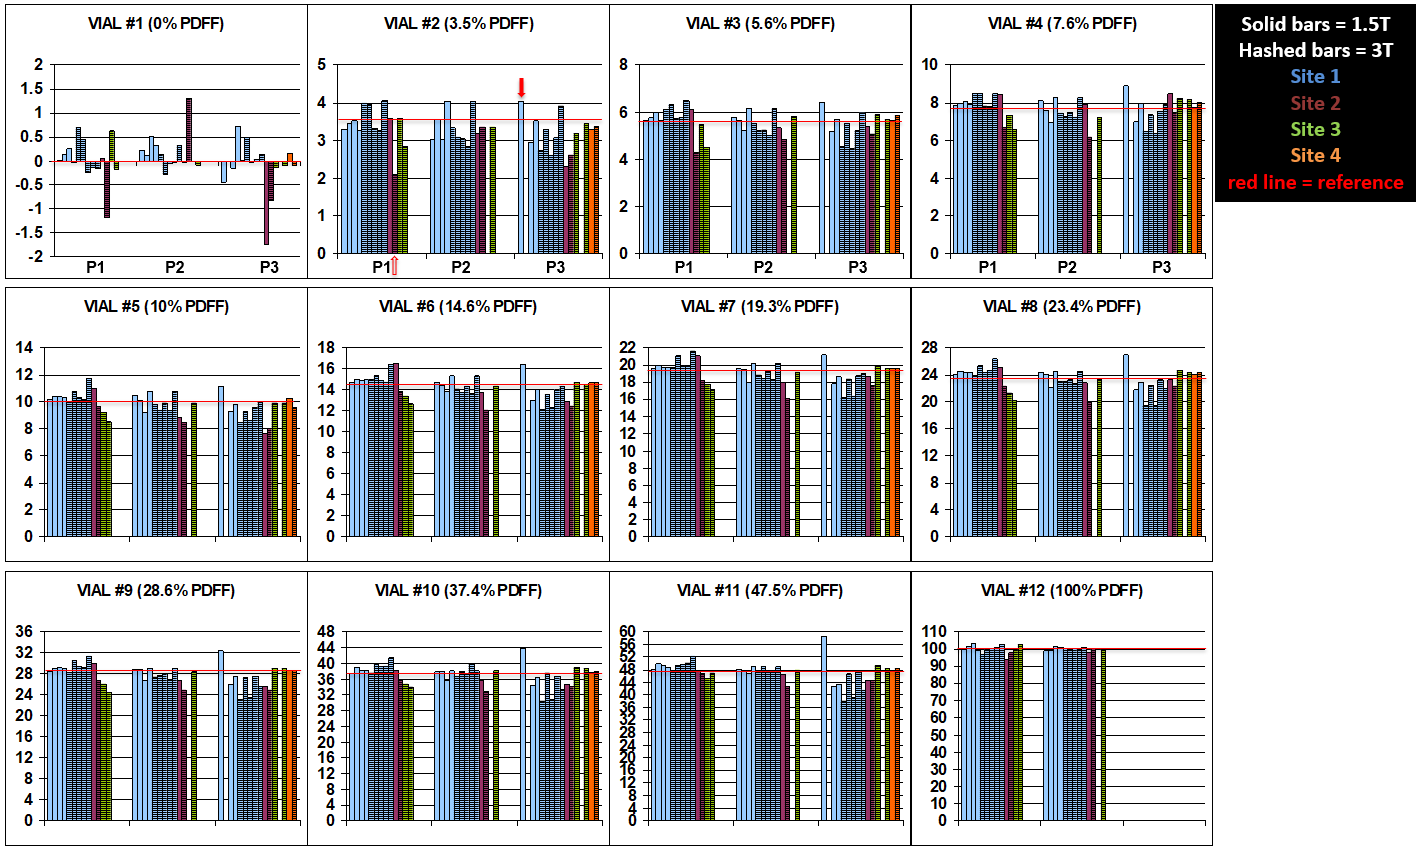
Fig.5 illustrates a global view of the data individually for each vial and scanner field strength across all sites, highlighting overall strong accuracy as well as protocol-to-protocol and 1.5T vs. 3T reproducibility.
Pooling all data collected so far (61 independent scans of the phantom), a linear regression of the combined PDFF results against the reference values yields a slope of 0.998, an intercept of -0.336, and a correlation coefficient of 1.0.
Conclusion
Quantitative PDFF data collected thus far in a standardized phantom at four sites using three vendors, two magnetic field strengths, and three protocols demonstrate strong accuracy and reproducibility with minimal bias. One notable contribution of this study is the inclusion of both vendor-native complex-based water-fat separation and PDFF reconstructions as well as an independent magnitude-based reconstruction algorithm. The study is ongoing, with five additional sites in queue.
Acknowledgements
The authors would like to thank clinical scientists from each of the three vendors who support each one of the sites involved in this study for research assistance with this endeavor. The authors would like to thank the RSNA QIBA initiative for continued support. The authors wish to acknowledge support from the NIH (K24 DK102595, R01 DK088925, R41 EB025729). The authors also wish to thank Calimetrix for loaning the PDFF phantom for this study. JH Brittain, D Hernando and SB Reeder are founders of Calimetrix.
References
[1] Kang GH, et al. Reproducibility of MRI-determined proton density fat fraction across two different MR scanner platforms. JMRI 2011; 34(4): 928-934. PMID: 21769986
[2] Artz NS, et al. Reproducibility of MR-based liver fat quantification across field strength: Same-day comparison between 1.5T and 3T in obese subjects. JMRI 2015; 42(3): 811-817. PMID: 25620624
[3] Wu B, et al. Reproducibility of Intra- and Inter-scanner Measurements of Liver Fat Using Complex Confounder-corrected Chemical Shift Encoded MRI at 3.0 Tesla. Sci Rep 2016; 6:19339. PMID: 26763303
[4] Yokoo T, et al. Linearity, Bias, and Precision of Hepatic Proton Density Fat Fraction Measurements by Using MR Imaging: A Meta-Analysis. Radiology 2018(2): 486-498. PMID: 28892458
Figures
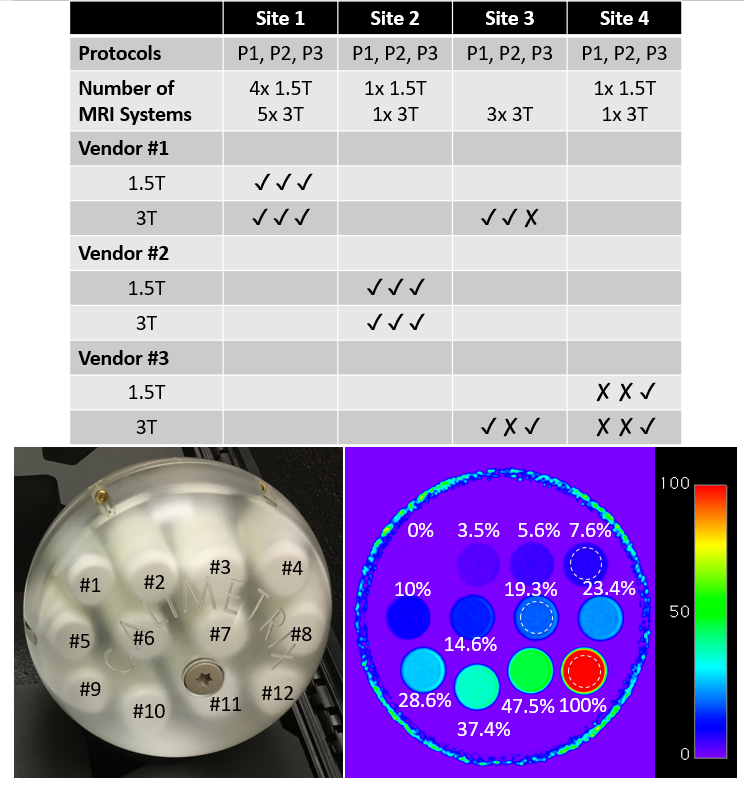
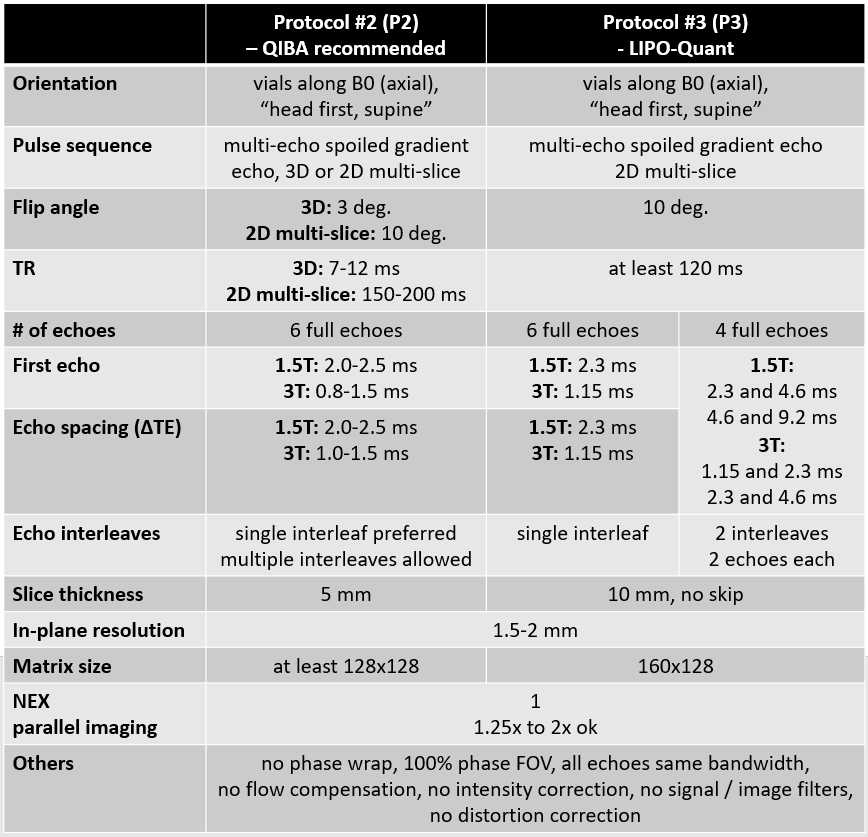
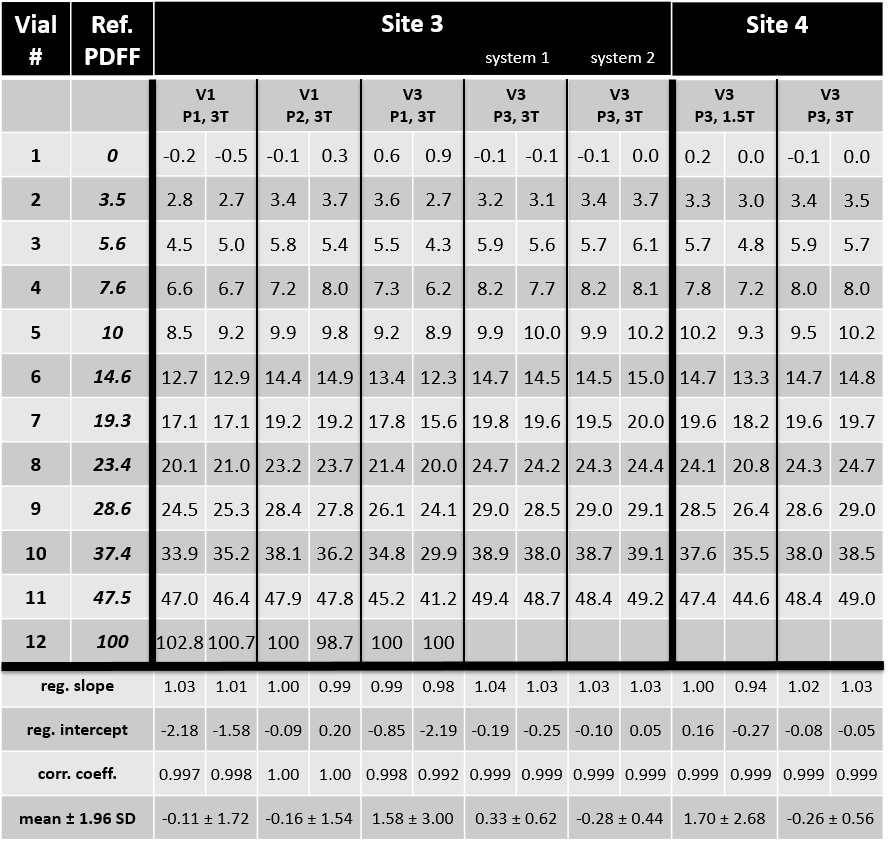
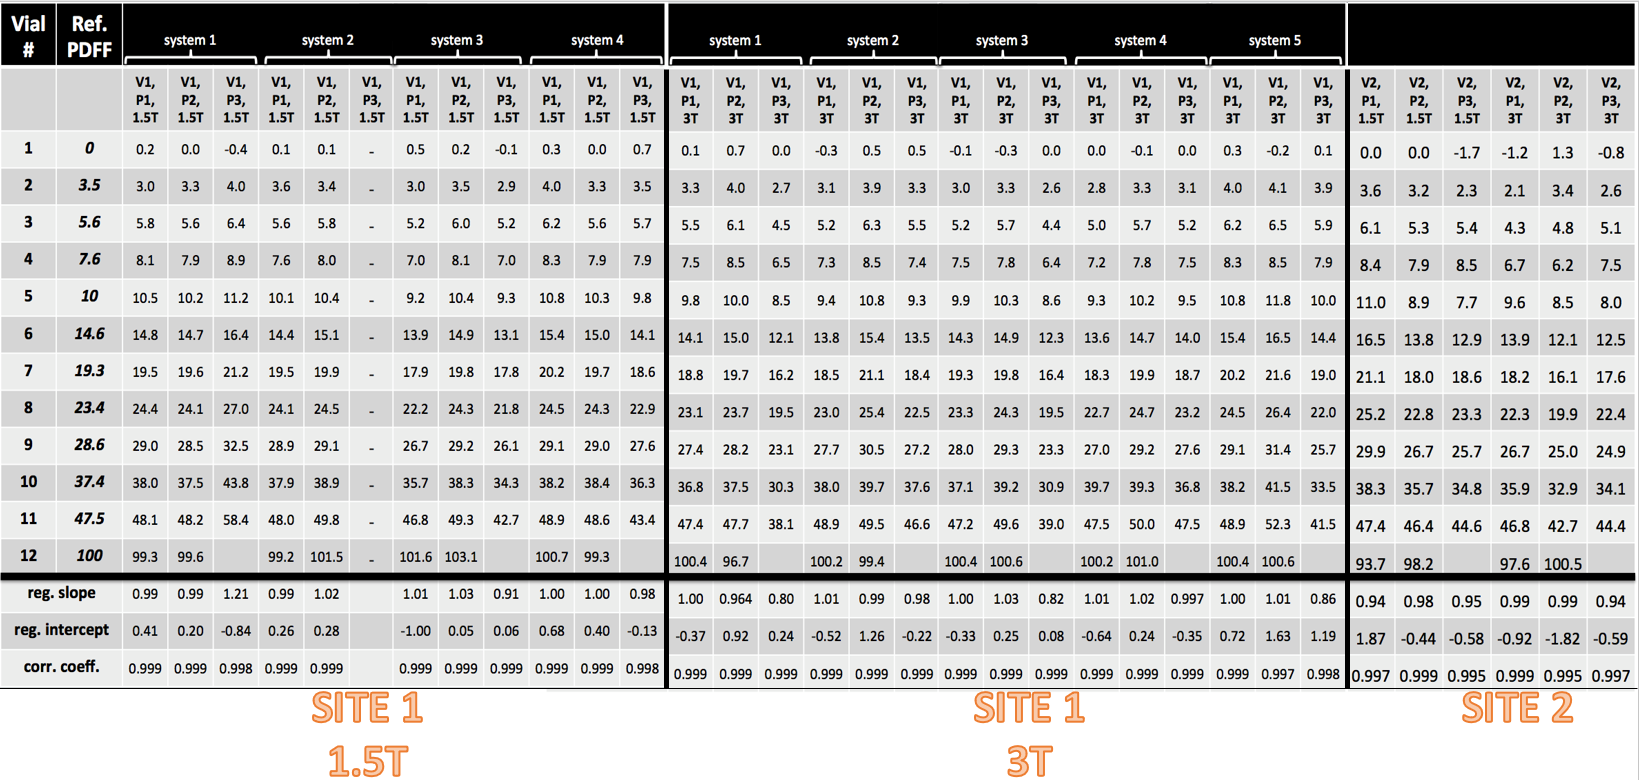
Figure 4 - Summary of data for Site 1 and Site 2. There are four 1.5T systems and five 3T systems at Site 1. LIPO-Quant Protocol #3 data were not acquired on 1.5T system #2. All values are in PDFF % notation and represent the average value from ROI measurements. Reference "ground truth" PDFF values are shown in the second column from the left. Linear regression parameters of each scan with reference values are shown in the last three rows.