1020
Repeatability and Reproducibility of Confounder-Corrected R2* as a Biomarker of Liver Iron Concentration: Interim Results from a Multi-Center, Multi-Vendor Study at 1.5T and 3T1Radiology, University of Wisconsin-Madison, Madison, WI, United States, 2Medical Physics, University of Wisconsin-Madison, Madison, WI, United States, 3Global MR Applications & Workflow, GE Healthcare, Menlo Park, CA, United States, 4Radiology, The Johns Hopkins University, Baltimore, MD, United States, 5Siemens Healthineers, Baltimore, MD, United States, 6Radiology, University of Texas Southwestern Medical Center, Dallas, TX, United States, 7Radiology, Technical University of Munich, Munich, Germany, 8Siemens Healthineers, Los Angeles, CA, United States, 9Medicine, University of Wisconsin-Madison, Madison, WI, United States, 10Radiology, Stanford University, Palo Alto, CA, United States, 11Advanced Imaging Research Center, University of Texas Southwestern Medical Center, Dallas, TX, United States
Synopsis
R2* mapping has the potential to provide rapid and reliable quantification of liver iron concentration. Importantly, previous studies have demonstrated that by correcting for relevant confounding factors (eg: noise floor effects and fat) R2* mapping is highly insensitive to the presence of these confounders. However, the repeatability and reproducibility of confounder-corrected R2* across multiple sites and vendors remains unknown. This abstract reports interim results from a multi-center, prospective, NIH-sponsored liver iron quantification study. Our results suggest excellent repeatability and reproducibility of confounder-corrected R2* for liver iron quantification in patients, across four centers, three vendors and at both 1.5T and 3T.
Introduction
R2* is a promising biomarker of liver iron concentration (LIC), with important applications in the diagnosis and treatment monitoring of liver iron overload1-3. Although R2* measurements may be affected by several confounding factors, including the presence of fat, noise bias, and susceptibility effects3, confounder-corrected R2* mapping has been shown to be highly insensitive to the presence of fat and noise bias4,5. However, the repeatability and reproducibility6,7 of confounder-corrected R2* for liver iron quantification remain unknown. Therefore, the purpose of this work is to determine the repeatability and reproducibility of confounder-corrected R2* for liver iron quantification across multiple sites, vendors, field strength and platforms.Methods
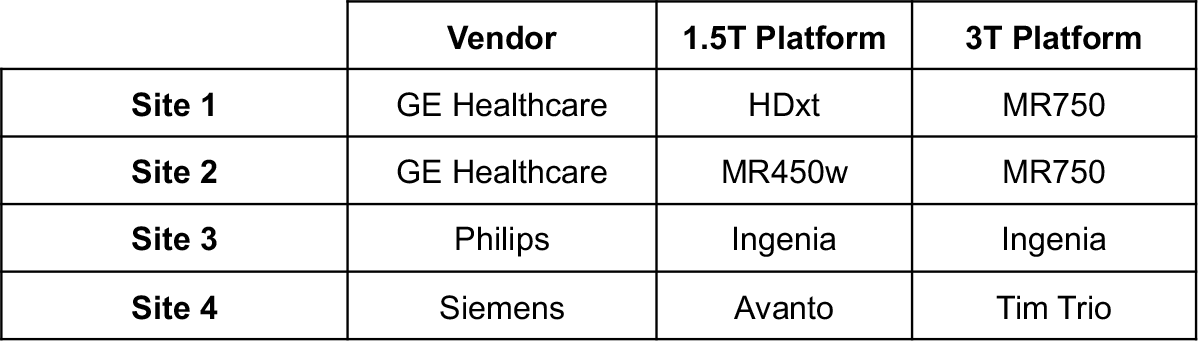
Study description: This HIPAA compliant, IRB-approved, prospective multi-center study includes four sites, three MRI vendors at both 1.5T and 3T (see Table 1). At each site, patients with known or suspected iron overload were recruited after obtaining informed written consent.
MRI acquisition: An FDA-approved single-spin-echo R2-based technique at 1.5T (FerriScan, Resonance Health, Australia) was used at each site to provide a common reference for LIC8. Additionally, multi-echo 3D spoiled gradient-echo (SGRE) data with monopolar readouts were acquired at both 1.5T and 3T for R2* mapping. Parameters included: slice thickness=8mm, flip angle=12° (1.5T)/ 9° (3T), number of echoes=12 (1.5T)/8 (3T), TE1=0.8ms (1.5T)/0.7ms (3T), ΔTE=0.8ms (1.5T)/0.7ms (3T), TR=9.0ms (1.5T)/6.0ms (3T). SGRE data were sent to Site 1 for centralized processing, blinded to the FerriScan results.
In a subset of the patients at sites 1 (GE Healthcare), 3 (Philips), and 4 (Siemens), test-retest repeatability of R2* mapping was assessed by acquiring R2* mapping data twice. Between each acquisition, the subject was withdrawn from the magnet, the top element of the surface coil removed, the subject was asked to sit up and then lie down before replacing the coil, followed by re-landmarking and re-localizing.
R2* measurement: Complex-fitting, fat-corrected R2* mapping was performed from the SGRE data using a centralized algorithm for data from each site and field strength4. In addition, fat-uncorrected R2* mapping was performed in patients with very high R2* (>500 s-1 at 1.5T, >1000 s-1 at 3T) to avoid reconstruction instability3,4. Measurements of liver R2* were performed using a single region of interest (ROI) in the right liver lobe, avoiding large blood vessels and bile ducts.
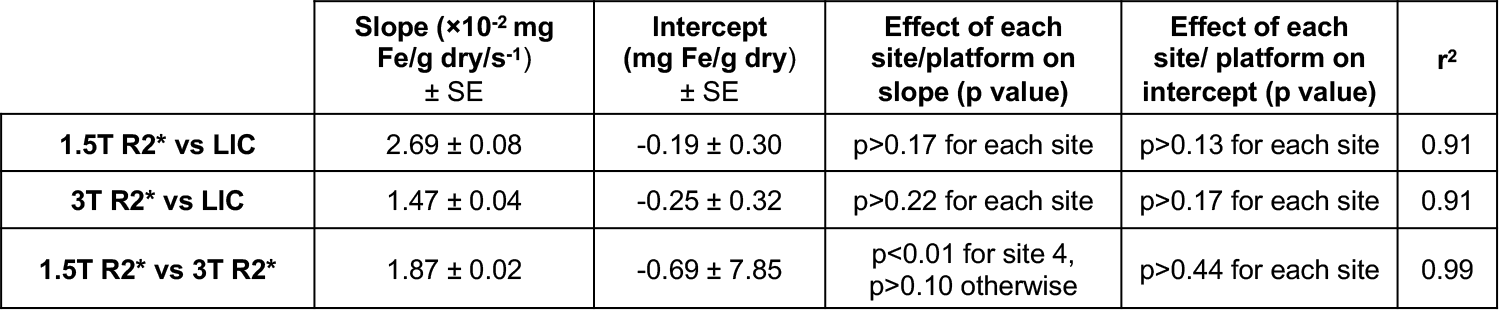
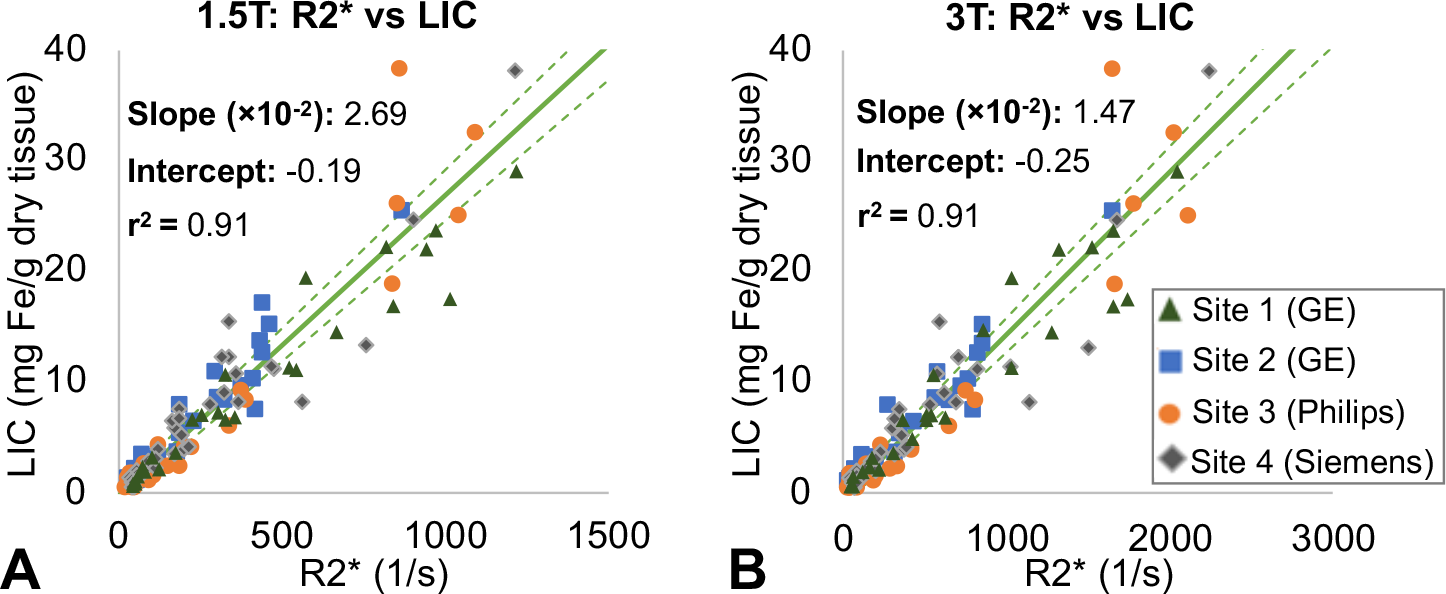
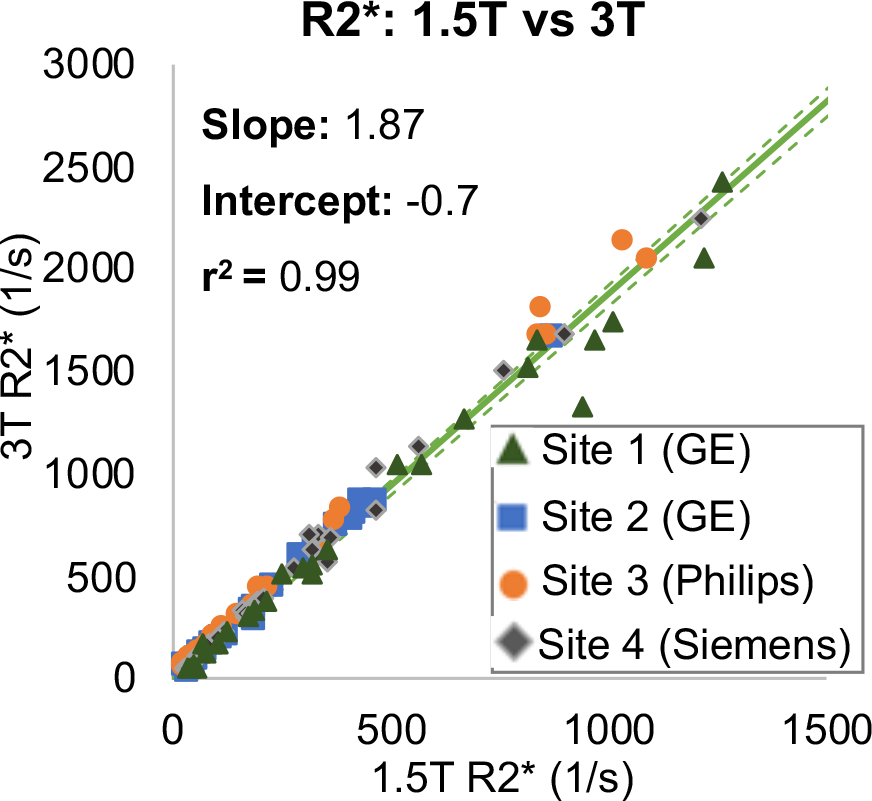
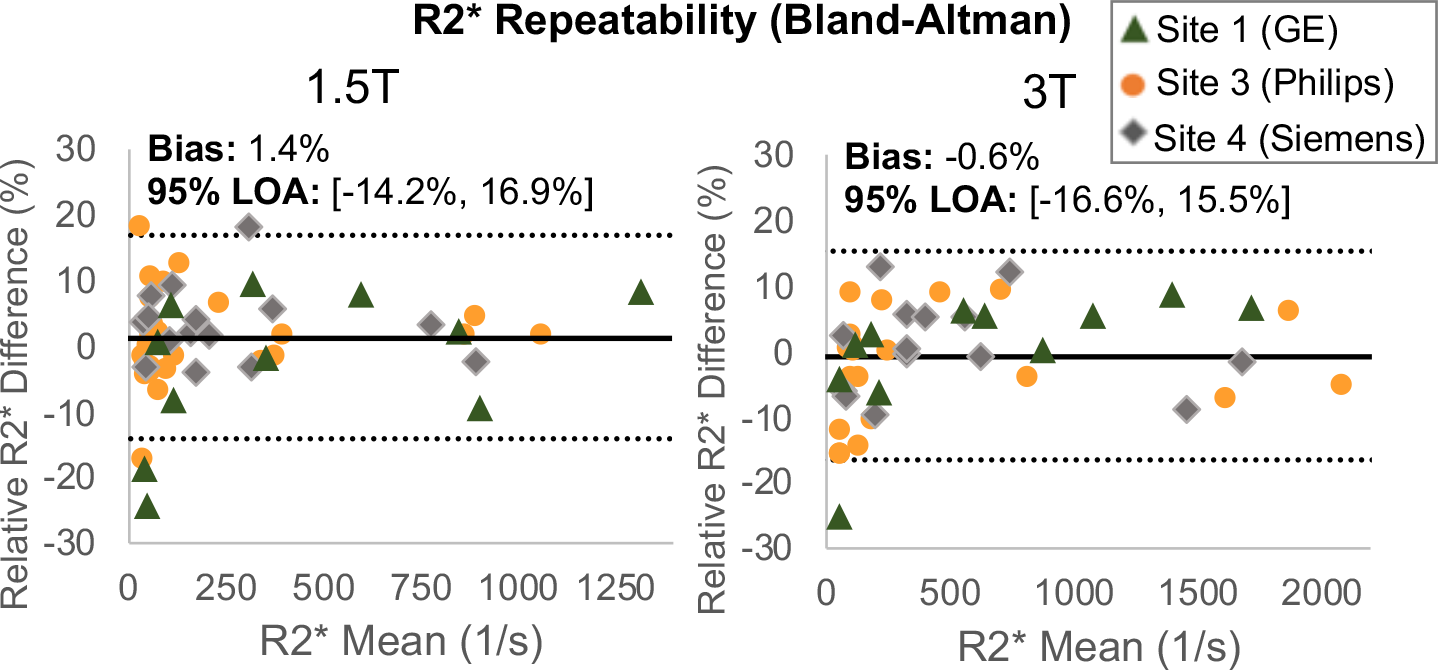
Data analysis: The relationship between liver R2* and FerriScan-LIC was assessed for all of the patients over all four sites using multi-level linear regression with fixed site-effects nested in slope and intercept, to assess the overall calibration as well as the effect of site/platform on the R2*-LIC calibration. This analysis was performed separately for R2* obtained from 1.5T and 3T scans. The field strength dependence of R2* (comparison of R2* at 1.5T versus 3T) was similarly assessed over all sites using a linear regression with fixed site-effects model. Finally, the test-retest repeatability was assessed using Bland-Altman analysis, by assessing the relative R2* difference between repeated acquisitions (as a percentage), versus the mean R2*.
Results
A total of 144 subjects (out of target enrollment of n=200) are included in this interim report (Site 1: 37 patients, 23/14 M/F, 43.4±19.3 years old, Site 2: 33 patients, 18/15 M/F, 19.2±14.4 years old, Site 3: 41 patients, 25/16 M/F, 47.1±14.4 years old, Site 4: 33 patients, 16/17 M/F, 28.5±15.1 years old). Of these, a subset of patients underwent test-retest repeatability acquisitions at both field strengths (Site 1: 15 patients, Site 3: 27 patients, Site 4: 12 patients).
Strong correlation was observed at all sites between R2* and LIC (r2=0.91 at 1.5T, Figure 1A; r2=0.91 at 3T, Figure 1B). At either field strength, no significant effect of individual sites/platforms on the R2* vs. LIC regression slope or intercept was found (p>0.05 for each site, Table 2). Further, high linear correlation was observed between 1.5T R2* and 3T R2* at all sites (r2=0.99, Figure 2). Finally, high test-retest repeatability (Figure 3) was observed across sites and vendors at both 1.5T (95% LOA: [-14.2%,16.9%], Bias: 1.4%) and 3T (95% LOA: [-16.6%,15.5%], Bias -0.6%).Discussion
Interim results from this study suggest excellent repeatability and reproducibility of confounder-corrected R2* for liver iron quantification across four centers, three vendors and at both 1.5T and 3T. In addition, the very high correlation in R2* between 1.5T and 3T provides further indirect evidence of the high precision of R2* as a biomarker of liver iron overload. These results suggest that liver R2* mapping is reliable in a variety of patient populations and scanning platforms, and may have important implications for the widespread applicability of R2* mapping for the detection, staging, and longitudinal treatment monitoring of iron overload.Acknowledgements
The authors wish to acknowledge support from the NIH (UL1TR00427, R01 DK083380, R01 DK088925, R01 DK100651, R01 DK117354, and K24 DK102595). The authors also acknowledge GE Healthcare who provides research support to the University of Wisconsin-Madison and Stanford University, Philips Healthcare who provides research support to the University of Texas-Southwestern, and Siemens Healthcare who provides research support to Johns Hopkins University.References
1. Hankins, J.S., et al., R2* magnetic resonance imaging of the liver in patients with iron overload. Blood, 2009. 113(20): p. 4853-5.
2. Wood, J.C., et al., MRI R2 and R2* mapping accurately estimates hepatic iron concentration in transfusion-dependent thalassemia and sickle cell disease patients. Blood, 2005. 106(4): p. 1460-5.
3. Hernando, D., et al., Quantification of liver iron with MRI: State of the art and remaining challenges. J Magn Reson Imaging, 2014. 40(5): p. 1003-1021.
4. Hernando, D., H.J. Kramer, and S.B. Reeder, Multipeak Fat-Corrected Complex R2* Relaxometry: Theory, Optimization, and Clinical Validation. Magn Reson Med, 2013. 70: p. 1319-1331.
5. Qazi, N., D. Hernando, and S.B. Reeder, Robustness of R2* mapping for liver iron assessment at 1.5T and 3T, in Proceedings of the 21th Annual Meeting of ISMRM. 2013: Salt Lake City, Utah. p. 4204.
6. Wood, J.C., et al., Liver iron concentration measurements by MRI in chronically transfused children with sickle cell anemia: baseline results from the TWiTCH trial. Am J Hematol, 2015. 90(9): p. 806-10.
7. Kirk, P., et al., International reproducibility of single breathhold T2* MR for cardiac and liver iron assessment among five thalassemia centers. J Magn Reson Imaging, 2010. 32(2): p. 315-9.
8. St Pierre, T.G., et al., Noninvasive measurement and imaging of liver iron concentrations using proton magnetic resonance. Blood, 2005. 105(2): p. 855-61.
Figures