1019
Characterization of Prostate Microstructure Using Diffusion-Relaxation Correlation Spectrum Imaging and Comparison to Digital Histopathology1Department of Radiological Sciences, University of California, Los Angeles, Los Angeles, CA, United States, 2Department of Bioengineering, University of California, Los Angeles, Los Angeles, CA, United States, 3Department of Pathology and Laboratory Medicine, University of California, Los Angeles, Los Angeles, CA, United States, 4Department of Urology, University of California, Los Angeles, Los Angeles, CA, United States
Synopsis
Prostate microstructural MRI has the potential to improve prostate cancer (PCa) detection and characterization by resolving the signal signatures of sub-voxel microscopic tissue compartments. Recently, a new model, Diffusion-Relaxation Correlation Spectrum Imaging (DR-CSI), was developed but has not been applied to prostate imaging. In this work, we investigated Prostate DR-CSI and compared DR-CSI features (signal component fractions) to histopathology features (microscopic tissue compartments) derived from digital pathology, to evaluate this new multi-component signal model for prostate microstructure characterization.
Introduction
Prostate microstructural MRI has the potential to improve prostate cancer (PCa) detection and characterization by resolving the signal signatures of sub-voxel microscopic tissue compartments. Several multi-component signal models (including bi-exponential T21-2, bi-exponential diffusion MRI3, VERDICT4) have been proposed for prostate microstructural MRI. Recently, a new model, Diffusion-Relaxation Correlation Spectrum Imaging (DR-CSI), was developed10, but has not been applied to prostate imaging. Compared to most models, DR-CSI has the advantage of not pre-assuming the number of components within the MRI signal. Instead, DR-CSI quantifies a spectrum of T2 and diffusivity components contributing to the overall MRI signal in each voxel.
To validate prostate microstructural MRI, comparison to whole-mount histopathology (WMHP) ground-truth is crucial. However, only limited studies6-9 have evaluated prostate MRI features compared to histopathology features due to the challenges of spatial registration.
In this work, we investigated DR-CSI in prostate specimens from PCa patients to study: 1) how many signal components exist in the prostate DR-CSI signal, 2) how does T2-diffusion spectra differ in PCa versus benign tissues. By utilizing a new system that combines patient-specific prostate molds and ex vivo MRI for spatial registration to WMHP11, we further explored: 3) how do the DR-CSI signal components correspond to the underlying microscopic tissue compartments (e.g., epithelium, stroma and lumen) measured by digital pathology.
Methods
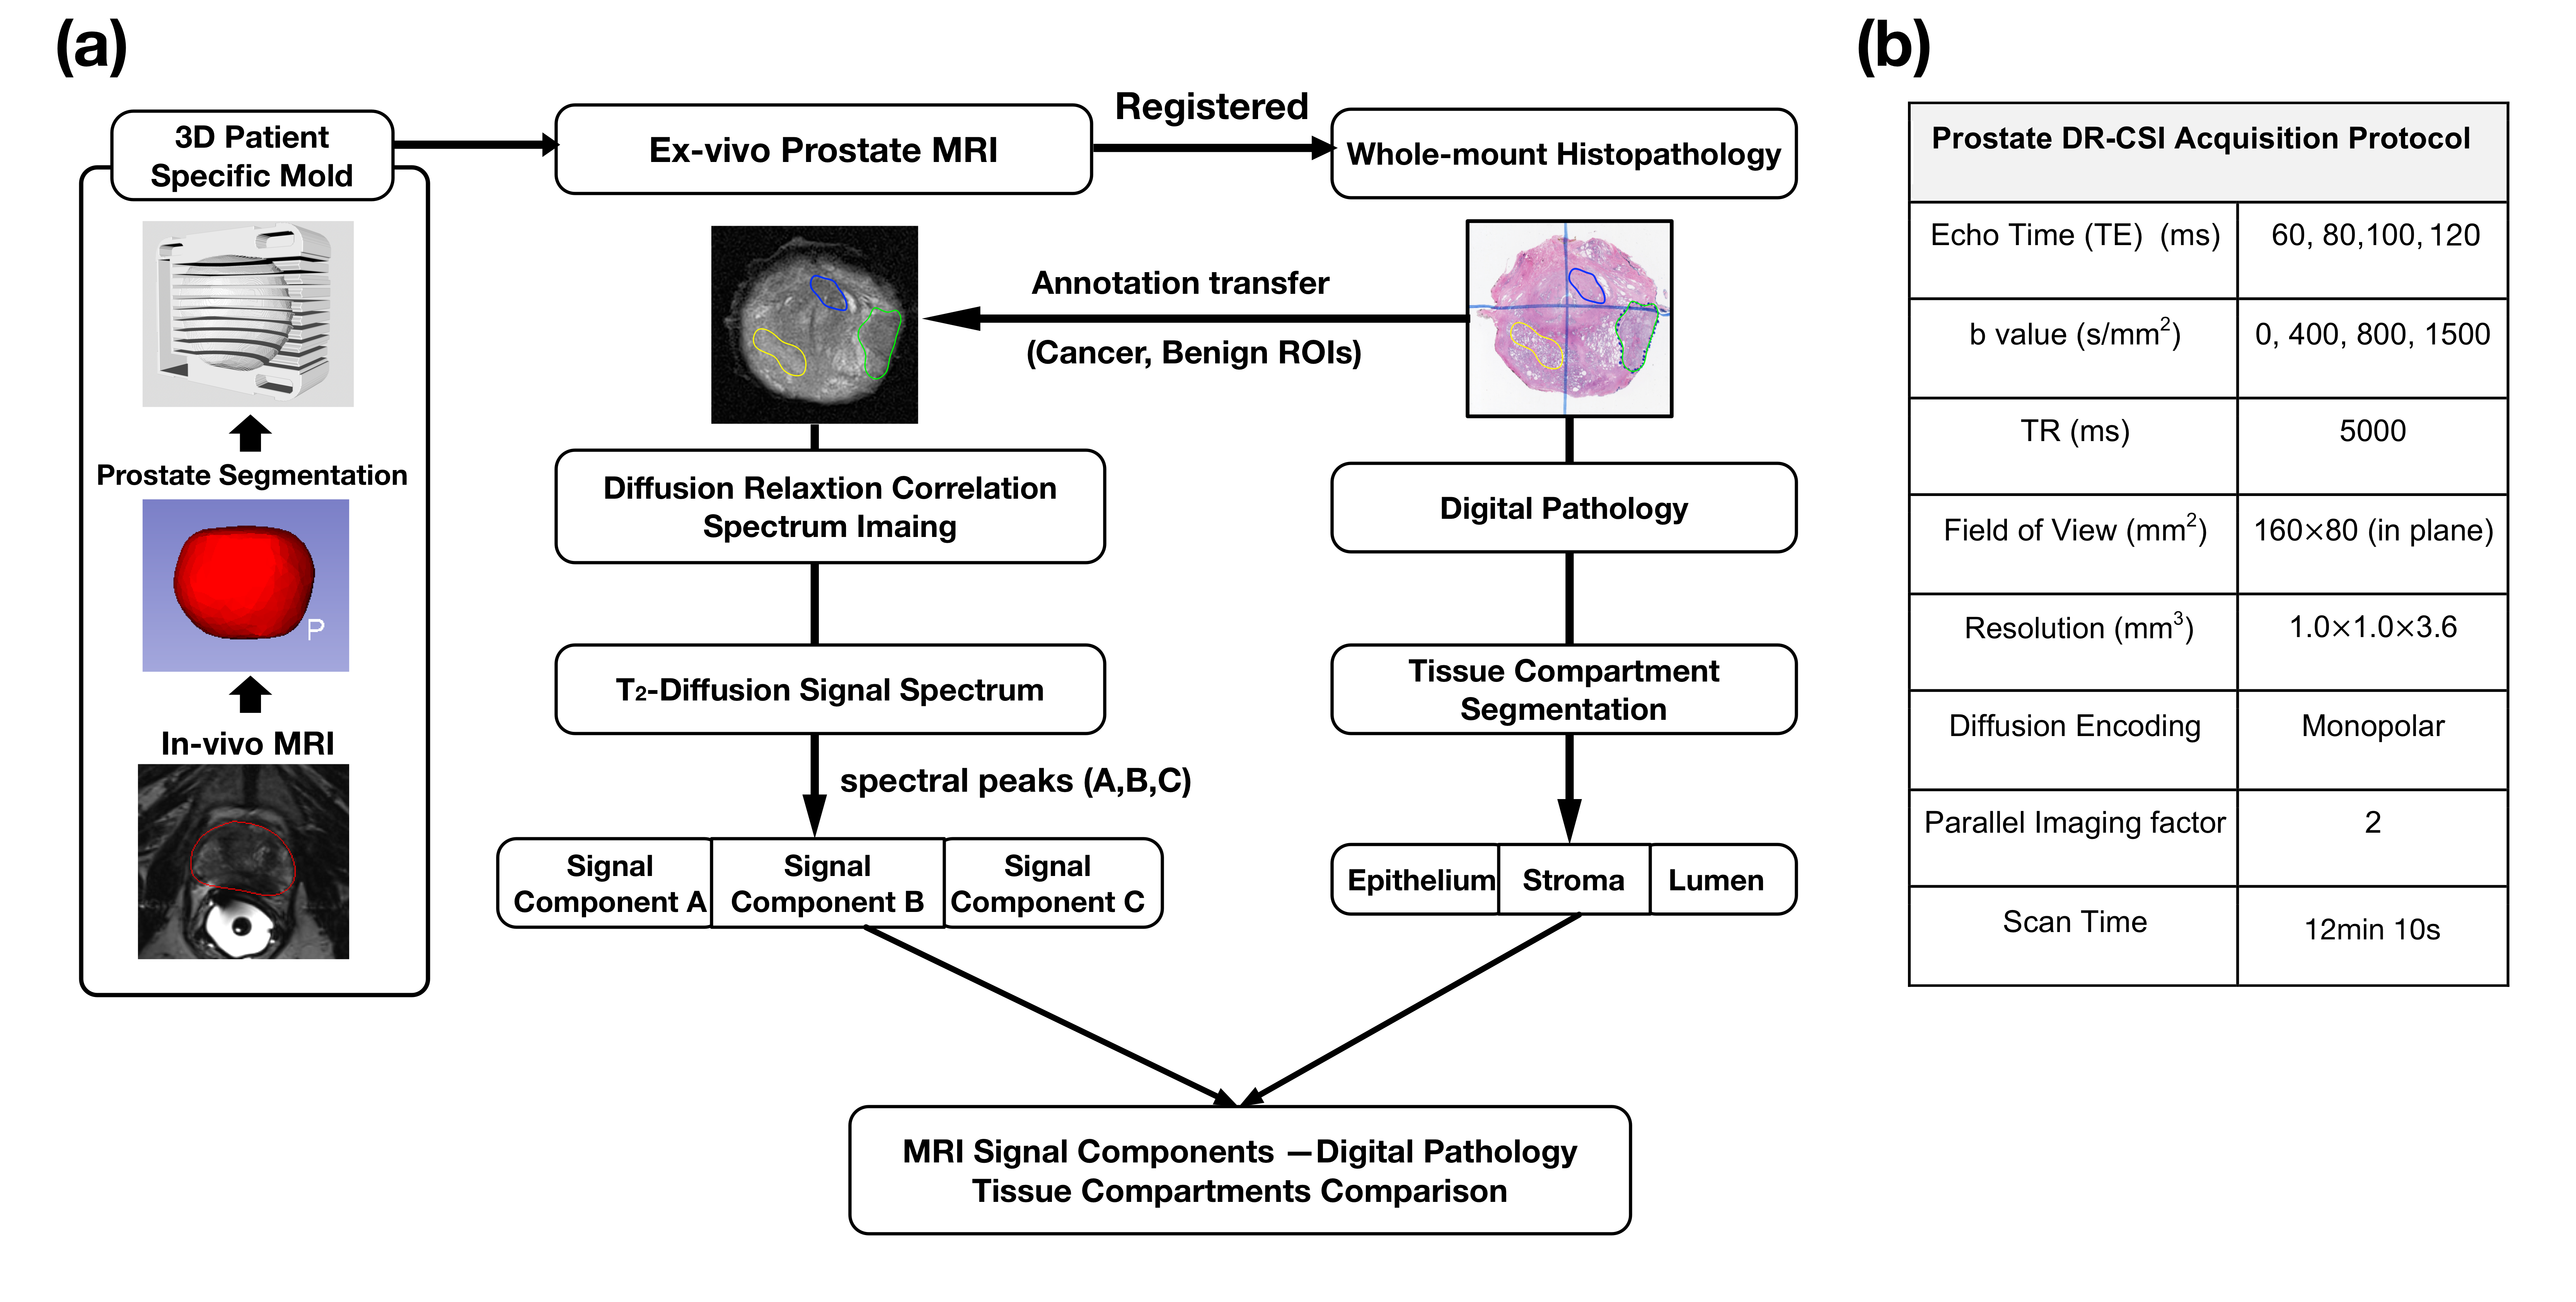
The study design and analysis pipeline are summarized in Fig.1.
Ex-vivo prostate MRI: This study was approved by our IRB and biosafety committee. 3 fresh whole prostate specimens were obtained from PCa patients after prostatectomy and placed in patient-specific 3D prostate molds for ex vivo MRI at 3T11(Fig.1). DR-CSI was acquired and pixel-wise T2-Diffusion spectra were reconstructed using convex optimization with spatial total variation regularization10.
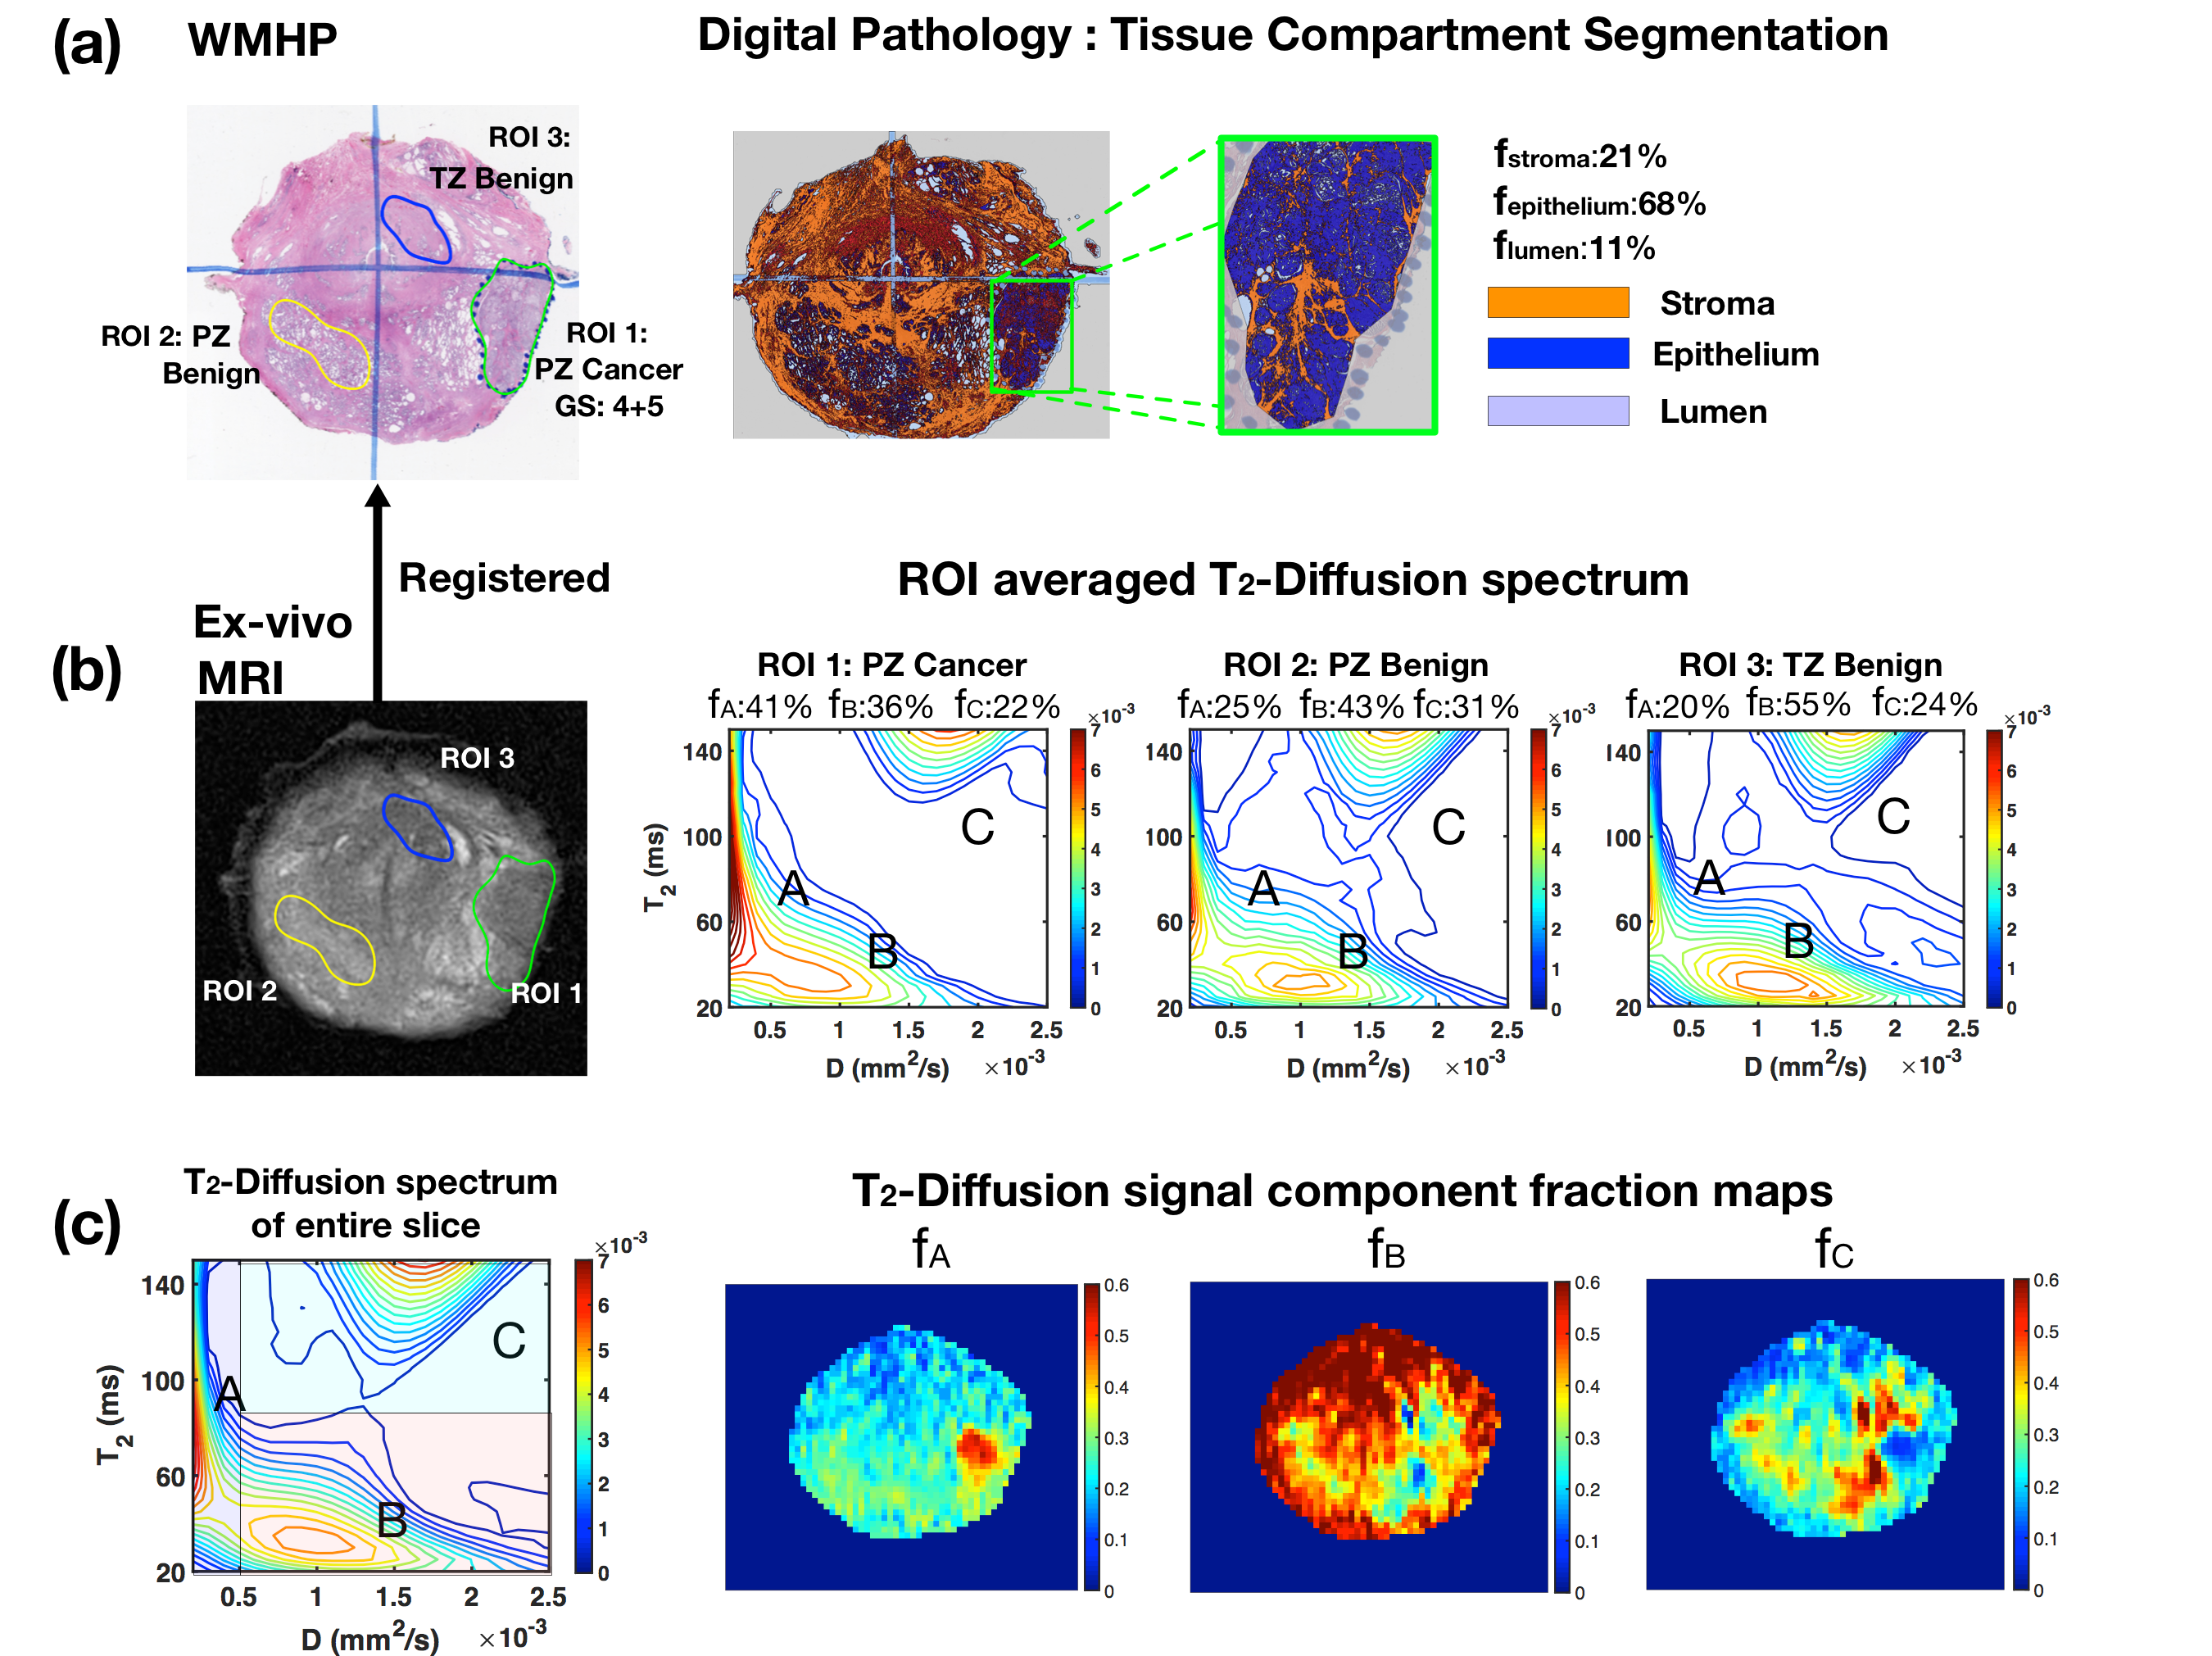
Histopathology Processing and Registration: After imaging, the prostate specimens were sectioned along the mold slits to ensure the sectioned tissue correspond to ex-vivo MRI slices. After tissue fixation and staining, a pathologist reviewed the WMHP slides and annotated each PCa with associated GS. Software (Definiens) was used to segment the high-definition WMHP images into epithelium, stroma and lumen distribution maps. Non-rigid spatial registration between WMHP and corresponding ex-vivo MRI slices were performed to transfer the region of interest (ROI) annotation on WMHP (PCa, benign tissues) into MRI space.
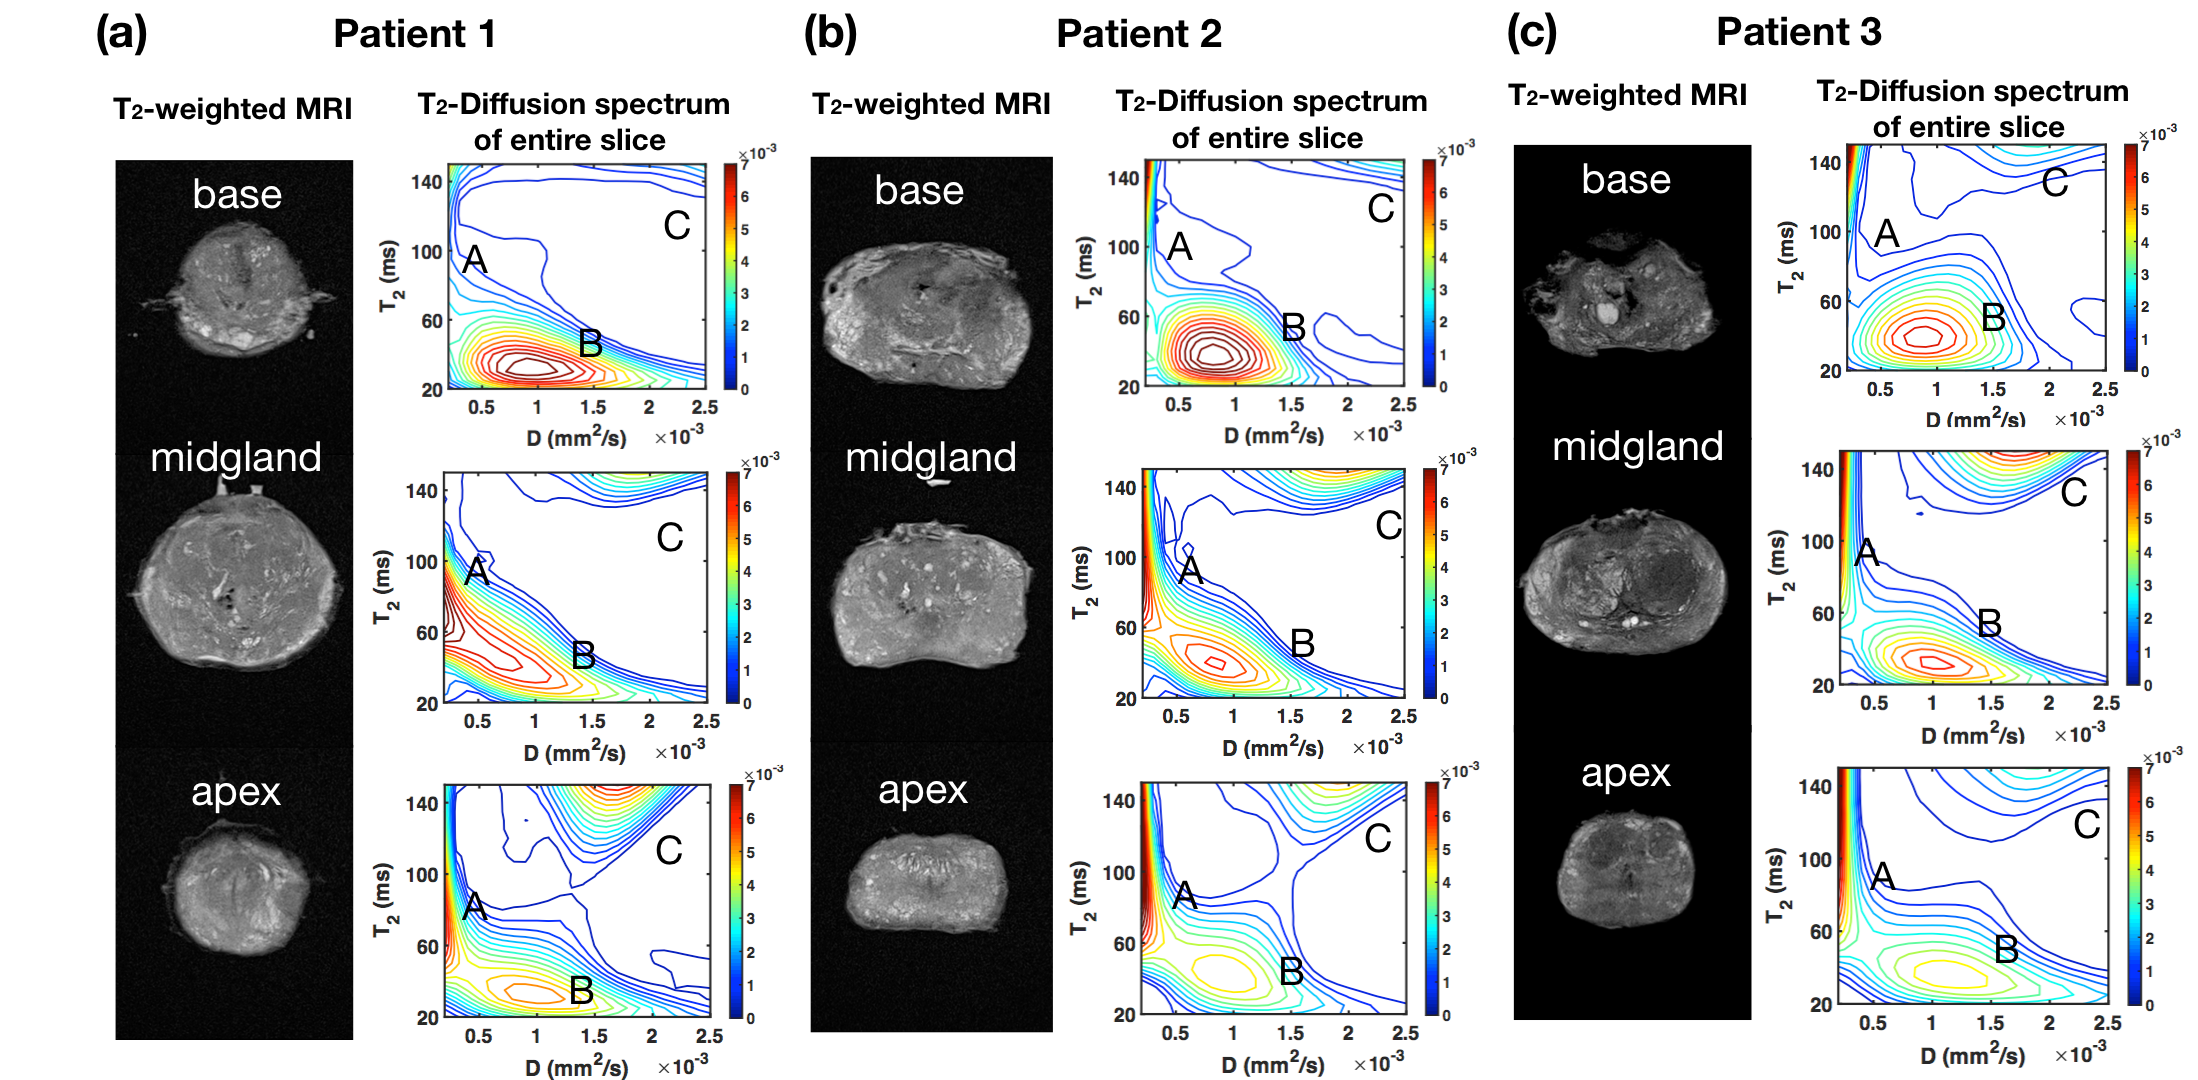
Analysis: To investigate the number of prostate DR-CSI signal components, spatially averaged T2-diffusion spectra from entire prostate slices were compared in 3 prostates, and the number of spectral peaks was counted. To study the DR-CSI signal characteristics in PCa versus benign tissues, we compared the averaged T2-Diffusion spectrum from PCa and benign ROIs in transition zone (TZ) and peripheral zone (PZ) from WMHP. 19 ROIs from 3 prostates were studied. Spearman’s correlation analysis were performed to study the relationship between DR-CSI signal component fractions (fA,fB,fC) and microscopic tissue compartment fractions (fepithelium, fstroma, flumen) in 19 ROIs (P<0.05 considered significant). Signal component fraction maps were generated by integrating individual spectral peaks from the normalized T2-Diffusion spectrum at each pixel.
Results
Across prostate specimens, from T2-Diffusion spectra (Fig. 2), at least 3 distinct components (spectral peaks A, B and C) can be identified.
Digital pathology analysis showed PZ PCa have substantial increase of epithelium and decrease of stroma and lumen (Fig.3a).
DR-CSI T2-Diffusion spectrum showed relative increase of peak A (fA) and decrease of peak B (fB) and peak C (fC) in PZ PCa compared to benign PZ (Fig.3b,c).
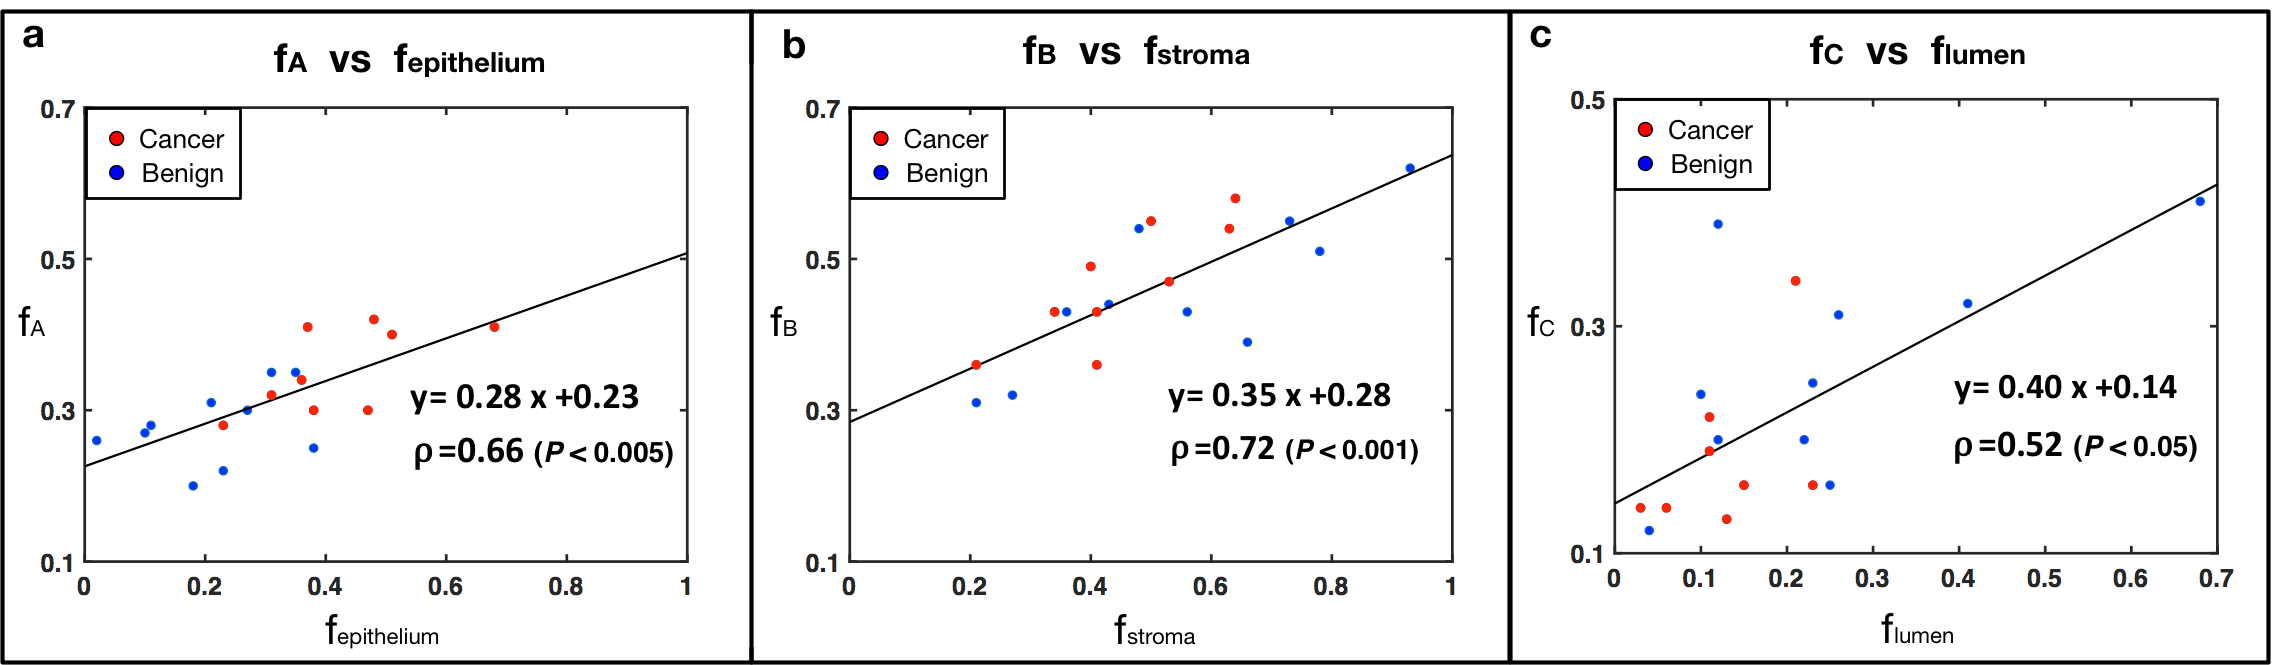
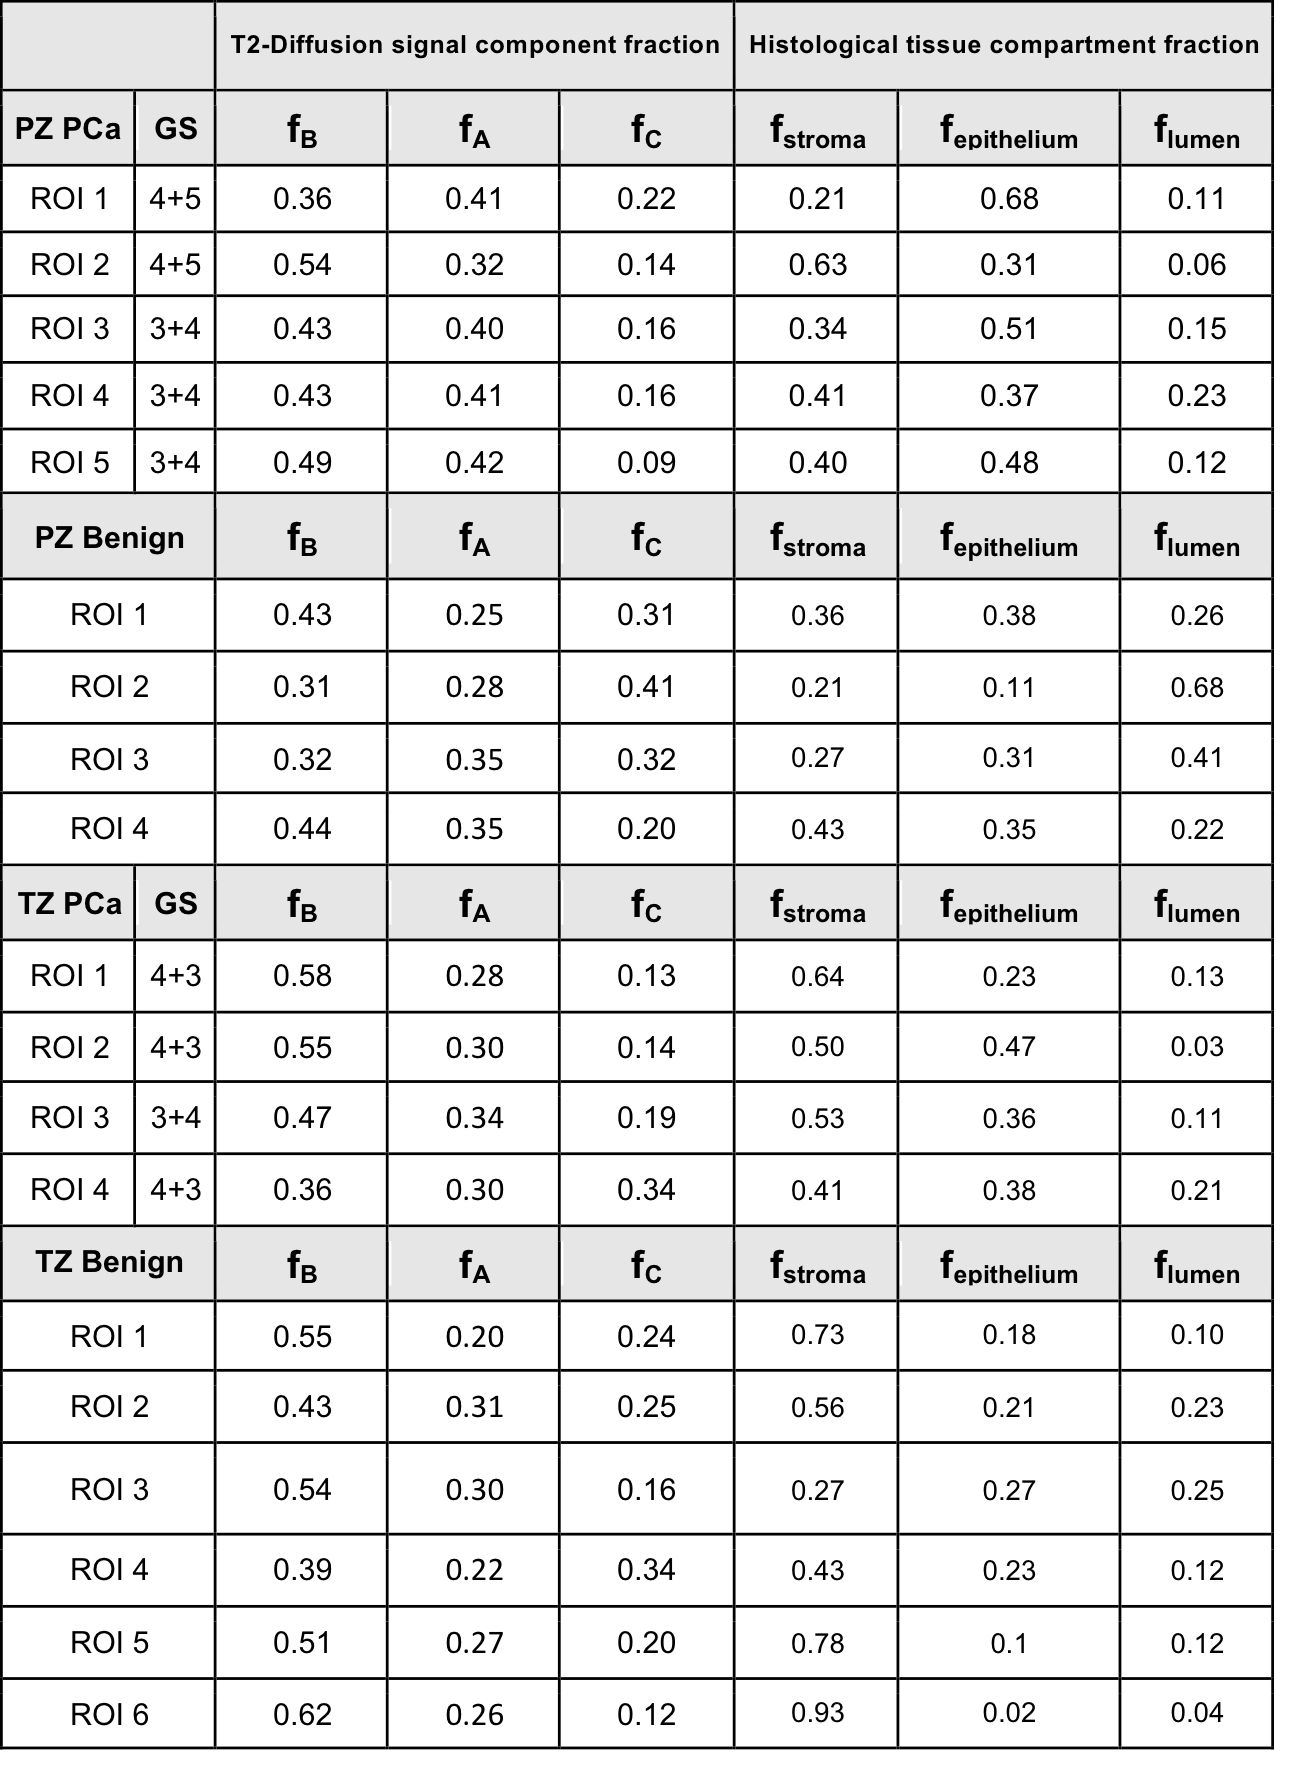
T2-diffusion signal component fractions (fA, fB, fC) were significantly correlated with tissue microscopic compartment fractions (fepithelium, fstroma, flumen) respectively (Table 1 and Fig. 4).
Discussion
Using DR-CSI in 3 ex-vivo prostate specimens, we observed 3 distinct sub-voxel MRI signal components (A, B and C). Different types of prostate tissues exhibited distinct T2-Diffusion spectral characteristics. PCa showed substantial increase of signal component A and decrease of signal component C compared to benign tissues, while digital pathology showed substantial increase of epithelium and decrease of lumen and stroma in PCa. From comparison between prostate DR-CSI features (signal component fraction: fA, fB, fC ) with digital histopathology using patient-specific molds and registration, we found significant correlation between fA and fepithelium, fB and fstroma, fC and flumen, indicating the 3 distinct DR-CSI signal components could have correspondence to microscopic tissue compartments. Future work would focus on including more ex vivo and in vivo data and improving the spectral resolution of prostate DR-CSI through protocol optimization.Conclusion
We successfully implemented DR-CSI to study prostate specimens and found 3 distinct signal components. Preliminary evaluation found these signal components to have correspondence to microscopic tissue compartments. Prostate DR-CSI has potential to provide unique microstructure information to characterize prostate microstructure and prostate cancer.Acknowledgements
This work was supported in part by funds from the integrated Diagnostics Program, Department of Radiological Sciences and Pathology, David Geffen School of Medicine at UCLA.References
[1]. Storas TH, Gjesdal KI, Gadmar OB, Geitung JT, Klow NE. Prostate magnetic resonance imaging: multiexponential T2 decay in prostate tissue. Journal of magnetic resonance imaging : JMRI. 2008;28(5):1166- 72. Epub 2008/10/31. doi: 10.1002/jmri.21534. PubMed PMID: 18972358.
[2] Sabouri S, Chang SD, Savdie R, Zhang J, Jones EC, Goldenberg SL, Black PC, Kozlowski P. Luminal Water Imaging: A New MR Imaging T2 Mapping Technique for Prostate Cancer Diagnosis. Radiology. 2017;284(2):451-9. Epub 2017/04/11. doi: 10.1148/radiol.2017161687. PubMed PMID: 28394754; PMCID: PMC5522021.
[3] Jambor, I. , Merisaari, H. , Aronen, H. J., Järvinen, J. , Saunavaara, J. , Kauko, T. , Borra, R. and Pesola, M. (2014), Optimization of b‐value distribution for biexponential diffusion‐weighted MR imaging of normal prostate. J. Magn. Reson. Imaging, 39: 1213-1222. doi:10.1002/jmri.24271
[4] Panagiotaki E, Chan RW, Dikaios N, Ahmed HU, Urol F, Callaghan JO, Freeman A, Atkinson D, Punwani S, Hawkes DJ, Alexander DC. Microstructural Characterization of Normal and Malignant Human Prostate Tissue With Vascular , Extracellular , and Restricted Diffusion for Cytometry in Tumours Magnetic Resonance Imaging. Investigative radiology. 2015;50(4):218-27. Epub 2014/11/27. doi: 10.1097/RLI.0000000000000115. PubMed PMID: 25426656.
[5] Chatterjee A, Bourne RM, Wang S, Devaraj A, Gallan AJ, Antic T, Karczmar GS, Oto A. Diagnosis of Prostate Cancer with Noninvasive Estimation of Prostate Tissue Composition by Using Hybrid Multidimensional MR Imaging: A Feasibility Study. Radiology. 2018;287(3):864-73. Epub 2018/02/03. doi: 10.1148/radiol.2018171130. PubMed PMID: 29393821; PMCID: PMC5978456.
[6] Sabouri S, Fazli L, Chang SD, Savdie R, Jones EC, Goldenberg SL, Black PC, Kozlowski P. MR measurement of luminal water in prostate gland: Quantitative correlation between MRI and histology. Journal of magnetic resonance imaging : JMRI. 2017;46(3):861-9. Epub 2017/01/29. doi: 10.1002/jmri.25624. PubMed PMID: 28130866; PMCID: PMC5557632.
[7] Kwak JT, Sankineni S, Xu S, Turkbey B, Choyke PL, Pinto PA, Moreno V, Merino M, Wood BJ. Prostate Cancer: A Correlative Study of Multiparametric MR Imaging and Digital Histopathology. Radiology. 2017;285(1):147-56. Epub 2017/06/06. doi: 10.1148/radiol.2017160906. PubMed PMID: 28582632; PMCID: PMC5621723.
[8] Chatterjee A, Watson G, Myint E, Sved P, McEntee M, Bourne R. Changes in Epithelium, Stroma, and Lumen Space Correlate More Strongly with Gleason Pattern and Are Stronger Predictors of Prostate ADC Changes than Cellularity Metrics. Radiology. 2015;277(3):751-62. Epub 2015/06/26. doi: 10.1148/radiol.2015142414. PubMed PMID: 26110669.
[9] Langer DL, van der Kwast TH, Evans AJ, Plotkin A, Trachtenberg J, Wilson BC, Haider MA. Prostate tissue composition and MR measurements: investigating the relationships between ADC, T2, K(trans), v(e), and corresponding histologic features. Radiology. 2010;255(2):485-94. Epub 2010/04/24. doi: 10.1148/radiol.10091343. PubMed PMID: 20413761.
[10] Kim, D., Doyle, E. K., Wisnowski, J. L., Kim, J. H. and Haldar, J. P. (2017), Diffusion‐relaxation correlation spectroscopic imaging: A multidimensional approach for probing microstructure. Magn. Reson. Med., 78: 2236-2249. doi:10.1002/mrm.26629
[11] Wu HH, Priester A, Khoshnoodi P, Zhang Z, Shakeri S, Afshari Mirak S, Asvadi NH, Ahuja P, Sung K, Natarajan S, Sisk A, Reiter R, Raman S, Enzmann D. A system using patient-specific 3D-printed molds to spatially align in vivo MRI with ex vivo MRI and whole-mount histopathology for prostate cancer research. Journal of magnetic resonance imaging : JMRI. 2018. Epub 2018/08/03. doi: 10.1002/jmri.26189. PubMed PMID: 30069968.
Figures