1017
Mapping tumour response to radiotherapy using diffusion model comparison1Quantitative Biomedical Imaging Laboratory, Faculty of Biology, Medicine and Health, The University of Manchester, Manchester, United Kingdom, 2Division of Cancer Sciences, The University of Manchester, Manchester, United Kingdom, 3Division of Pharmacy & Optometry, The University of Manchester, Manchester, United Kingdom, 4Division of Cardiovascular Sciences, The University of Manchester, Manchester, United Kingdom, 5Bioxydyn Ltd., Manchester, United Kingdom
Synopsis
This work evaluates how the suitability of two diffusion MRI models varies spatially within tumours at the voxel level and in response to radiotherapy, potentially allowing inference of qualitatively different tumour microenvironments. Models of restricted and free diffusion were compared, with regions well-described by the former hypothesised to reflect cellular tissue, and those well-described by the latter expected to reflect necrosis or oedema. Results suggest spatial and radiotherapy-related variation in the models’ suitability for describing diffusion in tumours, with a post-therapy decrease in the proportion of tissue characterised by restricted diffusion. Within restricted diffusion regions, microstructural parameters were sensitive to radiotherapy-induced changes.
Introduction
Quantitative MR biomarkers1 of tumour response to treatment are often obtained by calculating changes in parameters derived from a model that is applied to pre- and post-treatment data. However, as tumour tissue is heterogeneous to varying extents that can change during treatment, different models may be applicable in different regions, and model suitability may change over time. Previously, model comparison has been used to show that microstructural models describe whole-tumour diffusion-weighted (DW) MRI data better than ADC or IVIM2, and that non-monoexponential representations tend to be preferred over ADC before and after treatment3. This work evaluates how the suitability of two DW-MRI models varies spatially within tumours at the voxel level and in response to radiotherapy, potentially allowing inference of qualitatively different tumour microenvironments. In a syngeneic mouse model of colorectal cancer, restricted and free diffusion models were compared, with regions well-described by the former hypothesised to reflect cellular tissue, and those well-described by the latter expected to reflect necrotic, cystic, or oedematous regions.Methods
Tumour implantation and treatment: Animal experiments were approved by a local ethical committee and performed under a United Kingdom Home Office license. BALB/c mice were inoculated subcutaneously with 1x10⁵ CT26 murine colon carcinoma cells in the supraspinal position. Mice received either sham therapy (control; N=10) or 10 Gy radiotherapy (RT; N=9).
Acquisition: Scans were performed on a 7 T Bruker (Bruker BioSpin, Ettlingen, Germany), pre-treatment/sham and at up to three post-treatment points (days 3, 6, and 10). PGSE data were acquired with G = 0, 113, 207, 293 mT/m, ∂ = 4.65 ms, ∆ = 9.86, 40.0 ms, TE = 50 ms, TR = 2550 ms, and 0.5 x 0.5 x 0.6 mm3 resolution.
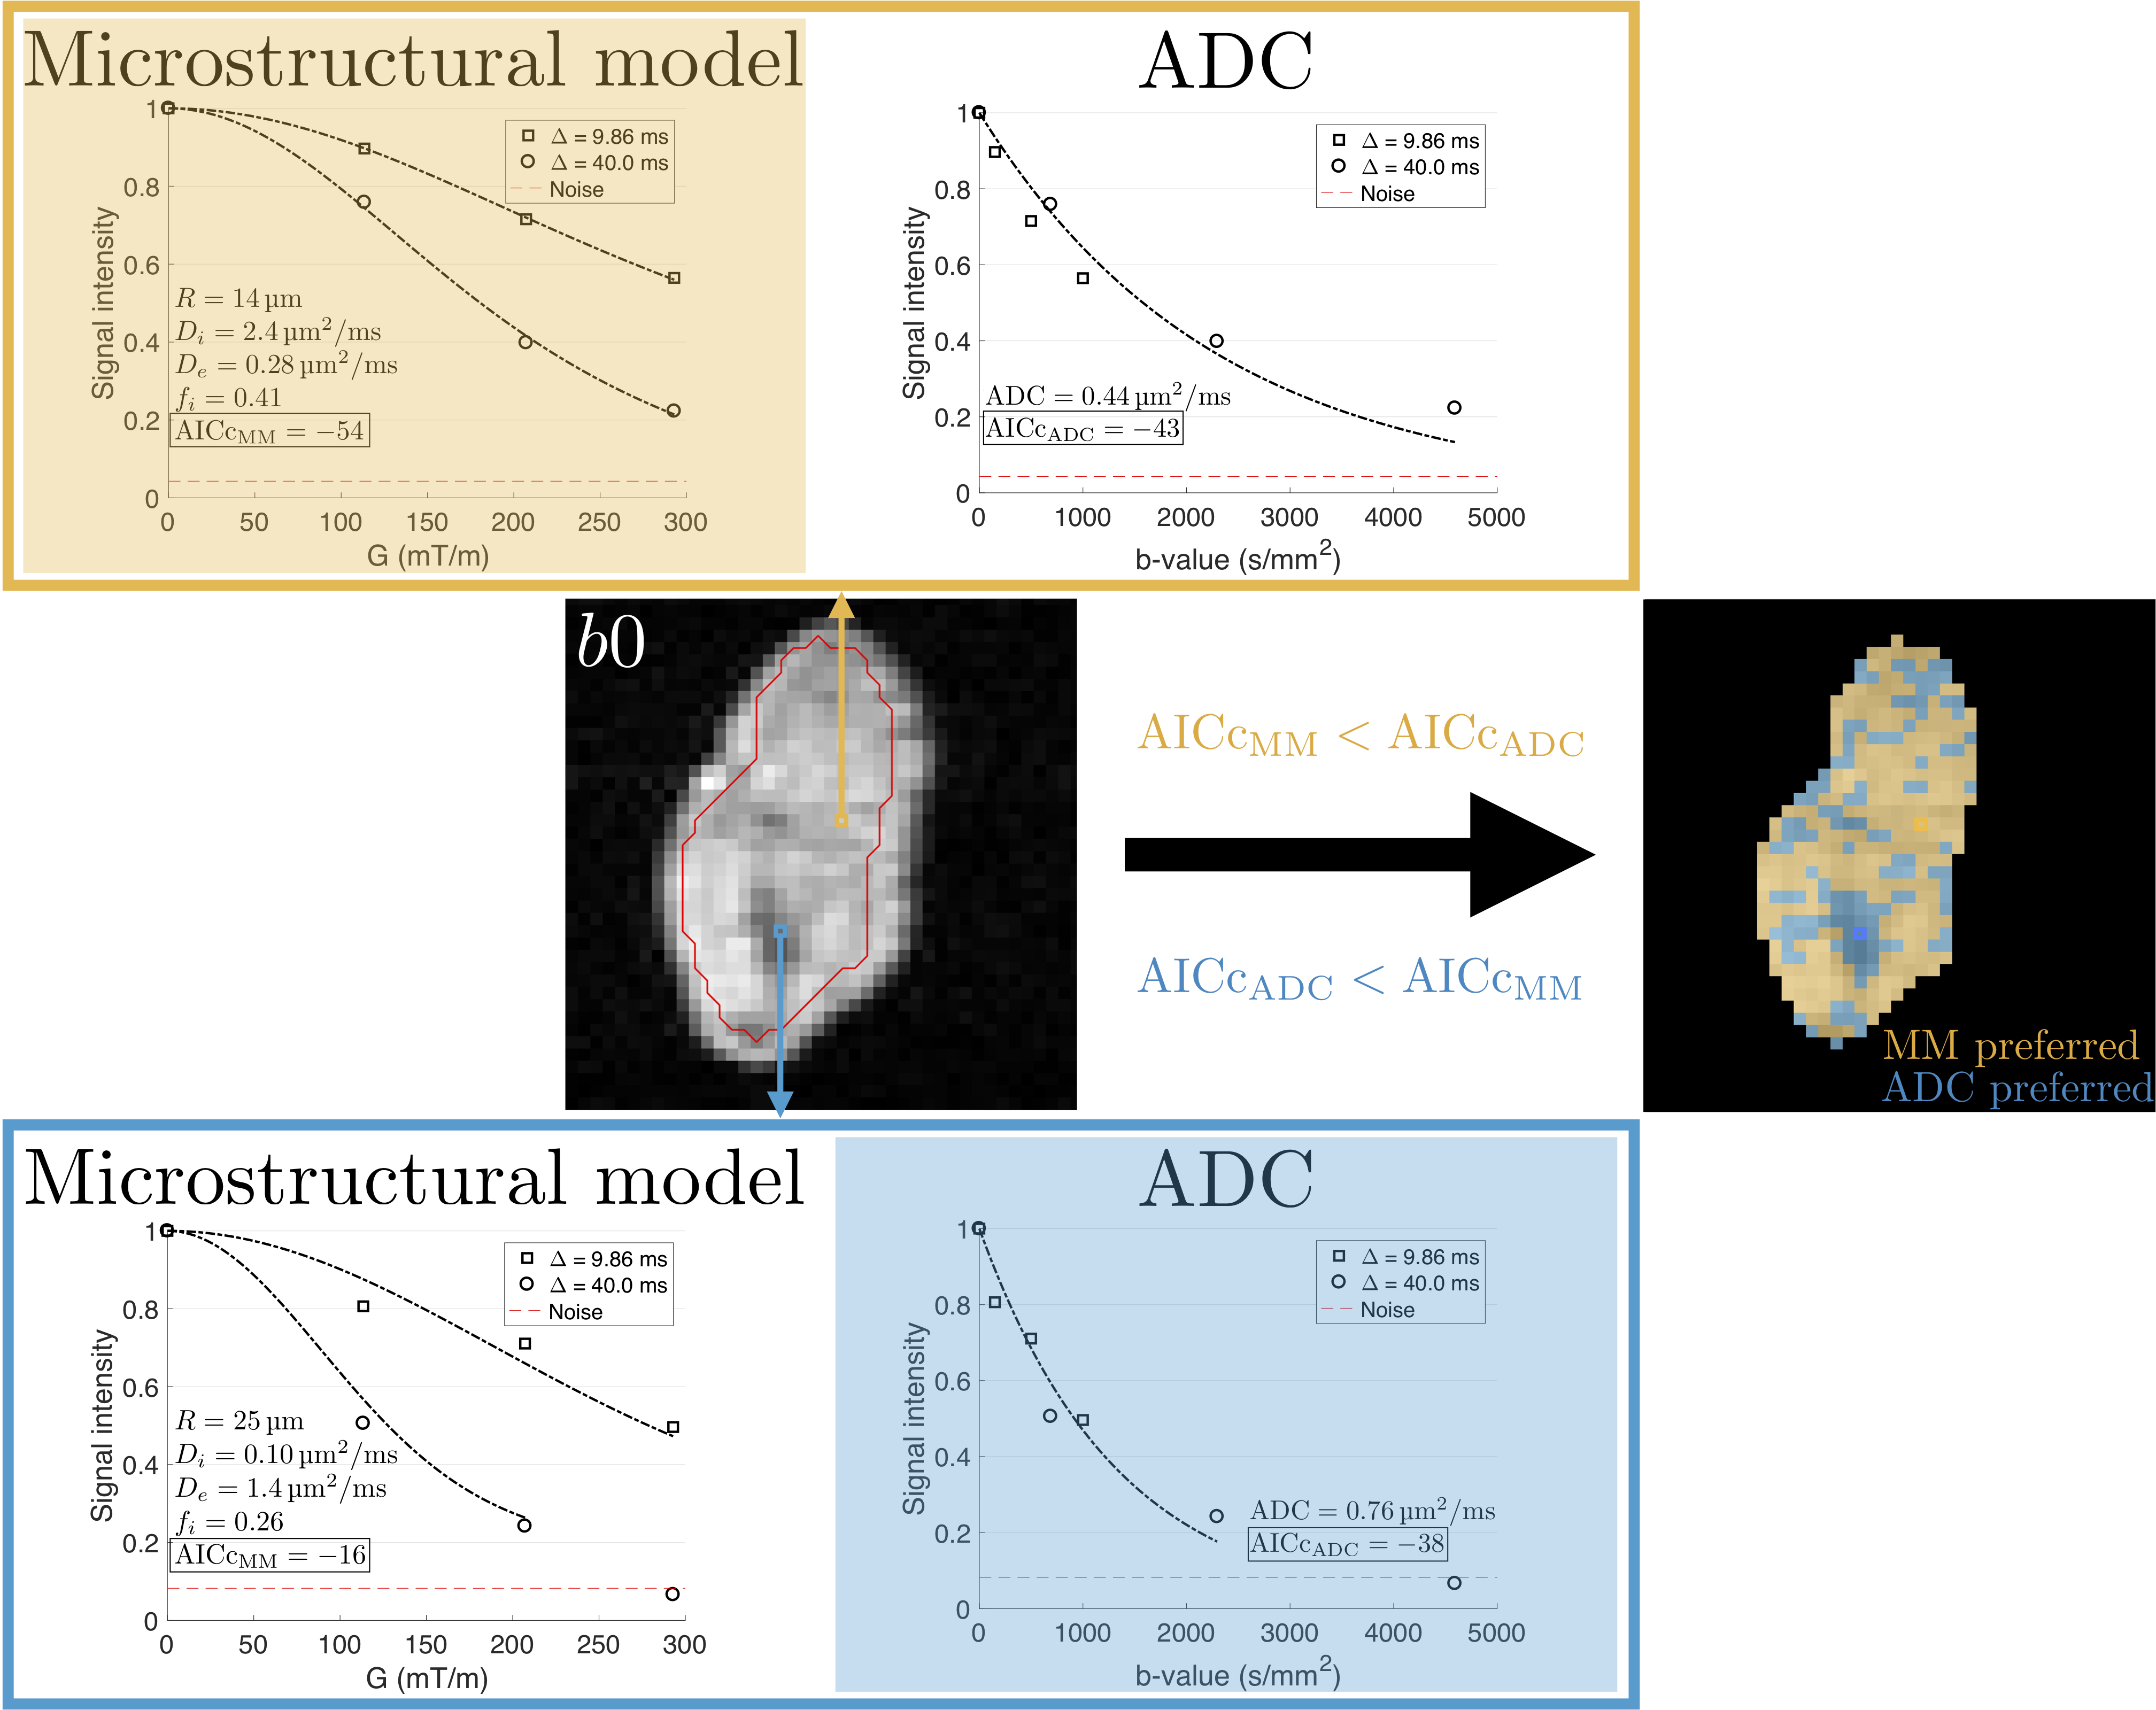
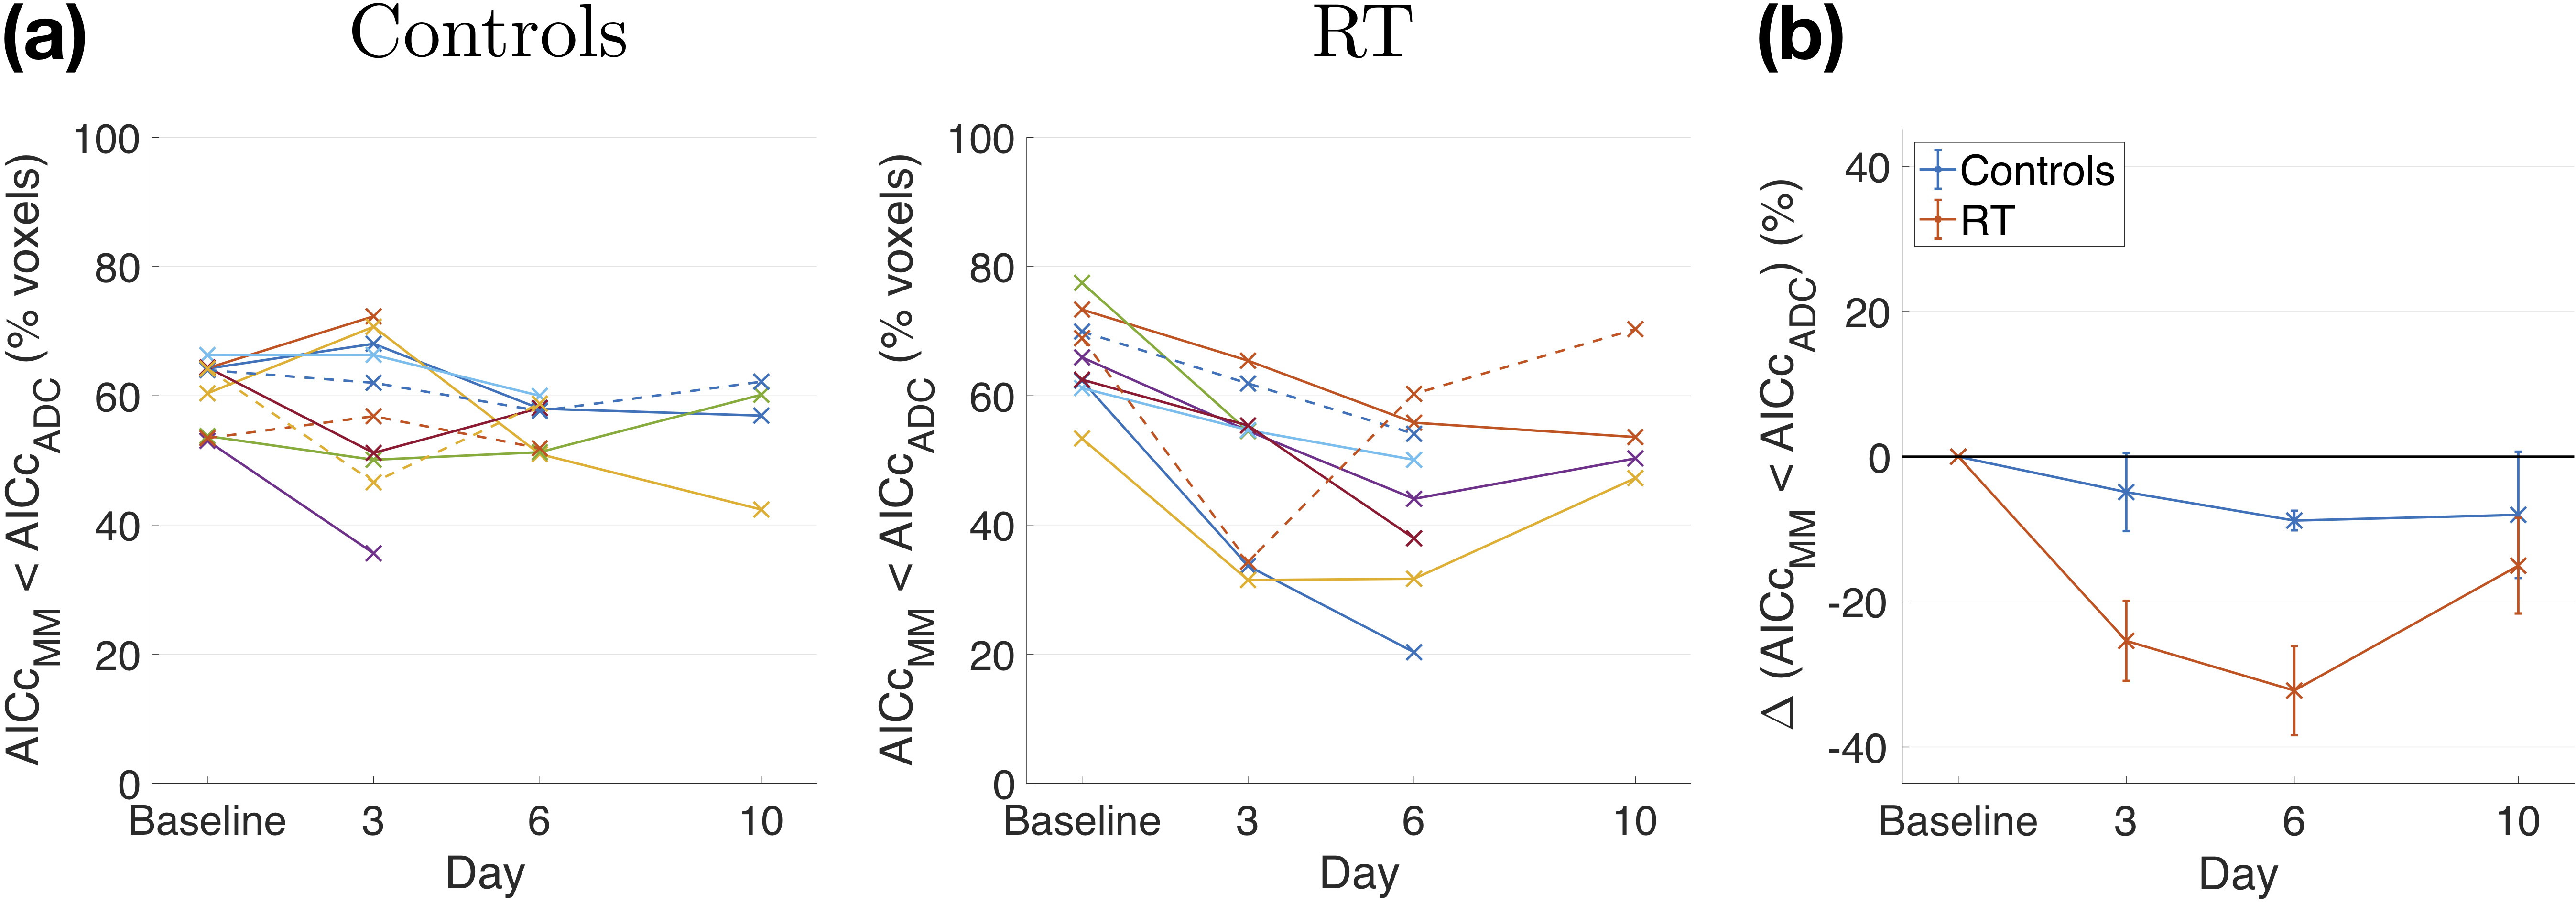
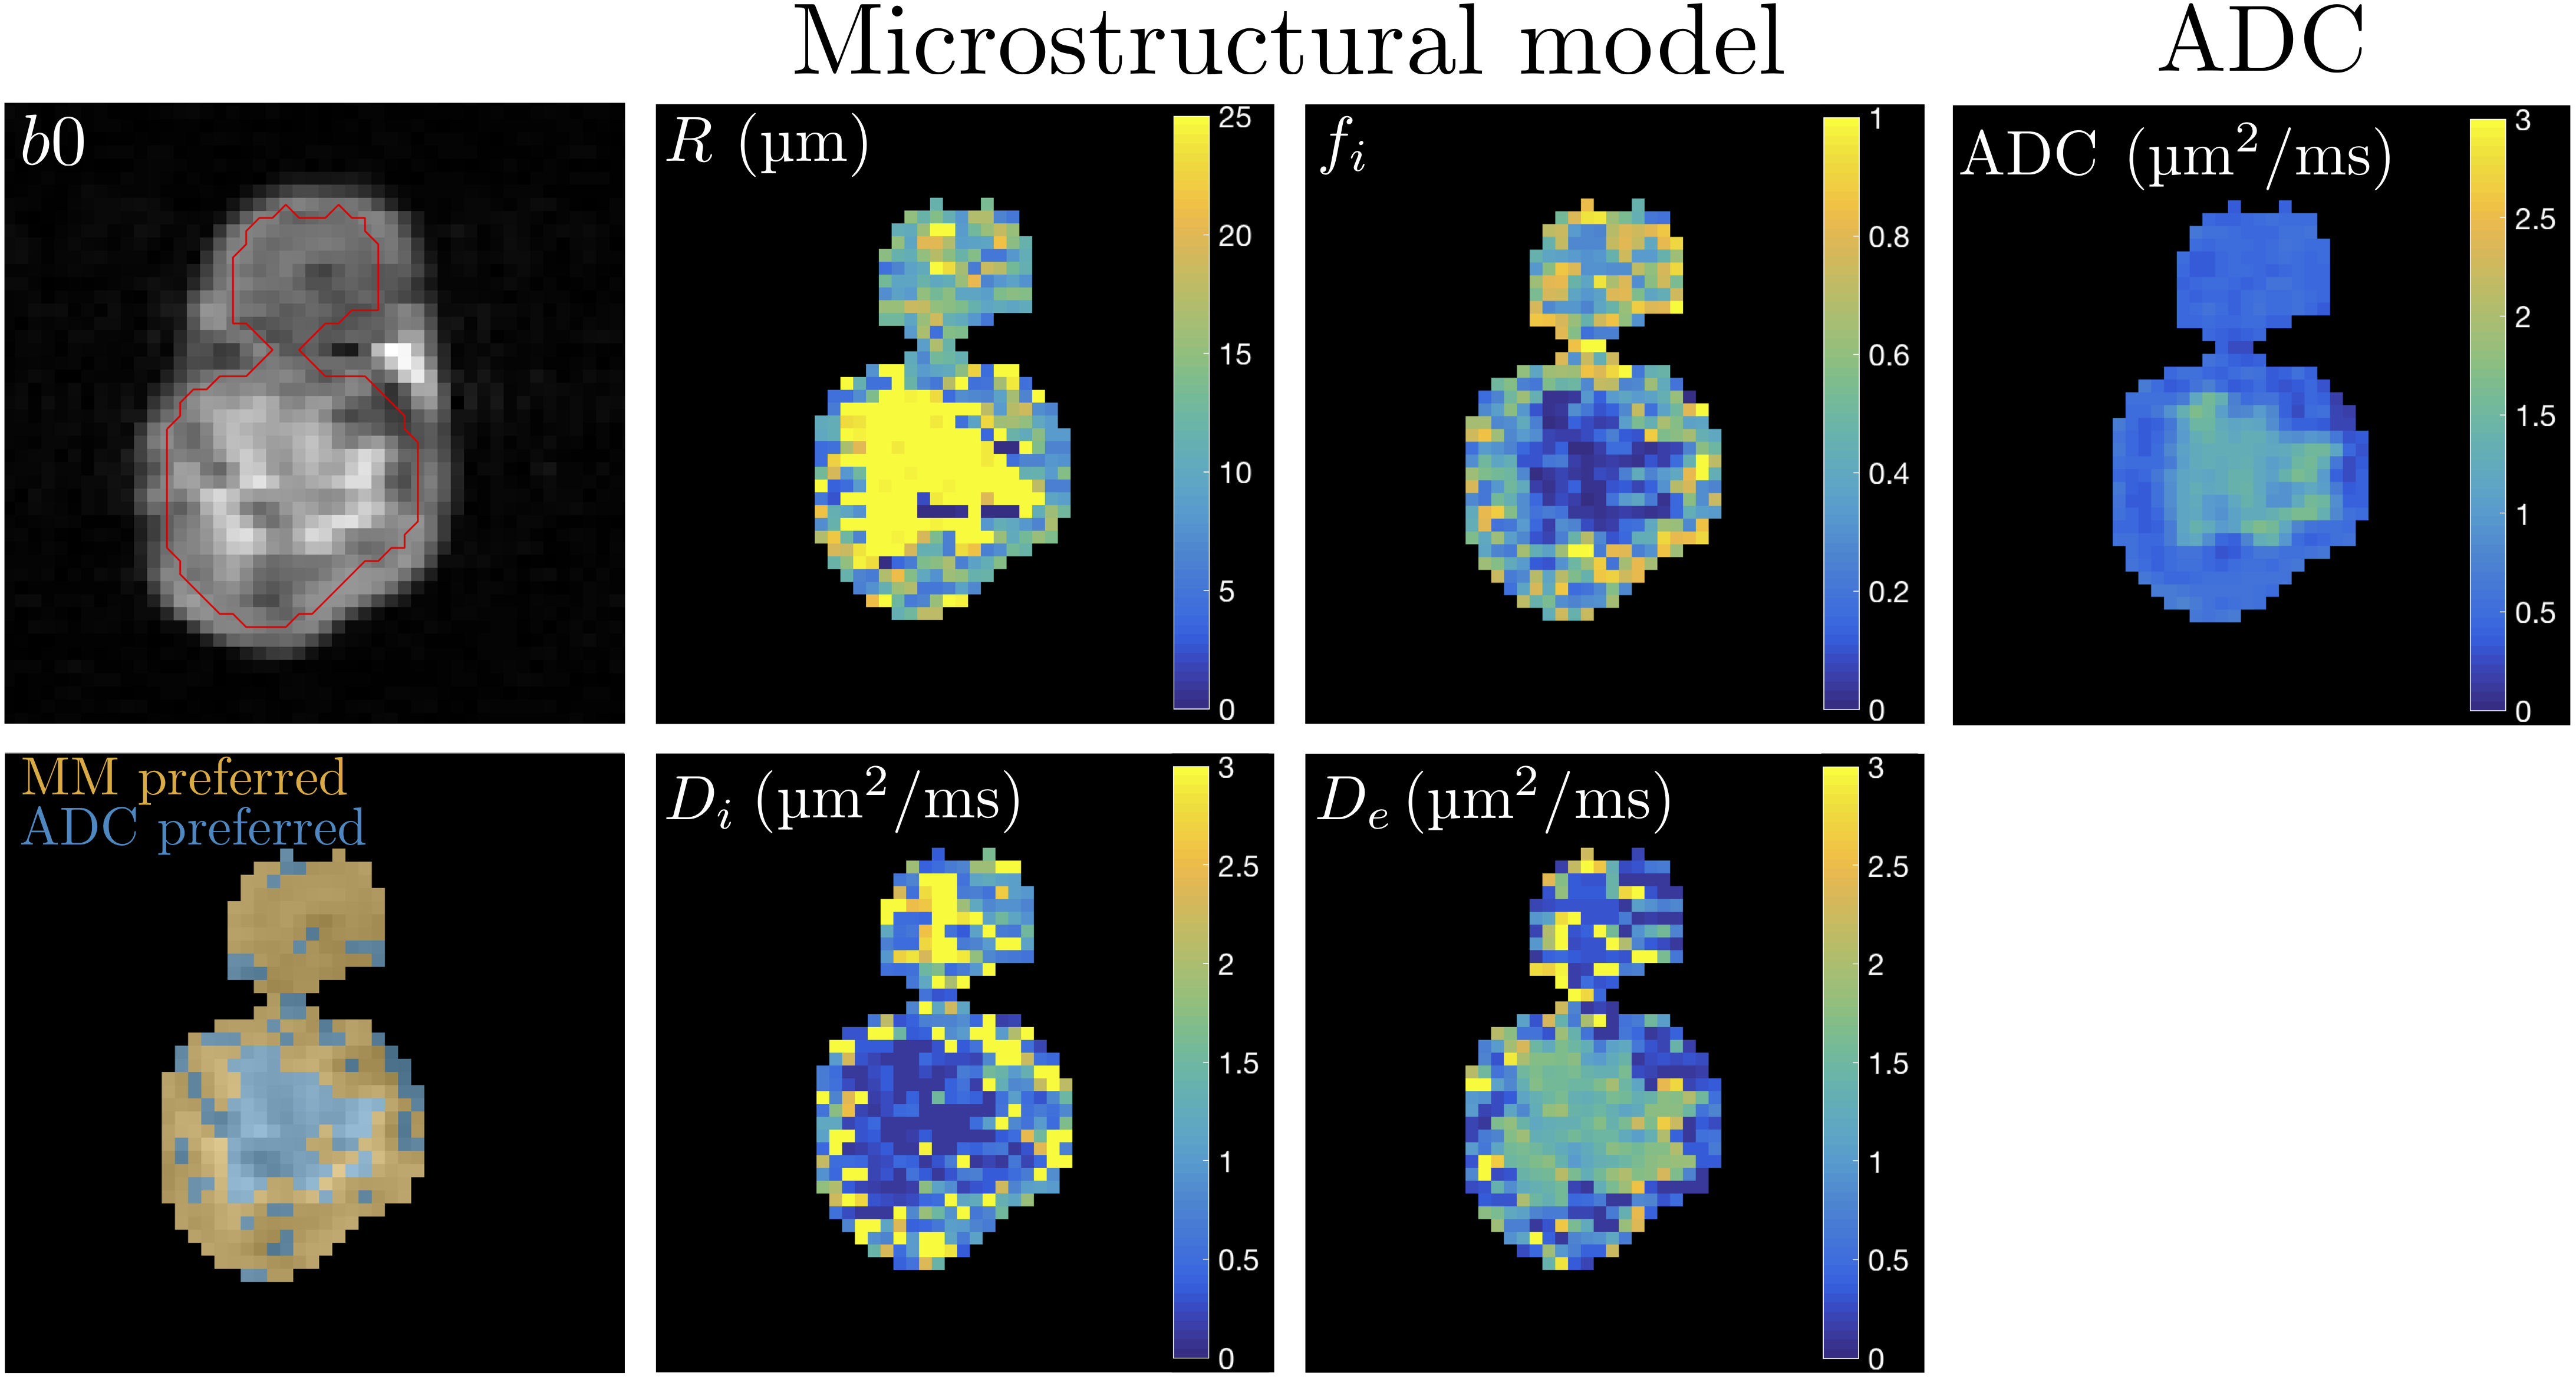
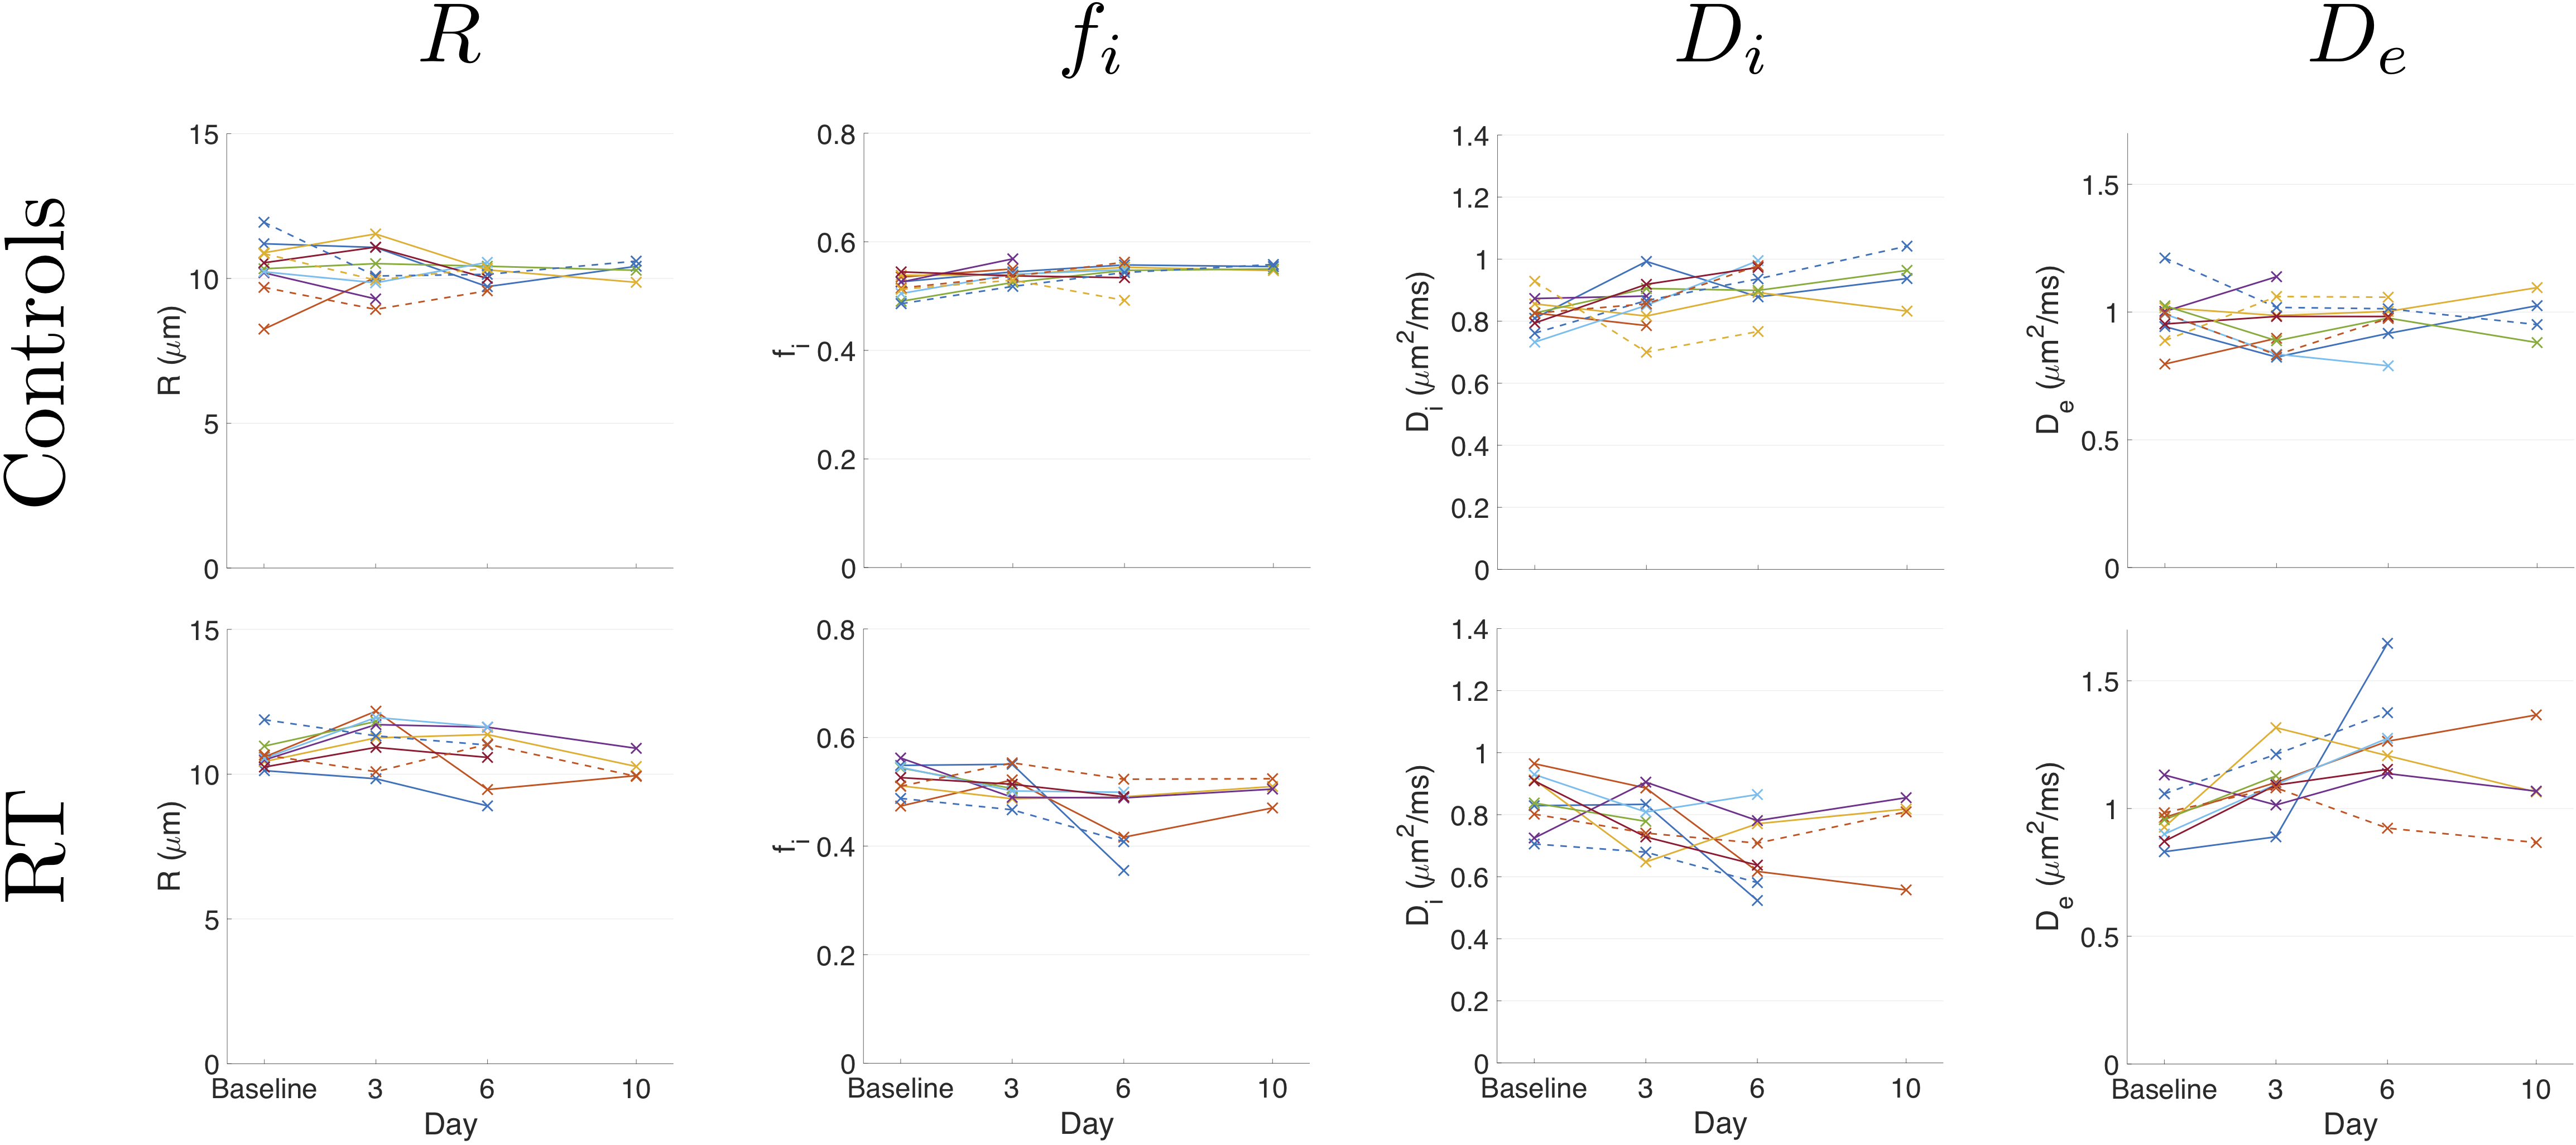
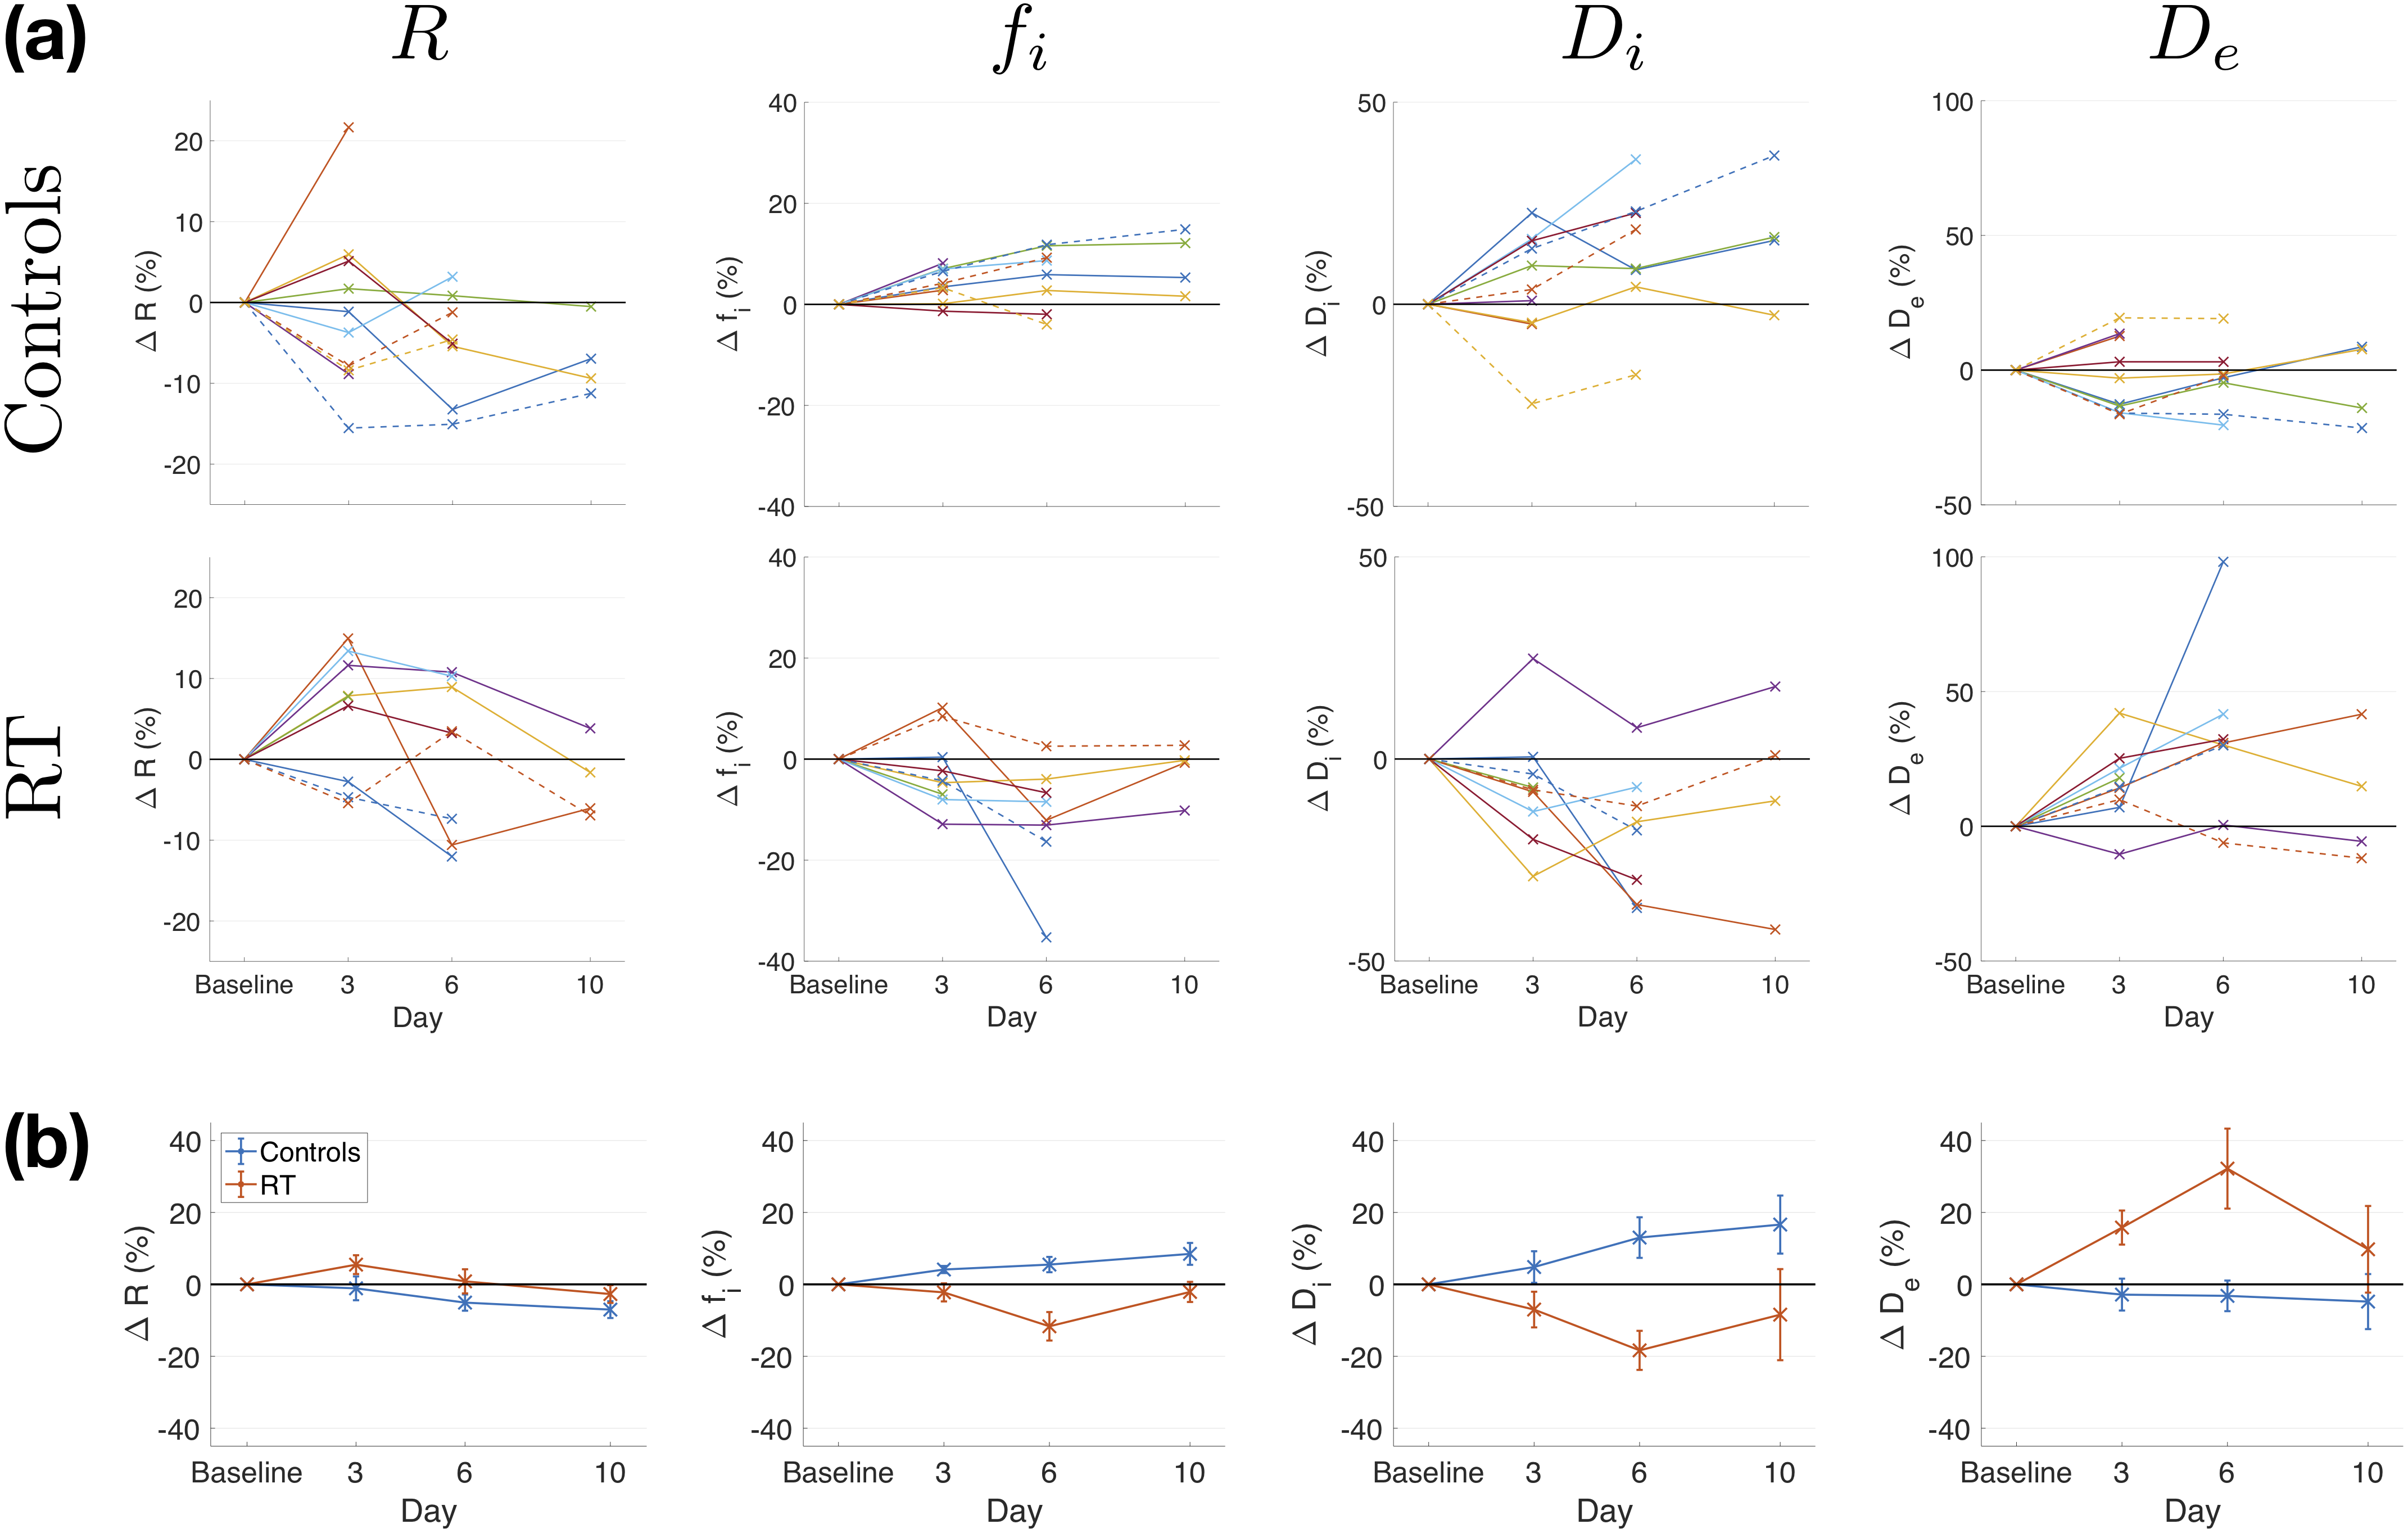
Analysis: Two models were separately fitted to the data. First, a two-compartment restricted diffusion microstructural model (MM)4,5 was fitted, estimating cell radius, R, intracellular volume fraction, fi, and intra- and extra-cellular diffusivities, Di and De. Second, a monoexponential was fitted to the same data, yielding ADC; note that data from two diffusion times were included, making the ADC model appropriate only where diffusion is time-independent. Fits were compared using the corrected Akaike Information Criterion (AICc), taking the fit with the lower AICc as the preferred model in a given voxel (Figure 1). Within whole-tumour regions of interest (ROIs), the percentage of voxels with AICcMM < AICcADC was calculated to assess the proportion of tissue where diffusion may be considered restricted as opposed to free. Parameter distributions were obtained from voxels where MM was preferred, excluding fit failures (determined by parameter values being within 1% of fit constraints). Changes in median values were considered relative to baseline, using paired t-tests with absolute parameter values, uncorrected for multiple comparisons.
Results
In controls, the percentage of voxels where MM was preferred decreased at day 6 relative to baseline (p<0.005), while in RT there were decreases at days 3 and 6 (p<0.005; Figure 2). At baseline, this percentage was not significantly different between controls and RT (mean±SD = 61±5 and 66±7; p>0.05, two-sample t-test). Parameter maps showed intra-tumoural heterogeneity, with contrast in R, fi, Di and De between regions in which each model was preferred (Figure 3). Cell size changes were not detected for either group in regions preferring MM (Figure 4 – absolute values, p>0.05; Figure 5 – percentage changes), while intracellular volume fraction increased in controls (p<0.05, days 3 and 6), and decreased in RT (p<0.05, day 6). Intra- and extra-cellular diffusivities decreased (p<0.05, day 6) and increased (p<0.05, days 3 and 6), respectively, in RT, with neither changing in controls (p>0.05). Conventional ADC values (i.e., fitting to only ∆=9.86 ms data) did not change in controls (p>0.05), and increased at days 3 and 6 in RT (p<0.05, data not shown).Discussion
The changes in the percentage of voxels where AICcMM < AICcADC suggest that both groups have a reduction in the amount of tissue characterised by restricted diffusion, with a larger and earlier decrease in the treated tumours, potentially reflecting regional increases in oedema or necrosis. Parameter changes suggest that radiotherapy reduced intracellular volume fraction and altered intra- and extra-cellular diffusivities in regions hypothesised to be cellular. Such therapy-related variation in diffusivities suggests these should not be fixed to single values a priori2.Conclusion
The diffusion model comparison presented here provides two insights into tumour microstructure and treatment response. First, there is spatial and radiotherapy-related variation in different models’ suitability for describing water diffusion in tumour tissue, potentially reflecting different and changing microenvironments. Second, within restricted diffusion regions, microstructural parameters are sensitive to radiotherapy-induced changes.Acknowledgements
DJM and GLB contributed equally to this work; JPBO’C and GJMP contributed equally to this work. This work was supported by CRUK grants (C8742/A18097; Cancer Imaging Centre in Cambridge & Manchester, co-funded by the EPSRC) and (C19221/A22746; personal fellowship to JPBO’C). The authors gratefully acknowledge the assistance given by IT Services at The University of Manchester. G.J.M. Parker has a shareholding and part time appointment and directorship at Bioxydyn Ltd. which provides MRI services.References
1O’Connor et al., Nat Rev Clin Oncol 2017;14:169-186. 2Panagiotaki et al., Cancer Res 2014;74:1902-1912. 3Reischauer et al., Sci Rep 2017;7:5809. 4McHugh et al., Magn Reson Med 2018;80:147-158. 5Ianuş et al., J Magn Reson 2013;227:25-34.Figures