1014
Effect of cell complexity and size on diffusion MRI signal: a simulation study1Centre for Medical Image Computing, Department of Computer Science, University College London, London, United Kingdom
Synopsis
Mapping tissue microstructure in gray matter is becoming an important field of research in diffusion MRI. Previous studies have focused on characterizing different features separately, such as neurite density, branching order or soma size. However, the combined effect of different cell morphologies and sizes on the diffusion MRI signal has not yet been investigated. This work employs numerical simulations in more realistic cell configurations to investigate the effect of soma diameter, branch diameter and branching order, on the dMRI signal and its time dependence.
Introduction
Diffusion MRI (dMRI) is a popular non-invasive probe of tissue microstructure. Nevertheless, the relationship between the macroscopic signal and cellular architecture is not straightforward. Numerical simulations are playing a crucial role in dMRI research to understand the effect of various tissue features and/or acquisition parameters on the signal1-8. Although many microstructural models are designed for white matter3-6, recent studies have also focused on mapping gray matter tissue features, such as soma size7 or branching order8, which are important for characterizing different cortical areas and may reflect on brain development and pathology. However, the combined effect of different cell morphologies and sizes on the dMRI signal has not yet been investigated.
In this work, we employ the simulation framework described in1, to systematically study for the first time the combined effect of soma diameter, branch diameter and branching order, on the dMRI signal and its time dependence.
Methods
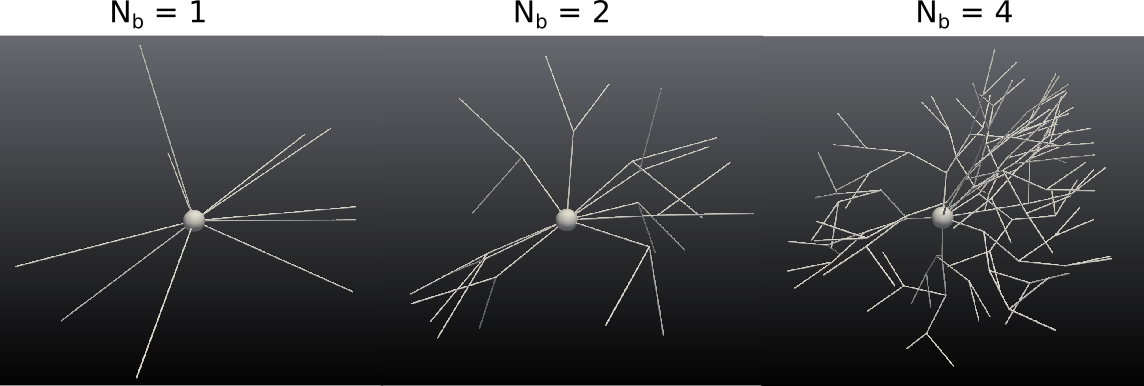
Cellular configurations. 3D meshes are generated using the pipeline described in1 for all combinations of the following parameters: soma diameter Ds={5,12,30} μm, branch diameter Db={1,2,3} μm, number of branching points Nb={1,2,4} and whole-cell diameter of 200μm, resulting in 27 cellular configurations. Examples of synthetic cells are illustrated in Figure 1. For each configuration, 20 different instantiations were generated.
Diffusion simulations. Monte Carlo (MC) simulations in Camino9 were used to generate diffusion trajectories inside each synthetic cell, with the following parameters: duration 200ms, 2,000 time steps, diffusivity D=2μm2/ms and 5000 walkers for each cell instance resulting in 100,000 walkers for each configuration. The signal was then computed for single diffusion encoding (SDE) sequences with gradient duration δ=1ms, gradient separation Δ={5,10,15,…195}ms, diffusion weighting b={0,0.5,1,…5,6,..,10,15,...60} ms/μm2 and 64 gradient directions. The signal is then averaged over directions and the 20 instantiations.
Results
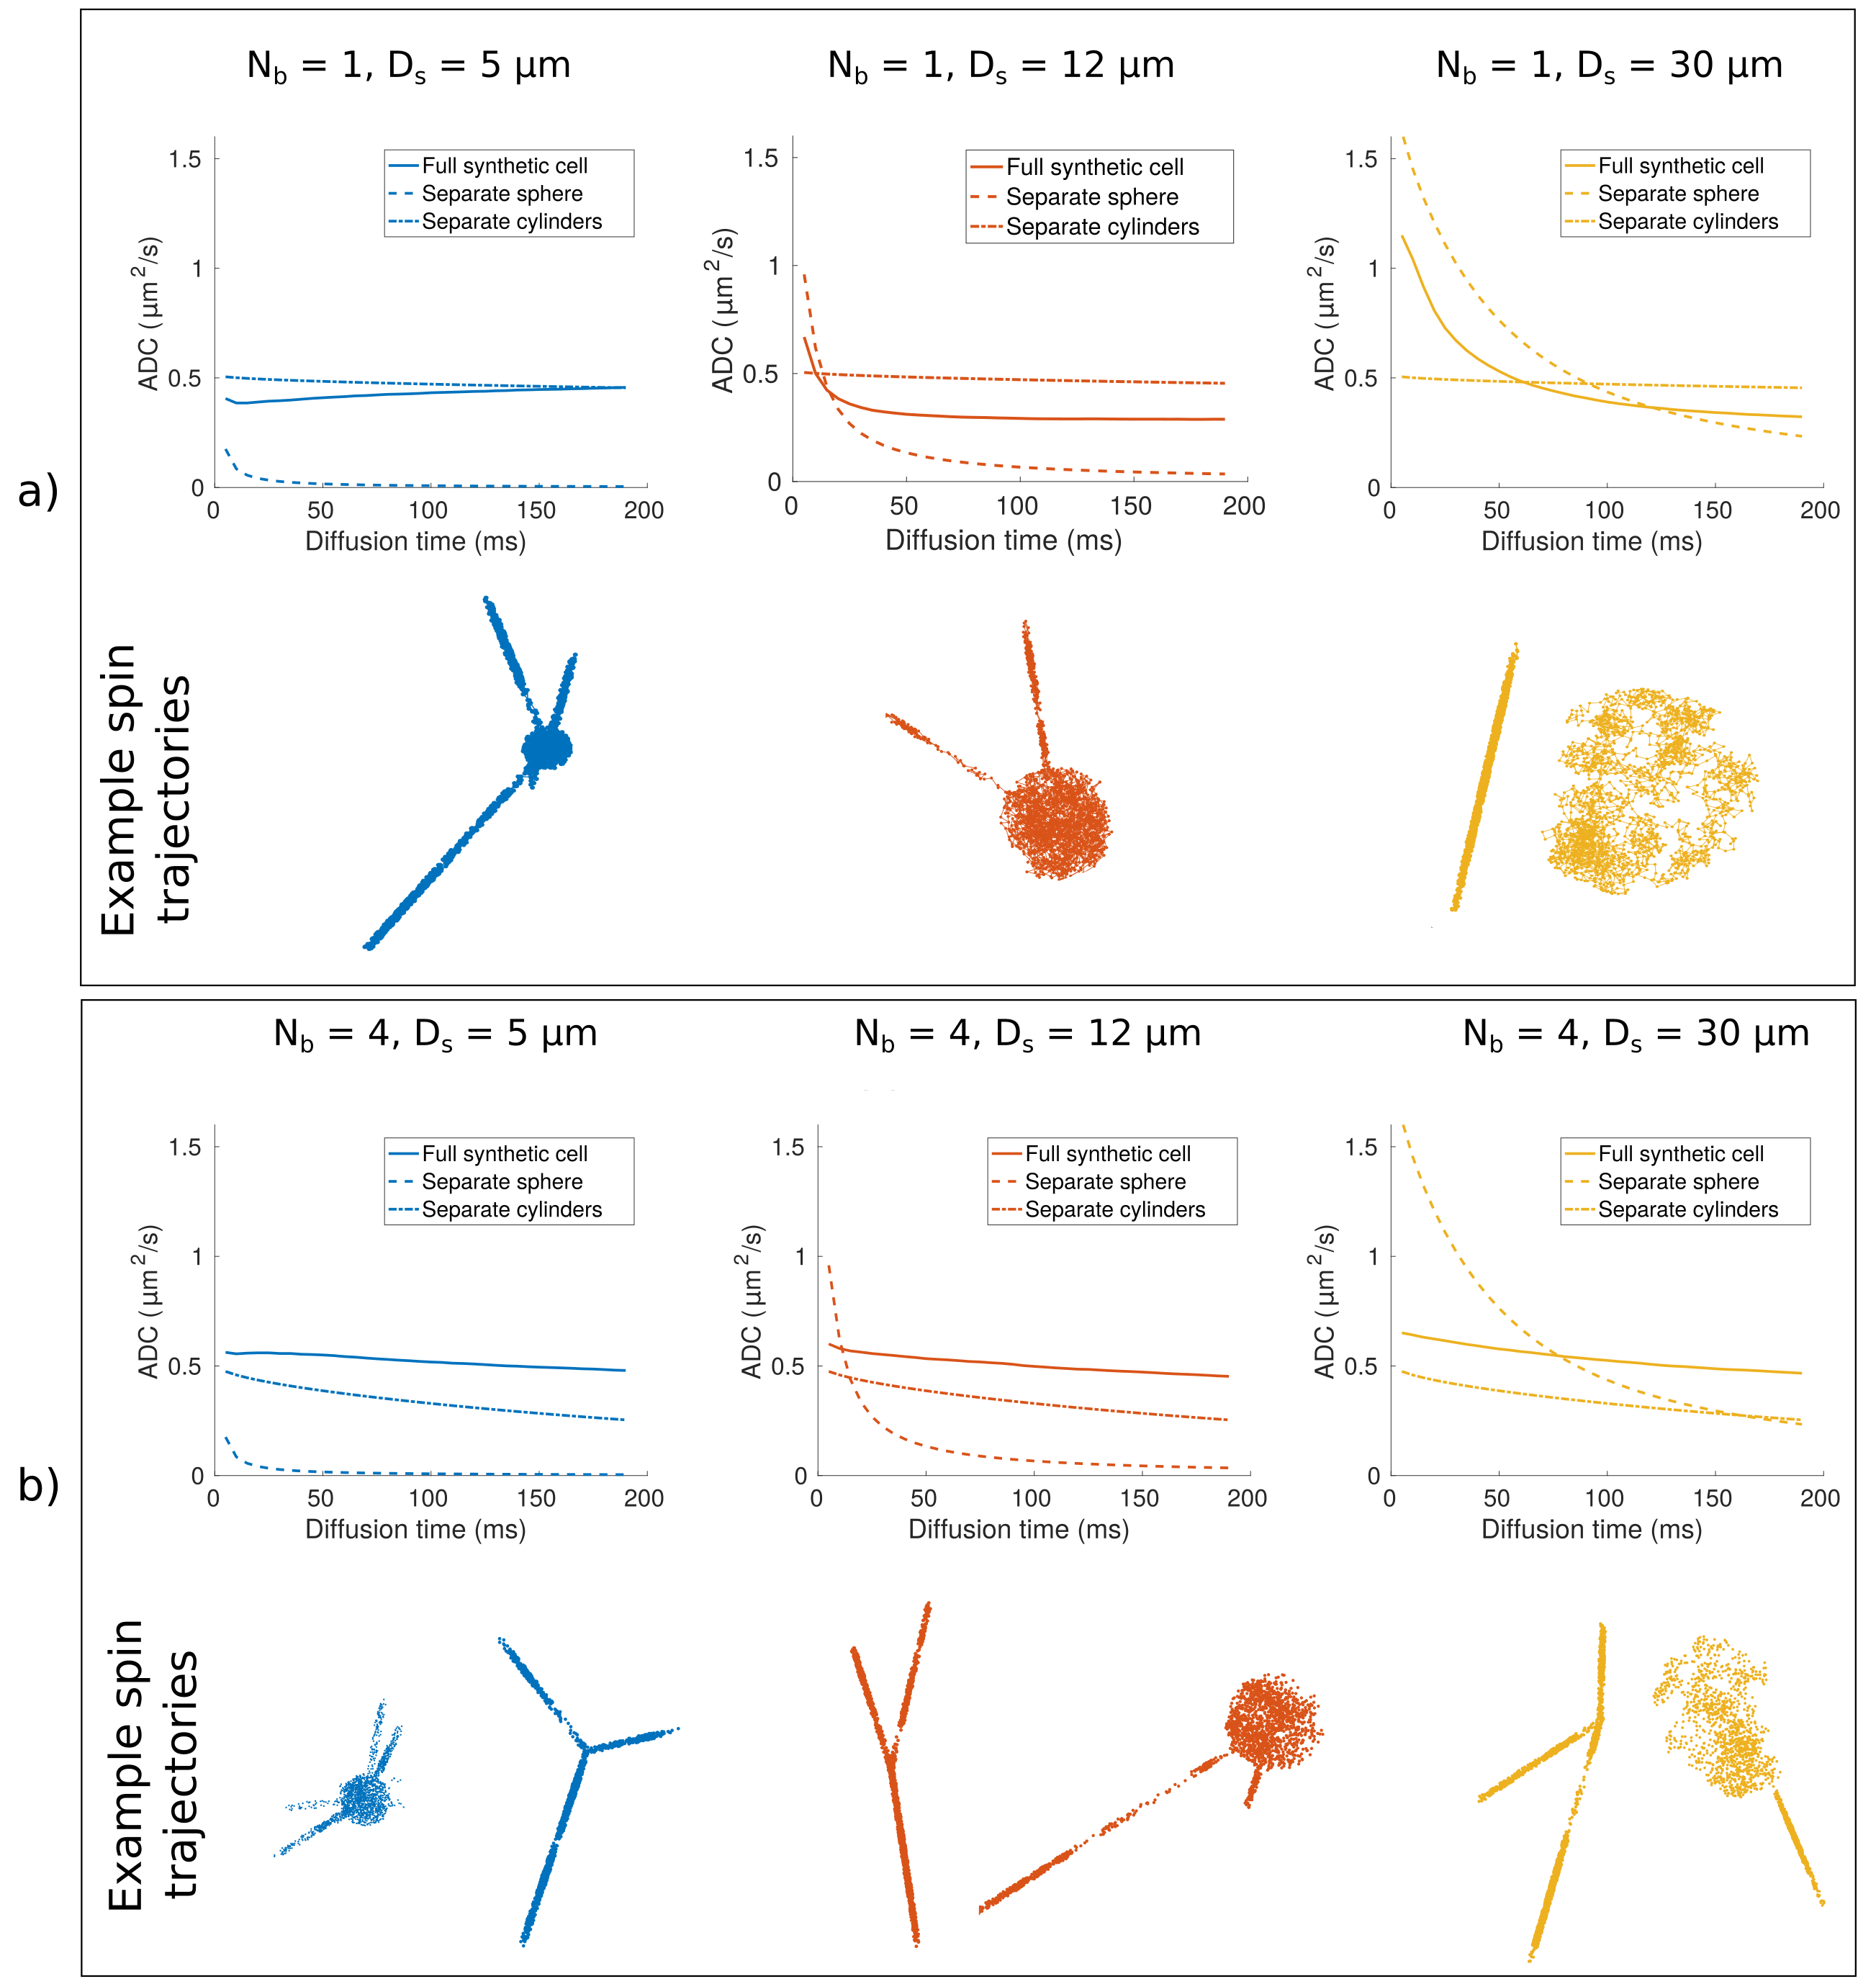
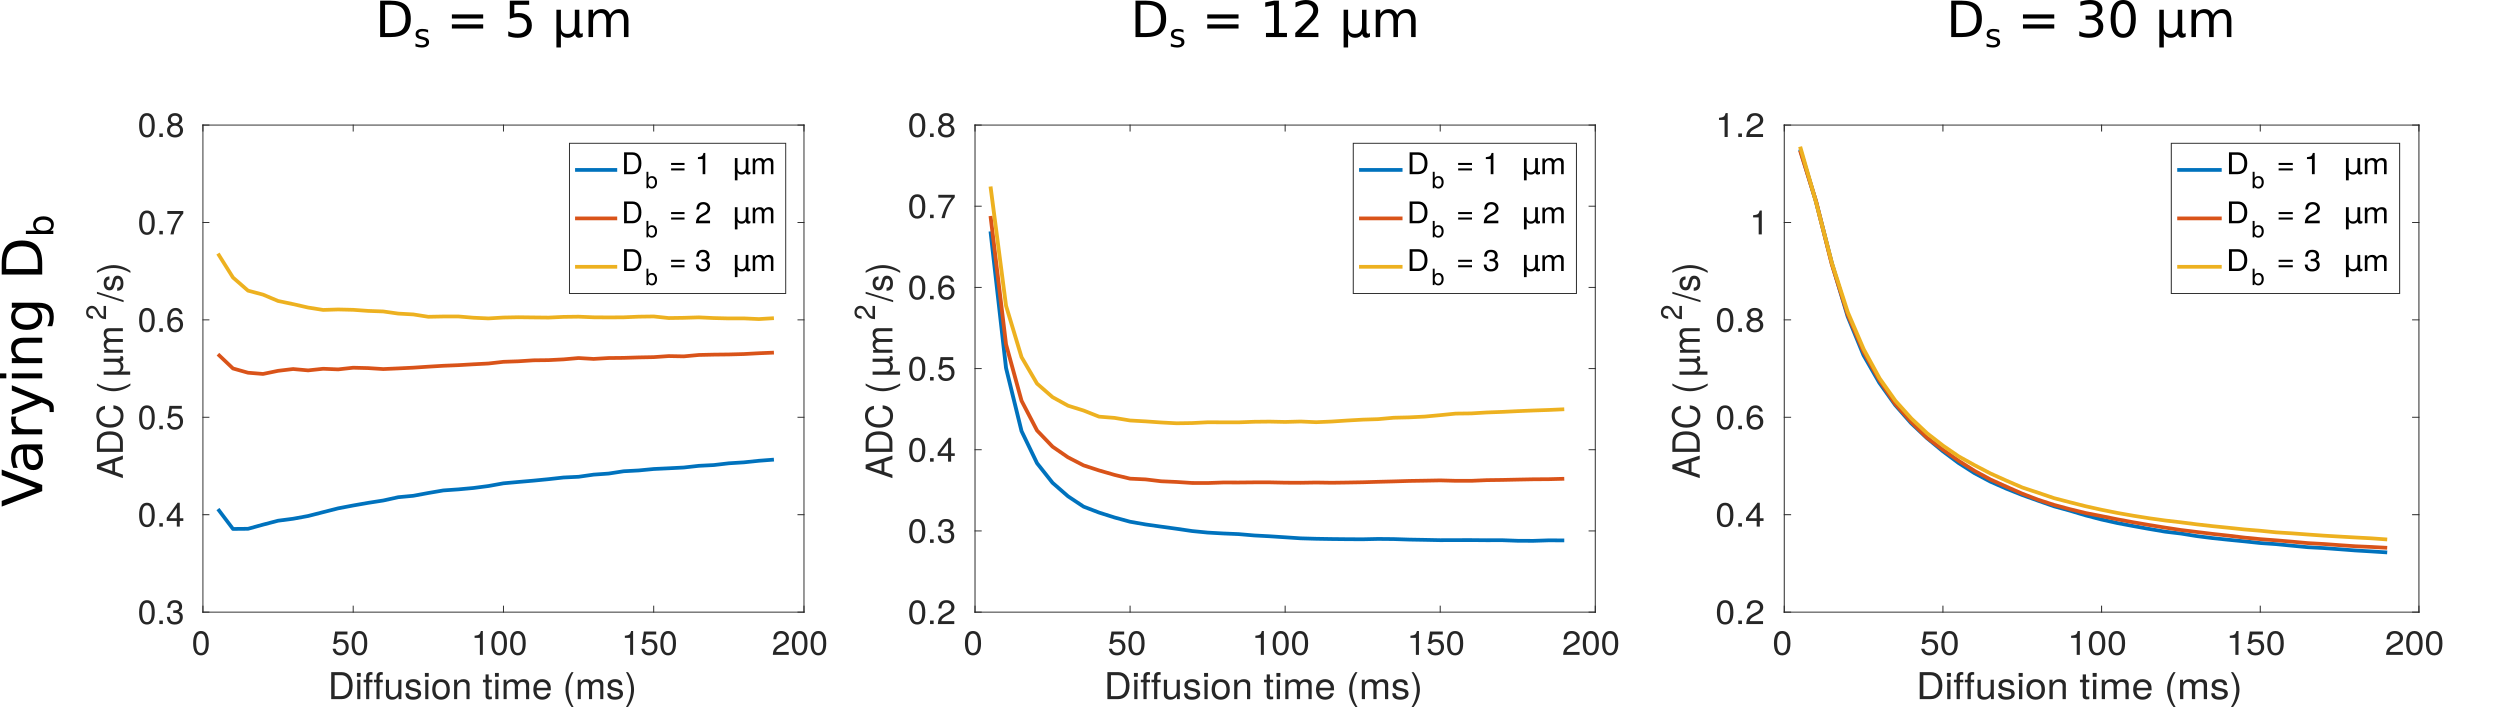
Experiment I. The first experiment investigates the time dependence of apparent diffusion coefficient (ADC) at b=1ms/μm2. Figure 2 plots the ADC dependence and example spin trajectories for cells with Db=1μm, Nb={1, 4} and different soma sizes. The ADC dependence for diffusion inside spheres and finite cylinders of corresponding sizes is also shown. For Nb=1 (simple dendritic tree) and small soma diameter (Ds=5μm, relative volume ~18%), there is a peculiar increase in ADC with time which tends towards the ADC of finite cylinders. Considering the specific geometries investigated, this is due to ‘hopping’ of the diffusing spins between different stick-like branches (and soma), which increases the apparent displacement with time. For larger soma sizes (Ds=12 and 30μm, relative volumes ~48% and 53%), the effect of hopping is not apparent and the ADC time dependence is dominated by diffusion in spherical restriction. For cells with Nb=4 (complex dendritic tree), the ADC of diffusion in full cells at long diffusion times is larger than both the ADC in finite cylinders or spheres, reflecting the effect of moving between branches. Figure 3 plots the ADC time dependence for cells with Nb=1 and varying Db, for three different soma sizes. For simple cells, the plots show that branch diameter has a larger impact on the ADC for small and medium soma sizes.
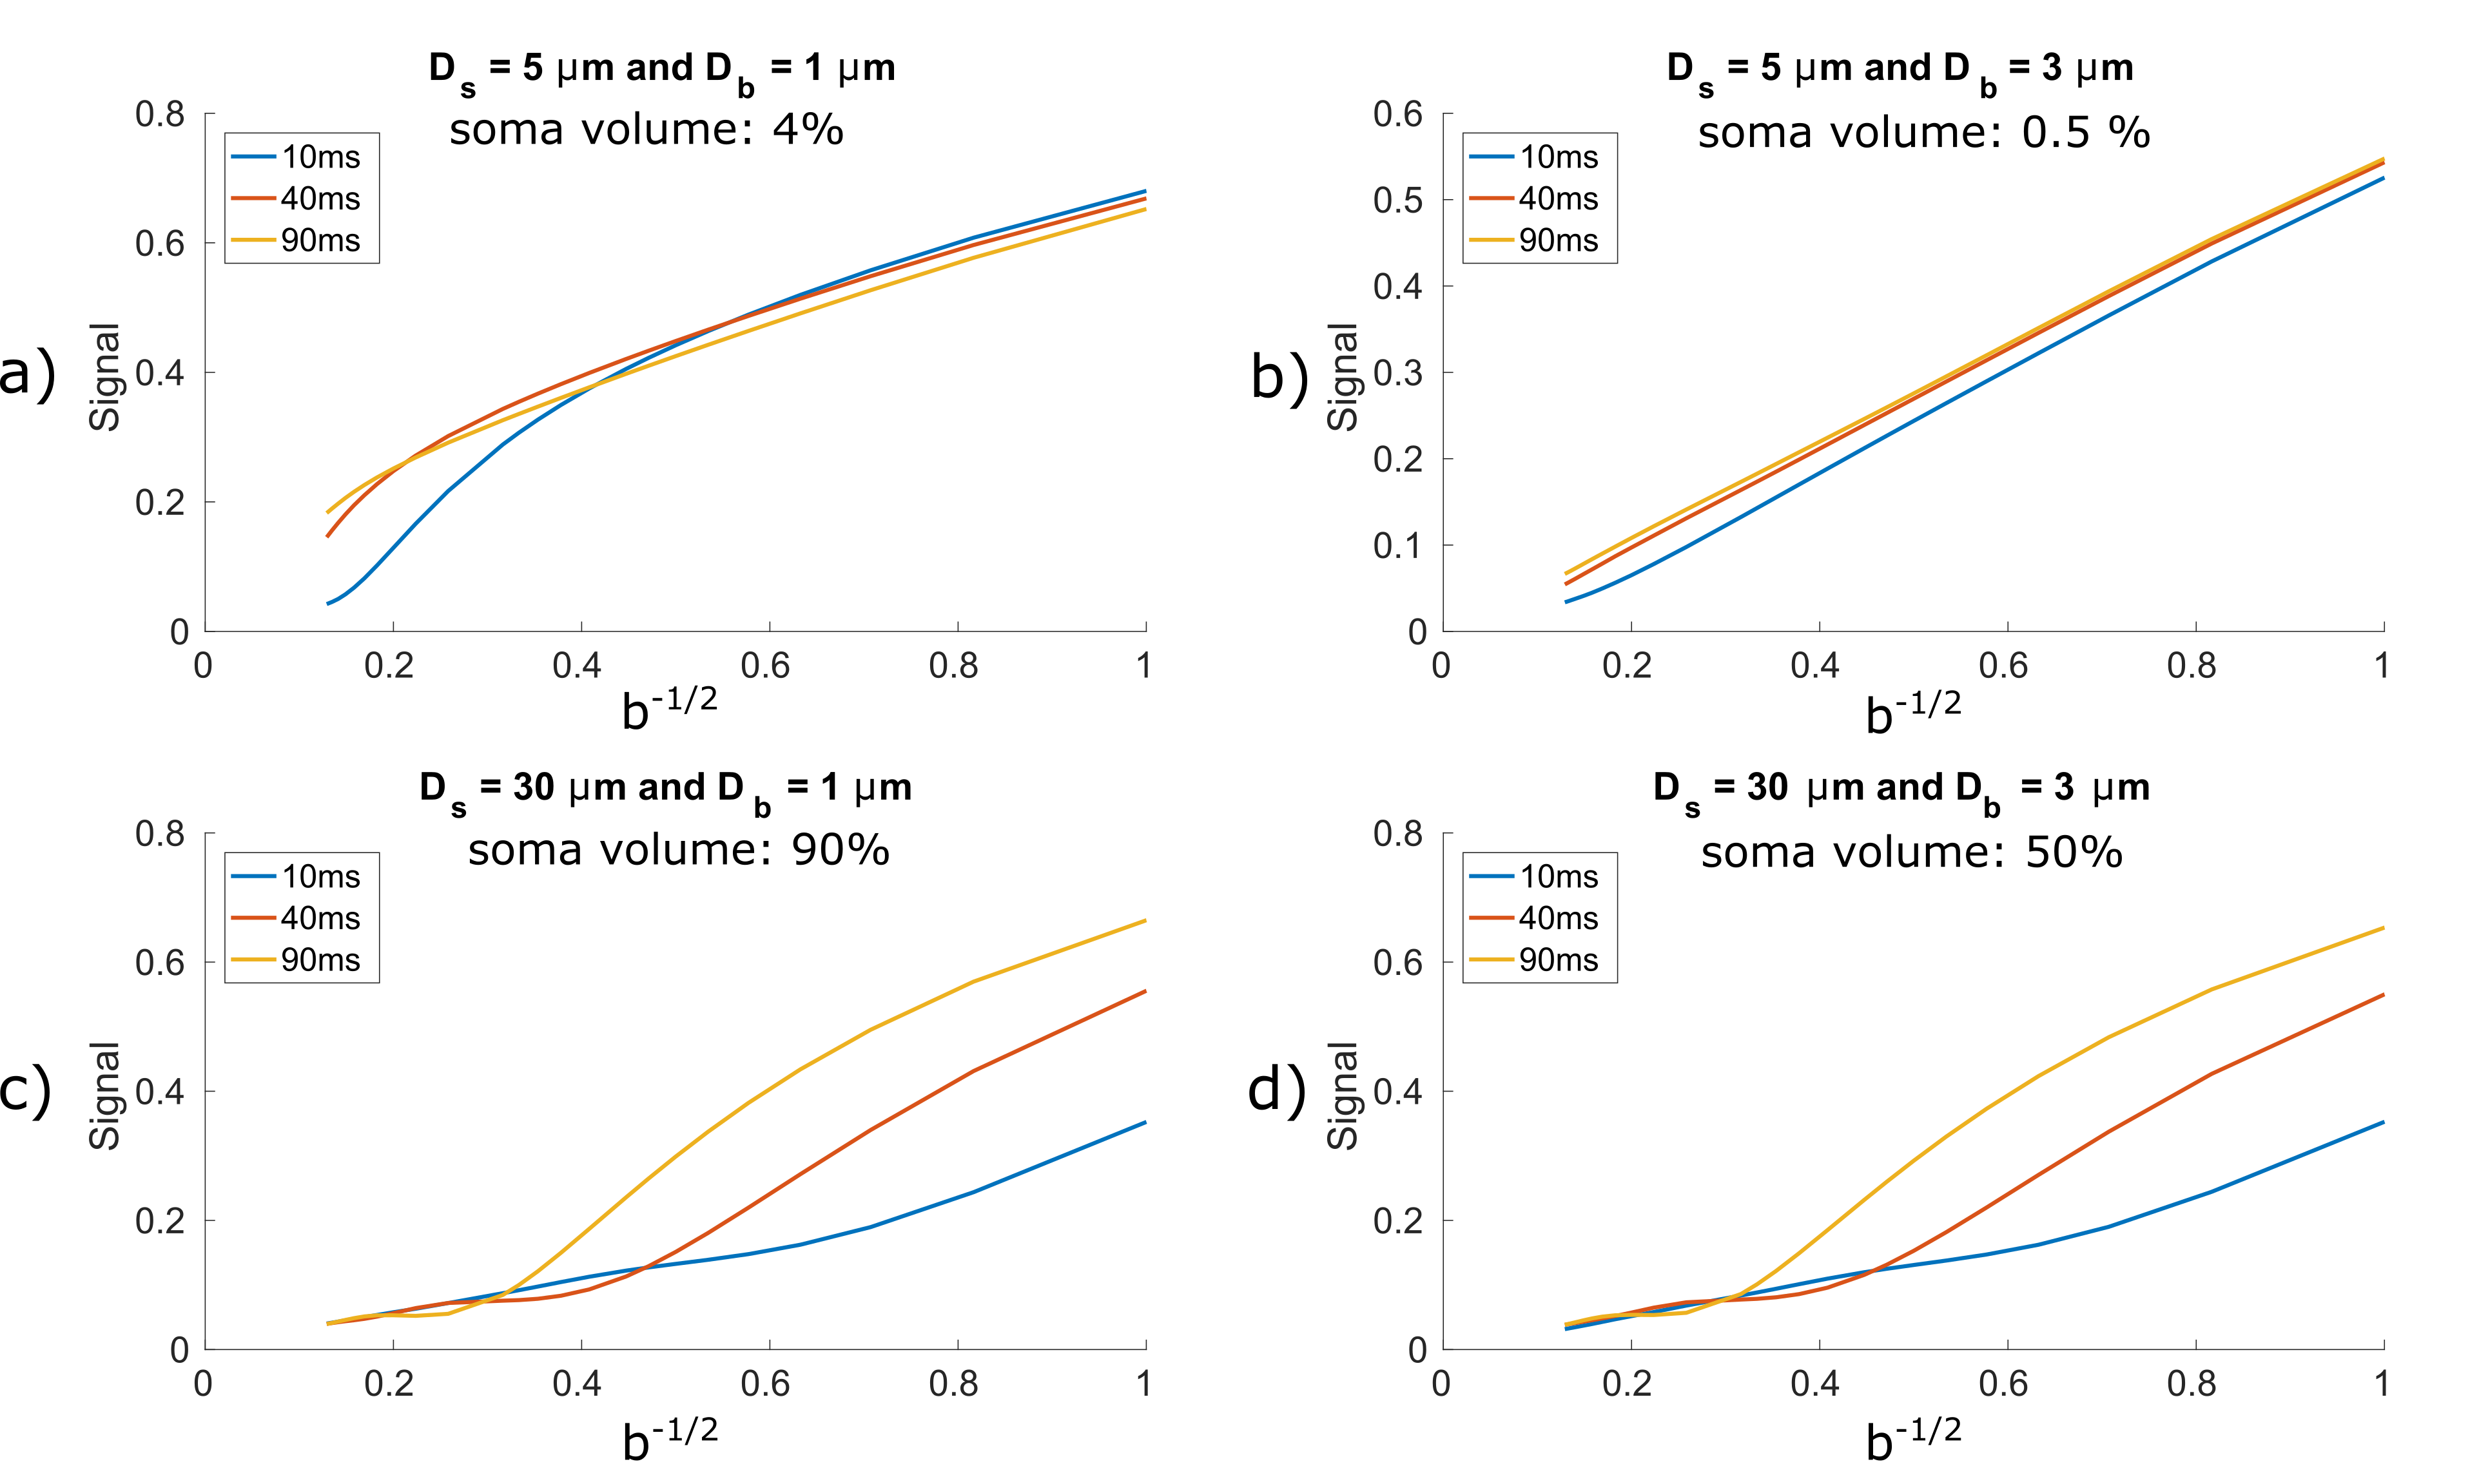
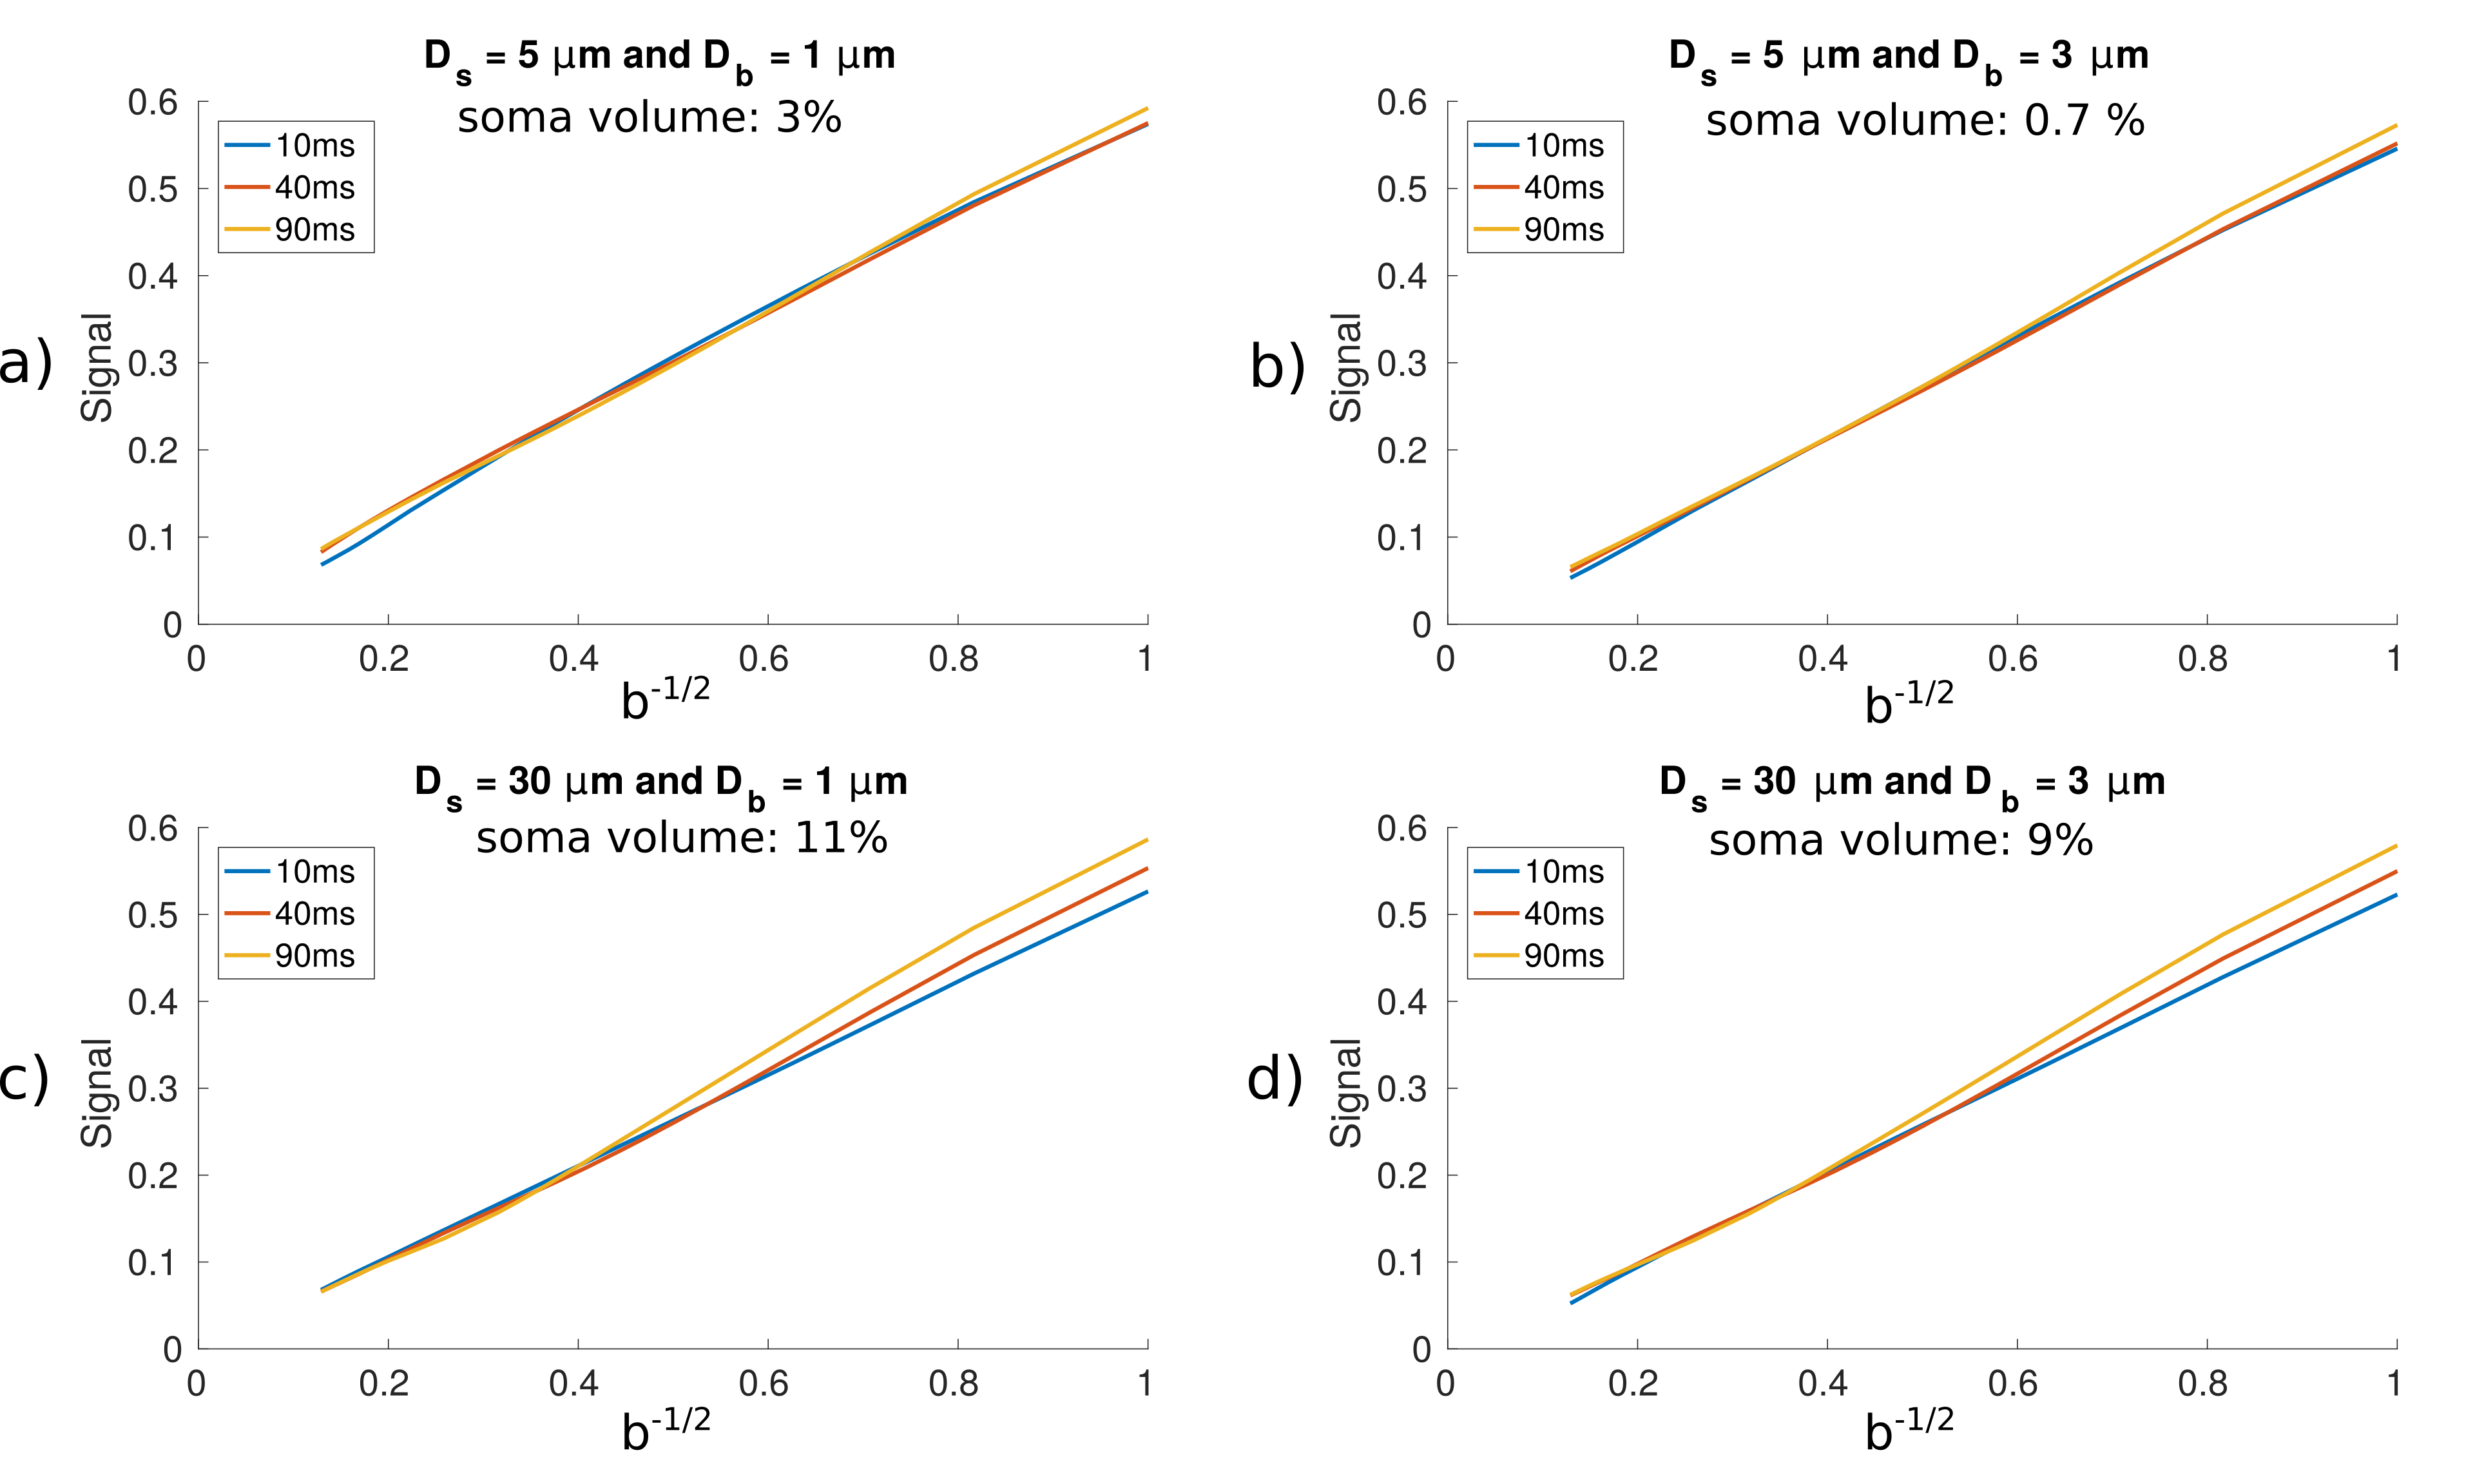
Experiment II.The second experiment investigates the b-dependence of the signal. Figure 4 and 5 plot the signal vs. b-1/2 for different diffusion times, soma and branch diameters, in cells with Nb=1 and Nb=4, respectively. For simple cells with Nb=1 and Ds=5μm (Figure 4a-b), the b-dependence is mainly driven by diffusion in sticks/cylinders, with the function becoming convex (a signature of spherical compartment7,10) only at high b-values. For cells with Ds=30μm (Figure 4c-d), and higher soma volume fraction, the function is convex over a wide range of b-values. As the diffusion time increases, the convexity shifts towards higher b-values. The more complex cells with Nb=4 (Figure 5a-d), show a highly diminished convexity, although in this case the soma volume fraction is lower, which likely influences the overall trend.
Discussion and Conclusion
This study investigates for the first time the combined impact of soma sizes, branch diameters and branching order on the dMRI signal, which can provide useful insights to characterize gray matter microstructure. For simple cells, the ADC time dependence points that ‘hopping’ between different branches is possible, however in reality this effect is likely masked by other more dominant effects such as extracellular diffusion, membrane permeability, etc. For larger soma sizes, the time dependence is mainly driven by spherical restriction. The complexity of the dendritic tree influences the time dependence of ADC as well as the b-value dependence. Future work will investigate more realistic cell morphologies1 (non-spherical soma, beading and/or undulating branches, etc.), as well as realistic packing and multi-compartmental T1/T2 effects.Acknowledgements
This work is supported by EPSRC (EP/G007748, EP/I027084/01, EP/L022680/1, EP/M020533/1, N018702/1, EP/M507970/1).References
1 Palombo, M. et al, A generative model of realistic brain cells with application to numerical simulation of diffusion-weighted MR signal, NeuroImage, 2018, under review. 2018, arXiv preprint arXiv:1806.07125..
2 Ginsburger, K. et al, Improving the Realism of White Matter Numerical Phantoms: A Step toward a Better Understanding of the Influence of Structural Disorders in Diffusion MRI. Frontiers in Physics, 2018, 6, 12.
3 Drobnjak, I. et al, PGSE, OGSE, and sensitivity to axon diameter in diffusion MRI: Insight from a simulation study. Magn Reson Med, 2016,75(2): 688–700.
4 Ianus, A. et al., Accurate estimation of microscopic diffusion anisotropy and its time dependence in the mouse brain, NeuroImage, 2018, 183:934-949
5 Fieremans, E. et al., Monte Carlo study of a two-compartment exchange model of diffusion. NMR Biomed 2010; 23:711-24.
6 Nilsson, M. et al. The importance of axonal undulation in diffusion MR measurements: a Monte Carlo simulation study. NMR Biomed 2012; 25:795-805.
7 Palombo, M. et al, A compartment based model for non-invasive cell body imaging by diffusion MRI, Proc. Int. Soc. Magn. Reson. Med. 2018, #1096.
8 Palombo, M. et al. New paradigm to assess brain cell morphology by diffusion-weighted MR spectroscopy in vivo. PNAS 2016; 113(24): 6671-6676.
9 Hall, M. G. and Alexander D. C. Convergence and parameter choice for Monte-Carlo simulations of diffusion MRI., IEEE Transactions on Medical Imaging, 2009, Vol. 28, pp. 1354-1364.
10 Palombo, M. et al, Abundance of cell bodies can explain the stick model’s failure to describe high b-value diffusion signal in grey matter. Proc. Int. Soc. Magn. Reson. Med. 2018, #1096.
Figures