1013
Validating the single fODF and single microstructure kernel assumption in vivo using local SHARD features1Centre for the Developing Brain, School of Biomedical Engineering and Imaging Sciences, King's College London, London, United Kingdom, 2Biomedical Engineering Department, School of Biomedical Engineering and Imaging Sciences, King's College London, London, United Kingdom, 3Champalimaud Research, Champalimaud Centre for the Unknown, Lisbon, Portugal, 4iMinds - Vision Lab, University of Antwerp, Antwerp, Belgium
Synopsis
Most biophysical models of diffusion in the white matter assume that the diffusion MRI signal can be written as the convolution of a single fibre orientation distribution function and a single microstructural kernel, thereby ignoring microstructural differences between fascicles being captured in the same voxel. Here, we validate this assumption by various model selection approaches, i.e., Relative variance explained, F-test of 1- and 2-component models, and Component noise likelihood, and conclude that biologically more realistic, but mathematically more complex versions of the Diffusion Standard Model do not significantly improve the goodness-of-fit, even in case of rich diffusion MR data.
Introduction
Extracting more specific MRI biomarkers of white matter (WM) microstructure and integrity relies on biophysical modelling. Diffusion MRI has shown great promise because of its sensitivity to the relevant length scale1. A plethora of microstructural WM models are derived from the same “Standard Model”, in which the diffusion MRI signal $$$S(b,\hat{g})$$$ is modelled as a single convolution between the fibre orientation distribution $$$\mathcal{P}\!\left(\hat{n}\right)$$$, capturing the macroscopic fibre geometry, and a microstructural kernel $$$\mathcal{H}\!\left(b,\hat{g}\right)$$$2-5: $$S(b,\,\hat{g})\,=\,\int\,d\hat{n}\,\mathcal{P}\!\left(\hat{n}\right)\,\mathcal{H}\!\left(b,\hat{g} \cdot\,\hat{n}\,\right)\quad.$$
The microstructural kernel is often parameterized by various compartmental diffusivities and signal fractions. Several constraints and assumptions have been heavily debated in the community, but until now, many of the most “general” models rely on the widely adopted assumption that the same kernel can represent each fascicle within a voxel. This implicit assumption imposes a clear simplification of the biology given that microstructural features might be fascicle-specific. In this work, we will evaluate how well the data is described by such a model in even the most complex fibre configurations.
Methods
Data: Multi-shell data were acquired in 4 healthy adults on a 3T Philips Achieva system with 32-channel head coil. The dMRI data were sampled at b=900,1600,2500,3600,4900, and 6400 s/mm2 with 70 directions each, in addition to 30 b=0 volumes with reverse phase encoding. TE=91ms; TR=6260ms; MB=2; SENSE=2; isotropic resolution 2.5mm. Data were processed with image denoising in complex data6,7; Gibbs ringing suppression8; and motion and distortion correction9,10.
Local SHARD decomposition: When cast into the spherical harmonics (SH) basis, spherical convolution becomes a multiplication $$$s_{\ell,b}^m\,=\,h_{\ell,b}\,p_\ell^m$$$ 2-5, which can also be written as the outer product $$$\mathrm{S}_\ell\,=\,\mathbf{h}_\ell\,\mathbf{p}_\ell^\top$$$ of vectors $$$\mathbf{h}_\ell\,=\,[h_{\ell,1},\,h_{\ell,2},\,\ldots]$$$ and $$$\mathbf{p}_\ell\,=\,[p_\ell^{-\ell},\,\ldots,\,p_\ell^\ell]$$$. Under the single-fODF assumption and in the absence of noise $$$\mathrm{S}_\ell$$$ is a rank-1 matrix11. Conversely, multiple non-parallel fODFs would lead to a rank >1.
Here, we use the singular value decomposition (SVD) of matrices $$$\mathrm{S}_\ell$$$ (a voxel-wise SHARD decomposition11) as a means of revealing the presence of multiple microstructure kernels for different orientations in the voxel. Specifically, the leading left and right singular vectors of $$$\mathrm{S}_\ell$$$ retrieve the predominant microstructure response and fODF respectively, and the singular values $$$\sigma_{\ell,n}$$$ capture their effect sizes.
Model selection: We look at 3 different measures for rank selection:
- Relative variance explained: The effect size of each orthogonal SHARD component is given by $$$\sigma_{\ell,n}^2$$$. The sum of the effect sizes of the $$$n=1$$$ components across SH bands $$$\ell$$$ measures the total variance in the principal component. When also adding across components $$$n$$$, we obtain the total variance in the data. The ratio of both measures is the relative variance explained by the first component.
- F-test of 1- and 2-component models: Including additional SHARD components improves the goodness-of-fit at the expense of more parameters. This trade-off is evaluated in an F-test between a 1-component representation with $$$n_\mathrm{shells}+(2\ell+1)$$$ d.o.f. and a 2-component representation with $$$n_\mathrm{shells}+(2\ell+1)-2$$$ additional d.o.f.
- Component noise likelihood: The effect sizes of the noise components in matrices $$$\mathrm{S}_\ell$$$ follow the Marchenko-Pastur distribution12, scaled with $$$4\pi\,\sigma^2$$$ where $$$\sigma^2$$$ is the noise level. We evaluate the probability that each component originates from noise via the survival function ($$$1-$$$cumulative PDF).
Results
Fig.1 illustrates the power in the different components and the ratio of signal variance explained in the first component for all subjects. We observe that the leading component explains the overwhelming majority of the signal, whereas the others primarily capture image artefacts due to unfolding and CSF pulsation. The %-Variance explained in the principal component is >95% across the full brain, as also evidenced by the histogram in Fig.2.
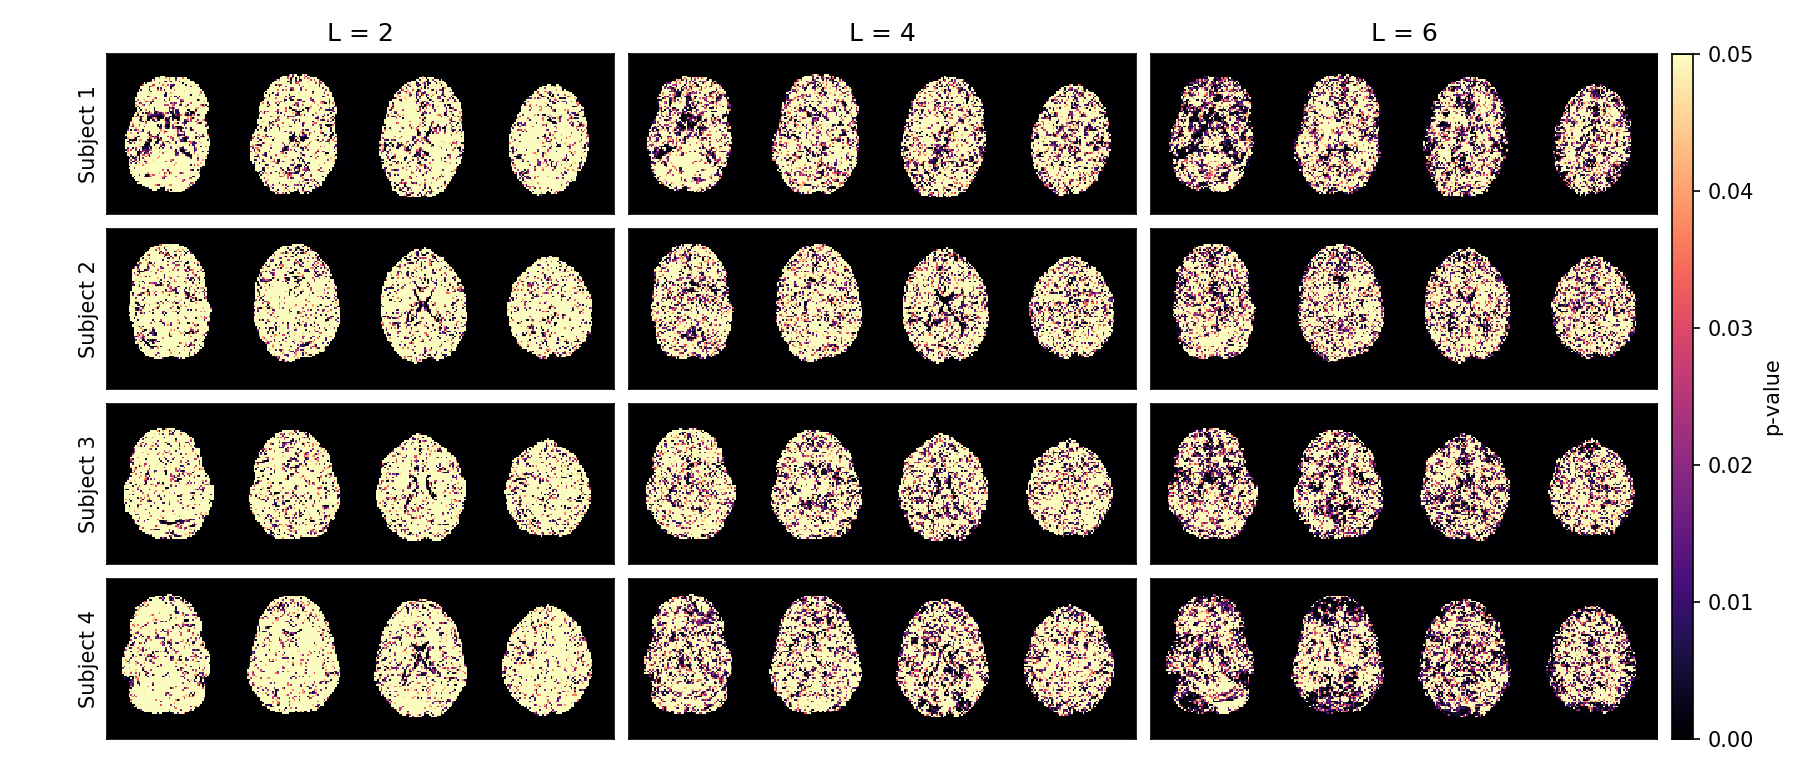
The results of the F-test in Fig.3 show that the null hypothesis is not generally rejected, meaning that a two-component representation offers no significant improvement over the single-fODF representation.
Fig.4 shows that the leading component in white matter stands out from the noise bulk (low noise probability). In gray matter and CSF, the noise probability is higher in $$$\ell=2$$$ and $$$\ell=4$$$ SH bands due to their isotropic nature. The second and higher SHARD components are with high likelihood attributed to noise, again indicating that no information is to be gained from adding a second component.
Discussion and Conclusion
Although microstructural features are likely to be fascicle-specific, the diffusion MRI data in the white matter is well described by the convolution of a single fODF and single kernel, regardless of the complexity of the underlying fibre geometry. Our results suggest that we can build upon the current Standard Model of diffusion, despite the implicit “single convolution” assumption, and that a more complex model would not improve the goodness-of-fit.Acknowledgements
This work was supported by ERC grant agreement no. 319456 (dHCP project), the Wellcome EPSRC Centre for Medical Engineering at King’s College London [WT 203148/Z/16/Z], by the National Institute for Health Research (NIHR) Biomedical Research Centre based at Guy’s and St Thomas’ NHS Foundation Trust and King’s College London, and the Research Foundation - Flanders (FWO; grant number 12S1615N). The views expressed are those of the authors and not necessarily those of the NHS, the NIHR or the Department of Health.References
- Novikov DS, Kiselev VG, Jespersen SN. On modeling. Magn. Reson. Med. 2018; 79(6):3172-3193.
- Tournier J-D, Calamante F, Connelly A. Robust determination of the fibre orientation distribution in diffusion MRI: non-negativity constrained super-resolved spherical deconvolution. NeuroImage 2007; 5(4):1459-72.
- Jespersen, S. N., Kroenke, C. D., Ostergaard, L., Ackerman, J. J., Yablonskiy, D. A.. Modeling dendrite density from magnetic resonance diffusion measurements. Neuroimage 2007; 34 (4), 1473–1486.
- Reisert M, Kellner E, Dhital B, Hennig J, Kiselev VG. Disentangling micro from mesostructure by diffusion MRI: A Bayesian approach. Neuroimage 2017; 147:964-975.
- Novikov DS, Veraart J, Jelescu IO, Fieremans E. Rotationally-invariant mapping of scalar and orientational metrics of neuronal microstructure with diffusion MRI. Neuroimage 2018; 174:518-538.
- Veraart J, Novikov DS, Christiaens D, Ades-Aron B, Sijbers J, Fieremans E. Denoising of diffusion MRI using random matrix theory. NeuroImage 2016;142:394-406.
- Nadakuditi RR. Optshrink: An algorithm for improved low-rank signal matrix denoising by optimal, data-driven singular value shrinkage. IEEE Trans Inf Theory 2014; 60(5):3002–3018.
- Kellner E, Dhital B, Kiselev V, Reisert M. Gibbs-ringing artifact removal based on local subvoxel-shifts. MRM 2016; 76(5):1574-1581.
- Andersson JLR, Skare S, and Ashburner J. How to correct susceptibility distortions in spin-echo echo-planar images: application to diffusion tensor imaging. Neuroimage 2003; 20(2):870-888.
- Andersson JLR, Sotiropoulos SN. An integrated approach to correction for off-resonance effects and subject movement in diffusion MR imaging. NeuroImage 2016; 125:1063-1078.
- Christiaens D, Cordero-Grande L, Hutter J, Price AN, Deprez M, Hajnal JV, Tournier J-D. Learning compact q-space representations for multi-shell diffusion-weighted MRI. IEEE Trans Med Imaging 2018; in press.
- Marchenko VA, Pastur LA. Distribution of eigenvalues for some sets of random matrices. Mathematics of the USSR-Sbornik 1967; 1(4):457-483.
Figures