1012
Revisiting double diffusion encoding MRS in the mouse brain at 11.7 T: what microstructural features is metabolite diffusion sensitive to?1Molecular Imaging Research Center (MIRCen), Commissariat à l'Energie Atomique (CEA), Fontenay-aux-Roses, France
Synopsis
Double diffusion encoding MRS (DDE-MRS) was shown to be highly sensitive to cell microstructure, in particular cell fiber diameter. Here we revisit the ability of DDE-MRS to probe microstructure by quantifying DDE-MRS signal for six metabolites with high accuracy. We show that signal modulation differs for neuronal and glial metabolites, yielding larger fiber diameters for glia when using a model of isotropically oriented cylinders, as previously reported. However, fiber diameters appear overestimated. Further data acquisition and modeling suggests DDE-MRS is not only sensitive to fiber diameter but also to other microstructural features, such as cell body diameter or fiber length.
Introduction
Double diffusion encoding MRS (DDE-MRS) relies on the use of two consecutive diffusion blocks whose relative directions are varied during the experiment. Unlike single diffusion encoding MRS (SDE-MRS), DDE-MRS has been predicted to display an angular dependence on both micro-anisotropy (µA) at null/short mixing time and compartment shape anisotropy (CSA) at long mixing time [1-3]. Recent works have reported DDE-MRS in the rat brain, using polychromatic RF pulses targeting a few resonances of interest (two or three), and suggesting that CSA was mostly reflecting cell fiber diameter [4, 5]. Here we revisit the ability of DDE-MRS to assess fiber diameter, taking advantage of a high-sensitivity cryoprobe and using conventional RF pulses allowing the detection of more metabolites.Methods
Four C57BL/6J wild type mice were scanned on a 11.7 T Bruker Scanner (Gmax=752 mT/m) using a cryoprobe. DDE-MRS was performed in a 63 µL voxel in the hippocampus, using a sequence comprising a spin-echo module with two diffusion blocks followed by a LASER localization module (TE_SE/TE_LASER=119/25 ms, Δ/δ/TM=30/4.5/29.5 ms, b=10 ms/µm² per diffusion block), similarly to [4]. The first pair of diffusion gradients was applied along X whilst gradient orientation for the second diffusion block was incremented from 0 to 360° in the XY plane by 45° steps. Signal post-processing was performed as described in [6], including scan-to-scan phasing and inclusion of an experimental macromolecule (MM) spectrum in LCModel for accurate diffusion-weighted signal quantification. Experimental data (averaged across animals for each metabolite) were first fitted to the function A+B×cos(2φ) as in [4]. Furthermore, simulations of DDE-MRS signals in isotropically oriented, infinite-length cylinders were achieved using the MISST toolbox for diffusion coefficients (Dfree) ranging from 0.1 to 0.5 µm²/ms and diameters (d) starting from 0.1 up to 5 µm [7-9], and compared to experimental data to estimate best parameter values (least square residuals). Errors on estimated parameters were calculated using a Monte Carlo procedure.Results & Discussion
Quality of DDE-MRS spectra: Amplitude modulation of spectra can be observed in Figure 1-A. NAA, Ins, taurine (Tau), total creatine (tCr), total choline (tCho), lactate (Lac) and MM were reliably quantified (CRLBs<5%) using LCModel [10] as shown in the spectral decomposition displayed in Figure 1-B. Note the very low s.d. that could be achieved in our experiments.
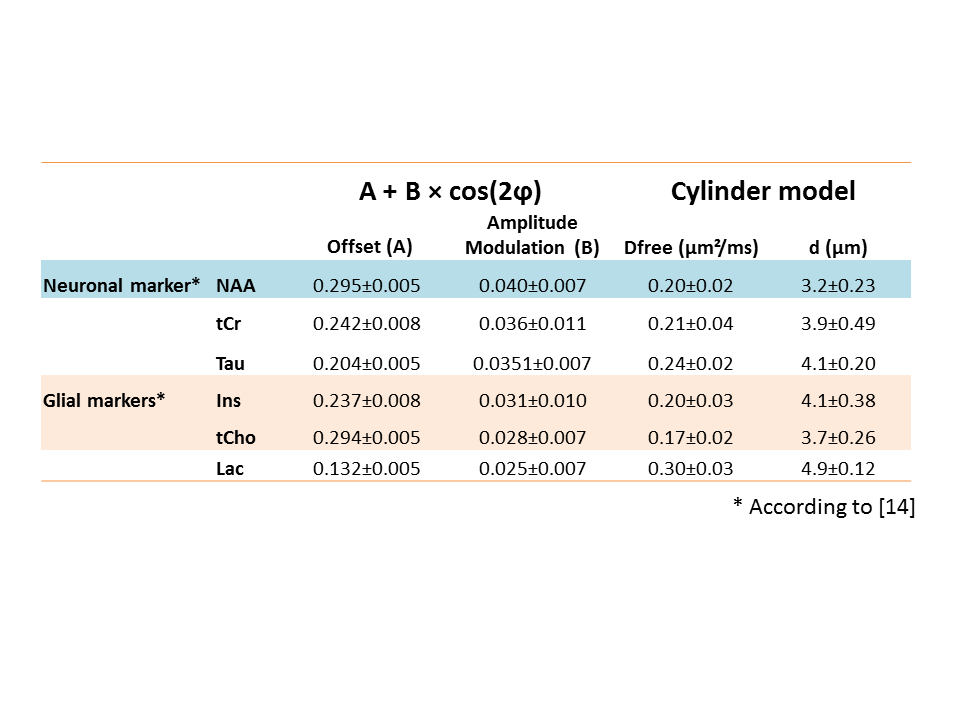
Sensitivity to cellular compartments: Figure 2 shows the fitting of experimental data for all metabolites while A and B coefficients are reported in Table 1. It can be seen that the amplitude modulation of the DDE-MRS signal -reflected here by B- is larger for NAA (neuronal metabolite) than for non-specific (tCr and Tau) or glial markers (tCho and Ins). This is consistent with the fact that neurons are expected to exhibit narrower fibers / larger CSA than glia [5, 11]. Interestingly, lactate exhibits stronger signal attenuation, which could be explained by the intrinsically fast diffusion of lactate (which is a small metabolite), but also by the contribution of a significant extracellular lactate pool with a rather "free-like" diffusion behavior [12]. In line with this idea, lactate exhibits less pronounced angular amplitude modulation than intracellular metabolites.
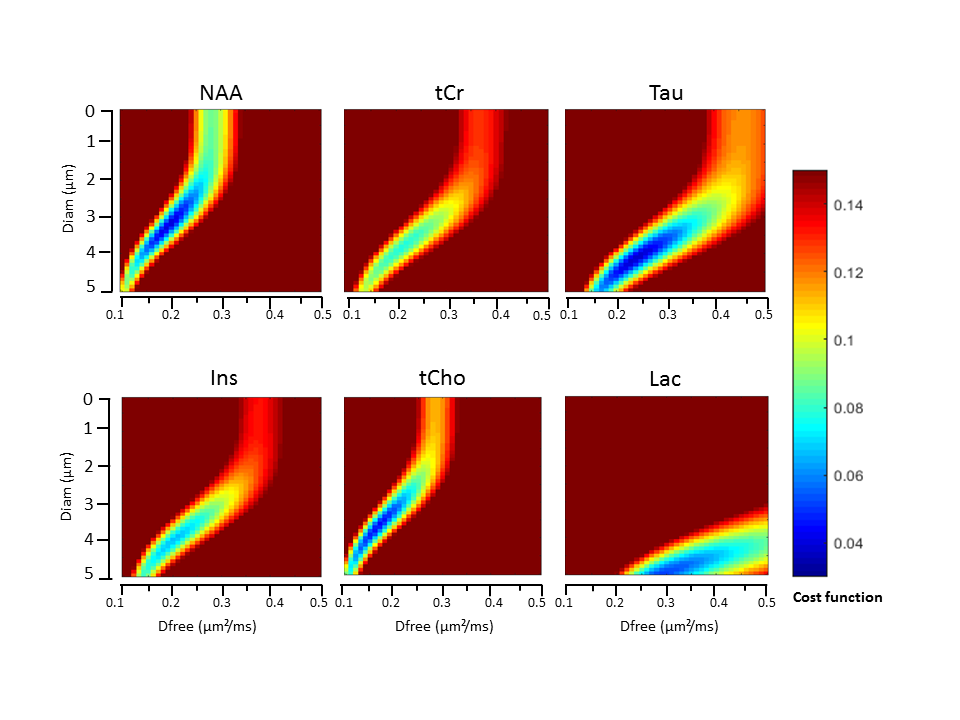
Estimating microstructure: Heatmaps based on least square residuals for each metabolite as compared to DDE-MRS simulations, as a function of Dfree and d, are presented in Figure 3. They show similar aspect for all metabolites except lactate. Diameters corresponding to the best fits are in the 3-5 µm range (Table 1), which is unrealistically large (for example, astrocytic processes are ~1-µm in diameter) [13], and Dfree is unusually low (~0.2 µm²/ms, while they are generally estimated to be 0.3-0.4 µm²/ms). One possible origin might be the contribution of cell bodies: for example, assuming that 20% of the signal originates from 10-µm diameter spherical cell bodies and 80% for 1-µm diameter fibers results in some angular dependency that is relatively close to experimental data (Figure 4-A). Another possible origin might be the long-range fiber structure (e.g. branching and finite length), as shown in Fig. 4-B presenting simulations in 1-µm diameter and 30-µm length cylinders (without spheres). Very interestingly, both configurations predict higher signal intensity at 180° than at 0/360°, especially when decreasing TM. We performed a new series of experiments at shorter TM, which appear to experimentally confirm this trend (Figure 4-C). This emphasizes the need to go beyond a simple picture of infinite-length cylinders.
Conclusion
DDE-MRS has the potential to qualitatively discriminate between cell-types and to assess cell microstructure, but further work is required to fully exploit this modality. As DDE-MRS requires relatively low gradient strength, it is a promising candidate for clinical applications.Acknowledgements
This work was funded by the European Research Council (INCELL project, grant agreement #336331).References
1. Mitra PP. Multiple wave-vector extensions of the NMR pulsed-field-gradient spin-echo diffusion measurement. Physical Review B. 1995;51(21):15074-8.
2. Ozarslan E, Basser PJ. Microscopic anisotropy revealed by NMR double pulsed field gradient experiments with arbitrary timing parameters. The Journal of chemical physics. 2008;128(15):154511. Epub 2008/04/25.
3. Ozarslan E. Compartment shape anisotropy (CSA) revealed by double pulsed field gradient MR. J Magn Reson. 2009;199(1):56-67. Epub 2009/04/29.
4. Shemesh N, Rosenberg JT, Dumez JN, Muniz JA, Grant SC, Frydman L. Metabolic properties in stroked rats revealed by relaxation-enhanced magnetic resonance spectroscopy at ultrahigh fields. Nature communications. 2014;5:4958. Epub 2014/09/18.
5. Shemesh N, Rosenberg JT, Dumez JN, Grant SC, Frydman L. Distinguishing neuronal from astrocytic subcellular microstructures using in vivo Double Diffusion Encoded 1H MRS at 21.1 T. PloS one. 2017;12(10):e0185232. Epub 2017/10/03.
6. Ligneul C, Palombo M, Valette J. Metabolite diffusion up to very high b in the mouse brain in vivo: Revisiting the potential correlation between relaxation and diffusion properties. Magnetic resonance in medicine. 2017;77(4):1390-8. Epub 2016/03/29.
7. Drobnjak I, Siow B, Alexander DC. Optimizing gradient waveforms for microstructure sensitivity in diffusion-weighted MR. J Magn Reson. 2010;206(1):41-51. Epub 2010/06/29.
8. Drobnjak I, Zhang H, Hall MG, Alexander DC. The matrix formalism for generalised gradients with time-varying orientation in diffusion NMR. J Magn Reson. 2011;210(1):151-7. Epub 2011/03/26. 9. Ianus A, Siow B, Drobnjak I, Zhang H, Alexander DC. Gaussian phase distribution approximations for oscillating gradient spin echo diffusion MRI. J Magn Reson. 2013;227:25-34. Epub 2012/12/25.
10. Provencher SW. Estimation of Metabolite Concentrations from Localized in Vivo Proton NMR Spectra. Magnetic Resonnance in Medicine. 1993;30:672-9.
11. Palombo M, Ligneul C, Valette J. Modeling diffusion of intracellular metabolites in the mouse brain up to very high diffusion-weighting: Diffusion in long fibers (almost) accounts for non-monoexponential attenuation. Magnetic resonance in medicine. 2017. Epub 2016/11/17.
12. Pfeuffer J, Tkáč I, Gruetter R. Extracellular-Intracellular Distribution of Glucose and Lactate in the Rat Brain Assessed Noninvasively by Diffusion-Weighted IH Nuclear Magnetic Resonance Spectroscopy In Vivo. Journal of Cerebral Blood Flow and Metabolism 2000;20(4):736-46.
13. Ligneul C, Hernández-Garzón E, Palombo M, Carrillo-de Sauvage M-A, Flament J, Hantraye P, et al. Diffusion-weighted magnetic resonance spectroscopy enables cell-specific monitoring of astrocyte reactivity in vivo. BioRxiv. 2018.
14. Choi JK, Dedeoglu A, Jenkins BG. Application of MRS to mouse models of neurodegenerative illness. NMR in biomedicine. 2007;20(3):216-37. Epub 2007/04/25.
Figures