1010
Deep learning 3D white matter fiber orientation from 2D histology: pulling 3D rabbits out of 2D hats1Vanderbilt University Institute of Imaging Science, Nashville, TN, United States, 2Electrical Engineering and Computer Science, Vanderbilt University, Nashville, TN, United States, 3Computer Science, Vanderbilt University, Nashville, TN, United States, 4Electrical Engineering, Vanderbilt University, Nashville, TN, United States, 5Biomedical Engineering, Vanderbilt University, Nashville, TN, United States, 6Vanderbilt University Institue of Imaging Science, Nashville, TN, United States
Synopsis
Most histological analysis of tissue microstructure is inherently 2D. In this work, we implement a deep learning approach to extract 3D microstructural measures from 2D microscopy images. Specifically, we train a neural network to estimate 3D fiber orientation distributions from myelin-stained micrographs. We apply this technique to an entirely unseen brain, which suggests the potential to use this methodology on consecutive 2D slices to investigate 3D structural connectivity using “myelin-stained-tractography” at resolutions much higher than possible with current diffusion MRI practices. There is potential to use similar techniques to estimate a number of 3D metrics from common 2D histological contrasts.
Introduction
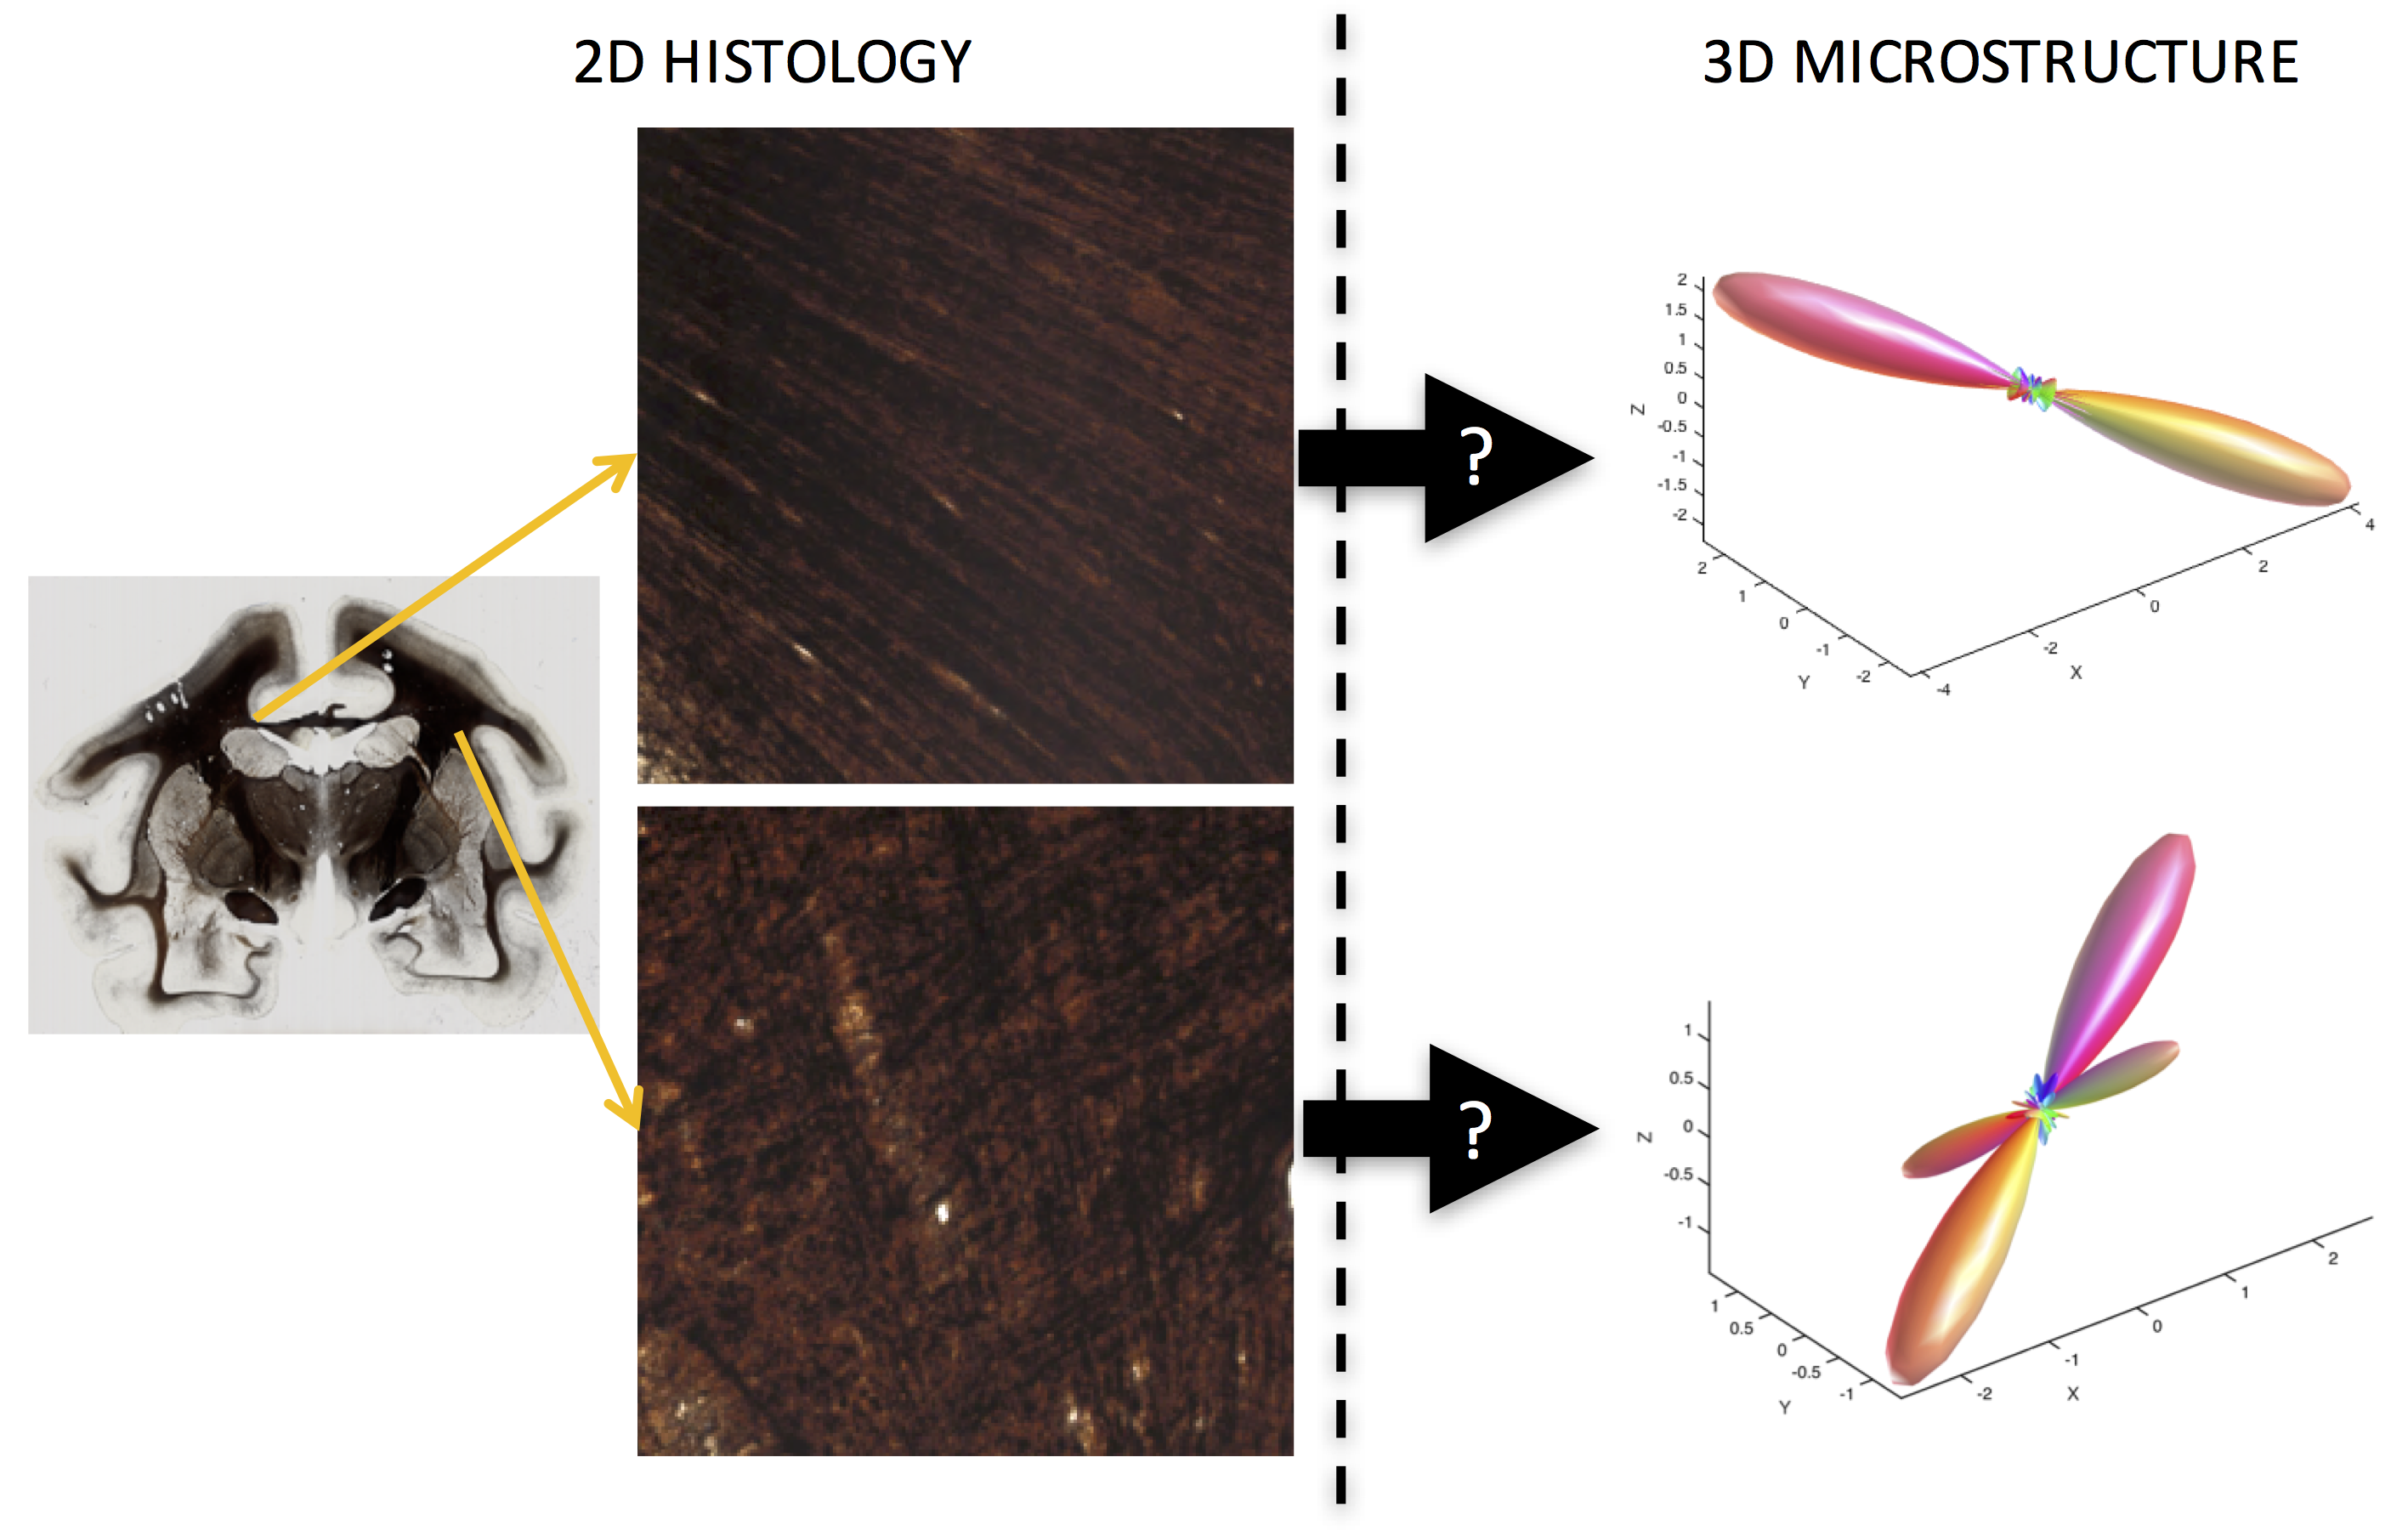
The gold standard for most measures of brain tissue microstructure, composition, pathology, and connectivity is typically histological analysis. For example, diffusion MRI validation of tractography and microstructure has been performed through comparisons against tracers [1, 2], against myelin or axons stains [3, 4], and against neuron stains [5]. However, these studies have been limited to 2-dimensional (2D) analysis of tissue sections with Brightfield microscopy. Very few studies have performed 3-dimensional validation due to limited time, fields-of-view, and costs associated with 3D acquisition and hardware. In contrast 2D light microscopy is inexpensive, can cover an entire tissue slice at high in-plane resolution, can be performed on dozens of sections of the brain, and can be stained with a number of contrasts to elucidate tissue microstructure. Thus, it would be of great interest to be able to learn 3D tissue structure from inherently 2D microscopy (Figure 1). In this study, we use ex vivo diffusion MRI of a squirrel monkey brain and corresponding myelin stained sections, in combination with a convolutional neural network (CNN) to learn the relationship between 3D diffusion estimated fiber orientation distributions (FOD) and the 2D myelin stain.Methods
Two ex vivo squirrel monkey brains were scanned, sectioned, and stained for this study. Diffusion MRI was performed (b=1000s/mm2, 300μm isotropic resolution, 32 directions) on a 9.4T scanner, and FODs reconstructed using spherical deconvolution. Each brain was cut serially on a microtome, stained with Gallyas silver stain, and imaged on a whole-slide Brightfield microscope at 0.5um/pixel. Histology and MRI were registered following the procedures utilized in [6]. Thus, the input to the CNN is a 256x256 pixels “patch” of the high-resolution myelin image and a corresponding diffusion FOD, represented using 6th order spherical harmonic (SH) coefficients as a 28x1 vector of coefficients – the CNN then aims to estimate the FOD from a given patch. For learning, we utilized a CNN architecture with four 2D convolutional layers (Figure 2) and a fully connected dense layer.
One monkey was used for training/validation and the other for testing. For training, 9 myelin-stained micrographs from the first monkey were utilized, resulting in 248,304 patches (and corresponding FODs). For validation, a 10th slice from the same monkey brain was used to compare diffusion FODs and predicted FODs using the angular correlation coefficient (ACC) which describes the overall agreement between spherical functions. For testing, and to evaluate generalizability to a new brain, the network was applied to two histological slices from the second monkey brain.
Results
Figure 3 shows the ACC results on the unseen validation slice from the same brain that training was performed on. The ACC is moderate to high in most white and gray matter regions, with a median value of 0.48 (for reference, a scan-rescan using spherical deconvolution has shown an ACC of 0.67 [7]). Comparisons of the true (diffusion MRI) FODs and predicted FODs show general agreement in shape and orientation, and importantly, the ability to predict through-plane orientation.
Figures 4 and 5 show slices from the withheld second squirrel monkey brain, where 3D FODs were predicted from myelin-data alone. The FODs generally match expected fiber orientations and show the ability to extract through-plane orientation information.
Discussion
In this study, we have used a CNN to estimate 3D fiber distributions from inherently 2D micrographs. We have shown that predicted FODs are in moderate to high agreement with FODs estimated using diffusion MRI, the network can predict through-plane orientations, and that it can be generalized to stains of different brains. This analysis and network structure could potentially be used to estimate other 3D tissue features from the large number of available 2D histological atlases and databases. For example, 3D estimates of cell and neuron diameters, lengths, orientations, undulations, and densities could be relevant for validating various MR contrasts.
One potential application of this methodology is for “myelin-stained” fiber tractography. Applying this network to a series of consecutive slices could be used to perform 3D tractography on brains that have not had a diffusion MRI scan. Future research should explore feasibility of myelin-tractography using existing open-source atlases [8]. Alternatively, this methodology could be generalized to human myelin stains, and used to reconstruct the 3D structural connections of the human brain at spatial resolutions surpassing those feasible with current state-of-the-art acquisitions (<500 um histological resolution versus 2.5mm diffusion MRI), possibly alleviating partial volume and crossing fiber effects.
Future improvements to increase accuracy should include using additional slices for training, as well as training using multiple monkeys to increase robustness to variation in staining intensities.
Acknowledgements
This work was supported by the National Institutes of Health under award numbers RO1NS058639, R01EB017230, and T32EB001628, and in part by ViSE/VICTR VR3029 and the National Center for Research Resources, Grant UL1 RR024975-01. We gratefully acknowledge the support of NVIDIA Corporation with the donation of the Titan Xp GPU used for this research.References
1. Gao Y, Choe AS, Stepniewska I, Li X, Avison MJ, Anderson AW. Validation of DTI tractography-based measures of primary motor area connectivity in the squirrel monkey brain. PloS one. 2013;8(10):e75065. Epub 2013/10/08. doi: 10.1371/journal.pone.0075065. PubMed PMID: 24098365; PubMed Central PMCID: PMC3788067.
2. Dyrby TB, Sogaard LV, Parker GJ, Alexander DC, Lind NM, Baare WF, et al. Validation of in vitro probabilistic tractography. NeuroImage. 2007;37(4):1267-77. doi: 10.1016/j.neuroimage.2007.06.022. PubMed PMID: 17706434.
3. Leergaard TB, White NS, de Crespigny A, Bolstad I, D'Arceuil H, Bjaalie JG, et al. Quantitative Histological Validation of Diffusion MRI Fiber Orientation Distributions in the Rat Brain. PloS one. 2010;5(1):e8595. doi: 10.1371/journal.pone.0008595.
4. Choe AS, Stepniewska I, Colvin DC, Ding Z, Anderson AW. Validation of diffusion tensor MRI in the central nervous system using light microscopy: quantitative comparison of fiber properties. NMR in biomedicine. 2012;25(7):900-8. doi: 10.1002/nbm.1810. PubMed PMID: 22246940.
5. Jespersen SN, Leigland LA, Cornea A, Kroenke CD. Determination of axonal and dendritic orientation distributions within the developing cerebral cortex by diffusion tensor imaging. IEEE transactions on medical imaging. 2012;31(1):16-32. doi: 10.1109/TMI.2011.2162099. PubMed PMID: 21768045; PubMed Central PMCID: PMCPMC3271123.
6. Choe AS, Gao Y, Li X, Compton KB, Stepniewska I, Anderson AW. Accuracy of image registration between MRI and light microscopy in the ex vivo brain. Magnetic resonance imaging. 2011;29(5):683-92. Epub 2011/05/07. doi: 10.1016/j.mri.2011.02.022. PubMed PMID: 21546191; PubMed Central PMCID: PMC3100355.
7. Vishwesh Nath KGS, Prasanna Parvathaneni, Colin B. Hansen, Allison E. Hainline, Camilo Bermudez, Samuel Remedios, Justin A. Blaber, Vaibhav Janve, Yurui Gao, Iwona Stepniewska, Baxter P. Rogers, Allen T. Newton, Taylor Davis, Jeff Luci, Adam W. Anderson, Bennett A. Landman, editor Inter-Scanner Harmonization of High Angular Resolution DW-MRI using Null Space Deep Learning. MICCAI-CDMRI; 2018; Granada, Spain.
8. Schilling KG, Gao Y, Christian M, Janve V, Stepniewska I, Landman BA, et al. A Web-Based Atlas Combining MRI and Histology of the Squirrel Monkey Brain. Neuroinformatics. 2018. doi: 10.1007/s12021-018-9391-z. PubMed PMID: 30006920.
Figures