1007
Joint RElaxation-Diffusion Imaging Moments (REDIM) to probe tissue microstructure1Harvard Medical School, Boston, MA, United States, 2Brigham and Women's Hospital, Boston, MA, United States, 3Boston Children's Hospital, Boston, MA, United States, 4Athinoula A. Martinos Center for Biomedical Imaging, Massachusetts General Hospital, Charlestown, MA, United States
Synopsis
The joint probability distribution of diffusivity and T2-relaxation coefficient provides useful information to characterize tissue microstructure. A standard approach for estimating this joint distribution relies on estimating the inverse Laplace transform from a large number of measurements which is not only infeasible in clinical settings but also numerically unstable. In this work, we introduce a novel approach, termed REDIM, to probe tissue microstructure using the statistical properties of a family of scaled distribution functions. In particular, we use specific functions to zoom into the joint probability function to robustly estimate different features of the underlying diffusion-relaxation processes. We show that this approach can be reliably implemented for use with in-vivo diffusion MRI (dMRI) data.
Introduction
Diffusion-relaxation correlation spectroscopy1,2 and other related techniques3,4,5,6 have been proposed to estimate the joint probability distribution of diffusivity and T2-relaxation coefficient by using diffusion magnetic resonance imaging (dMRI) data acquired at different echo time (TE). In this framework, the MRI signal is modeled by
$$s(t,b) = \int \exp(-rt-Db) \rho(r,D),$$
where $$$t, b$$$ denote the TE and b-value, $$$r$$$ represents the T2-relaxation coefficient, D denotes the scalar diffusivity and $$$\rho(r,D)$$$ represents the joint probability distribution function (PDF) of $$$r$$$ and $$$D$$$. A typical approach for estimating $$$\rho(r,D)$$$ is to solve the inverse Laplace transform using a large number of measurements acquired at different $$$b$$$ and $$$t$$$. However, this approach requires very long scan time and is ill-posed3,4,5. In this work, we propose a robust approach to probe heterogeneous tissue microstructural properties derived from the joint distribution $$$\rho(r,D)$$$.
Theory
Our approach is based on the statistical moments of a family of scaled joint PDFs. In particular, we consider a non-negative function $$$w(r,D)$$$ defined on the interval $$$\mathcal{X}= [0, D_{\max}]\times [0, r_{\max}]$$$ which represents the space of biologically meaningful diffusivity and relaxation coefficients. We let $$$\langle w(r,D) \rangle = \int w(r,D) \rho(r,D) dr dD$$$. Then we define the scaled $$$\rho_w(r,D)$$$ according to $$$w(r,D)$$$ as
$$\rho_w(r,D) = \frac{w(r,D)}{\langle w(r,D)\rangle} \rho(r,D).$$
Using a suitable weighting function $$$w(r,D)$$$, we can obtain more specific information about the tissue properties based on the scaled density $$$\rho_w(r,D)$$$. Moreover, we note that the moments of $$$\rho_w(r,D)$$$ have the following form
$$\langle r^m D^n\rangle_{\rho_w}= \int r^m D^n \rho_w(r,D) dr dD = \frac{\langle r^m D^n w(r,D) \rangle}{\langle w(r,D) \rangle},$$
which depends on the function $$$w(r,D)$$$.
We consider four types of linear scaling functions to zoom into different properties of the joint PDFs. Specifically, we define $$$w_{r,{\rm slow}}(r,D) = r_{\max} - r$$$ and $$$w_{r,{\rm fast}} = r$$$ to emphasize signal from tissue components with slow and fast relaxation coefficients, respectively. Similarly, we define $$$w_{D,{\rm slow}}(r,D) = D_{\max} - D$$$ and $$$w_{D,{\rm fast}} = D$$$ to emphasizes components with slow and fast diffusivity. A key point to note is that, we can compute the n-th order moments of the four types of scaled density functions using the first (n+1)-th order moments of $$$\rho(r,D)$$$. In this work, we compute the second-order moments of the scaled densities. To this end, we consider the third-order cumulant expansion of $$$s(t,b)$$$:
$$s(t,b)\approx s_0\exp(- \bar r t-\bar D b+\tfrac12 (\sigma_{20}t^2+2\sigma_{11}tb +\sigma_{02}b^2)-\tfrac16 ((\sigma_{30}t^2+3\sigma_{21}t^2b +3\sigma_{12}tb^2+\sigma_{03}b^3),$$
where $$$\bar r = \langle r \rangle$$$, $$$\bar D= \langle D \rangle $$$ and $$$\sigma_{mn} =\langle (r-\bar r)^m (D-\bar D)^n\rangle$$$ for $$$m+n \leq 3$$$. These moments can be estimated by fitting the above equation to the measured signal, i.e., $$$\log(s(t,b))$$$ using the least-squares algorithm. The estimated moments can be algebraically manipulated to obtain the desired moments of the scaled densities.
Methods
Data: Diffusion MRI data from a healthy volunteer was acquired on a 3T Siemens Prisma scanner with TE: 71, 101, 131, 161 and 191 ms, voxel size: $$$2.5 \times2.5 \times 2.5$$$ mm3, image dimension: $$$100\times 100 \times 54$$$. For each TE, dMRI images were acquired along 30 gradient directions at b = 700, 1400, 2100, 2800, 3500 $$${\rm s/mm^2}$$$ together with 6 volumes at b=0. An additional pair of b=0 images with AP, PA phase encoding directions were also acquired along with a MPRAGE T1-weighted image.
Processing: The b0 volumes were corrected for EPI distortion correction by applying FSL TOPUP on reversed phase encoding pairs. The rest of data was corrected for eddy current distortion, subject motion and EPI distortion with FSL TOPUP/eddy. The FreeSurfer map from MPRAGE were rigidly registered to the EPI-corrected b0 volume using the ANTS toolbox.
Results
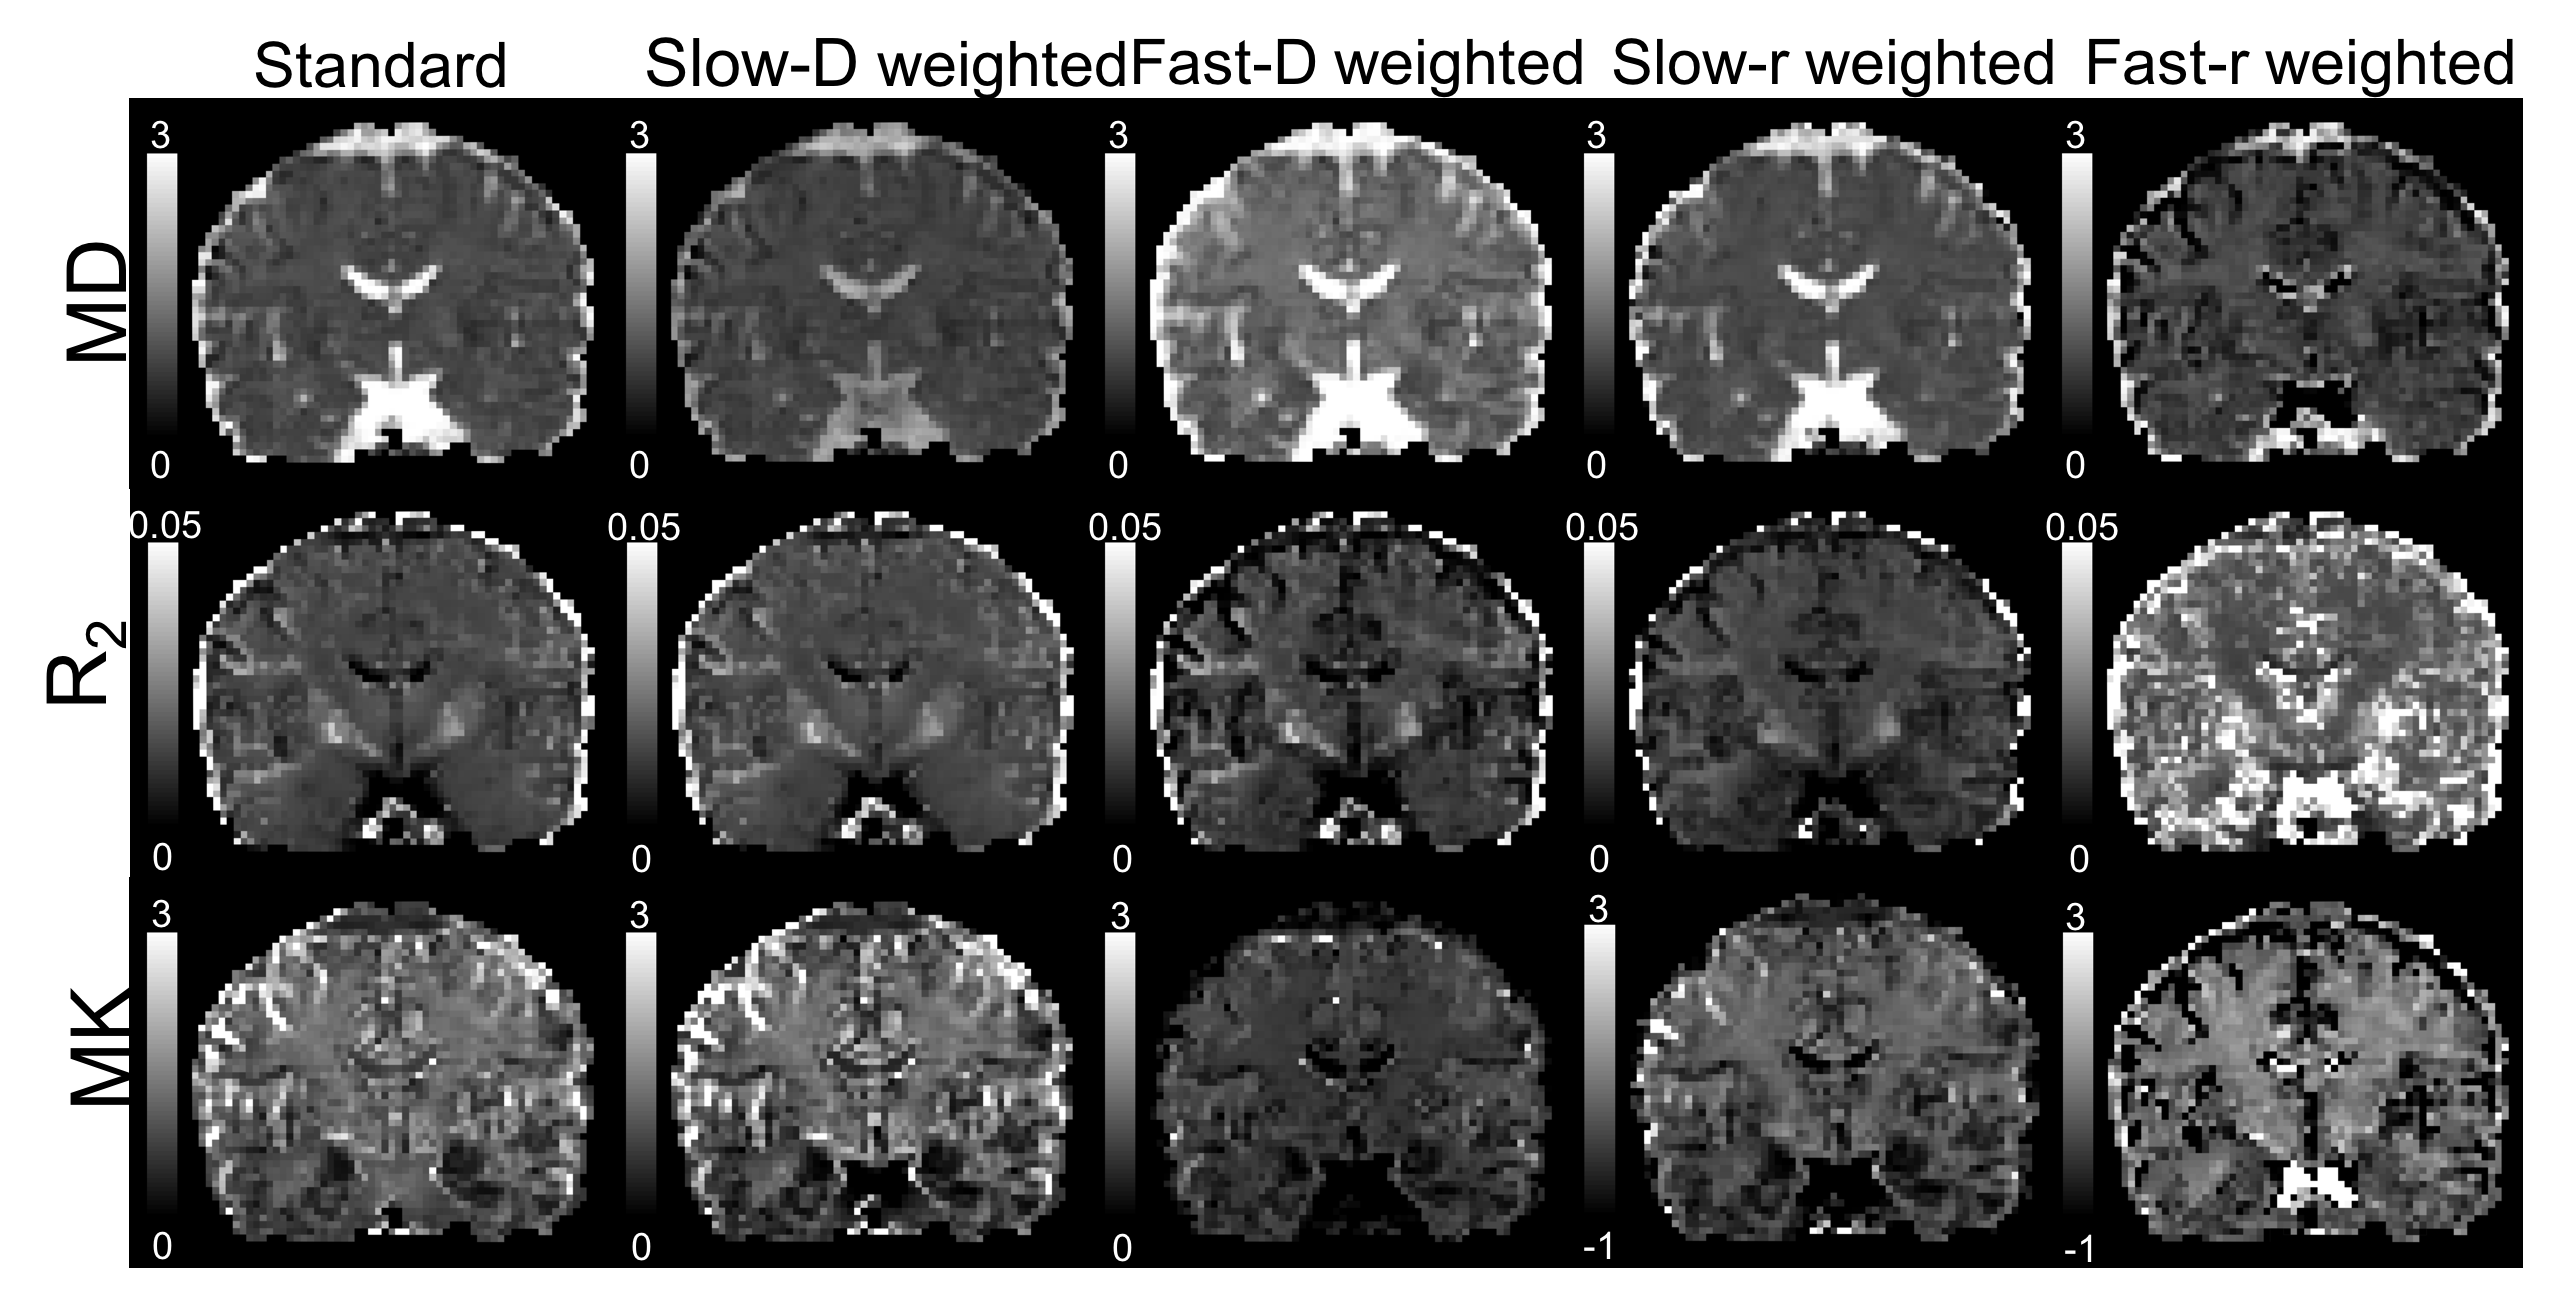
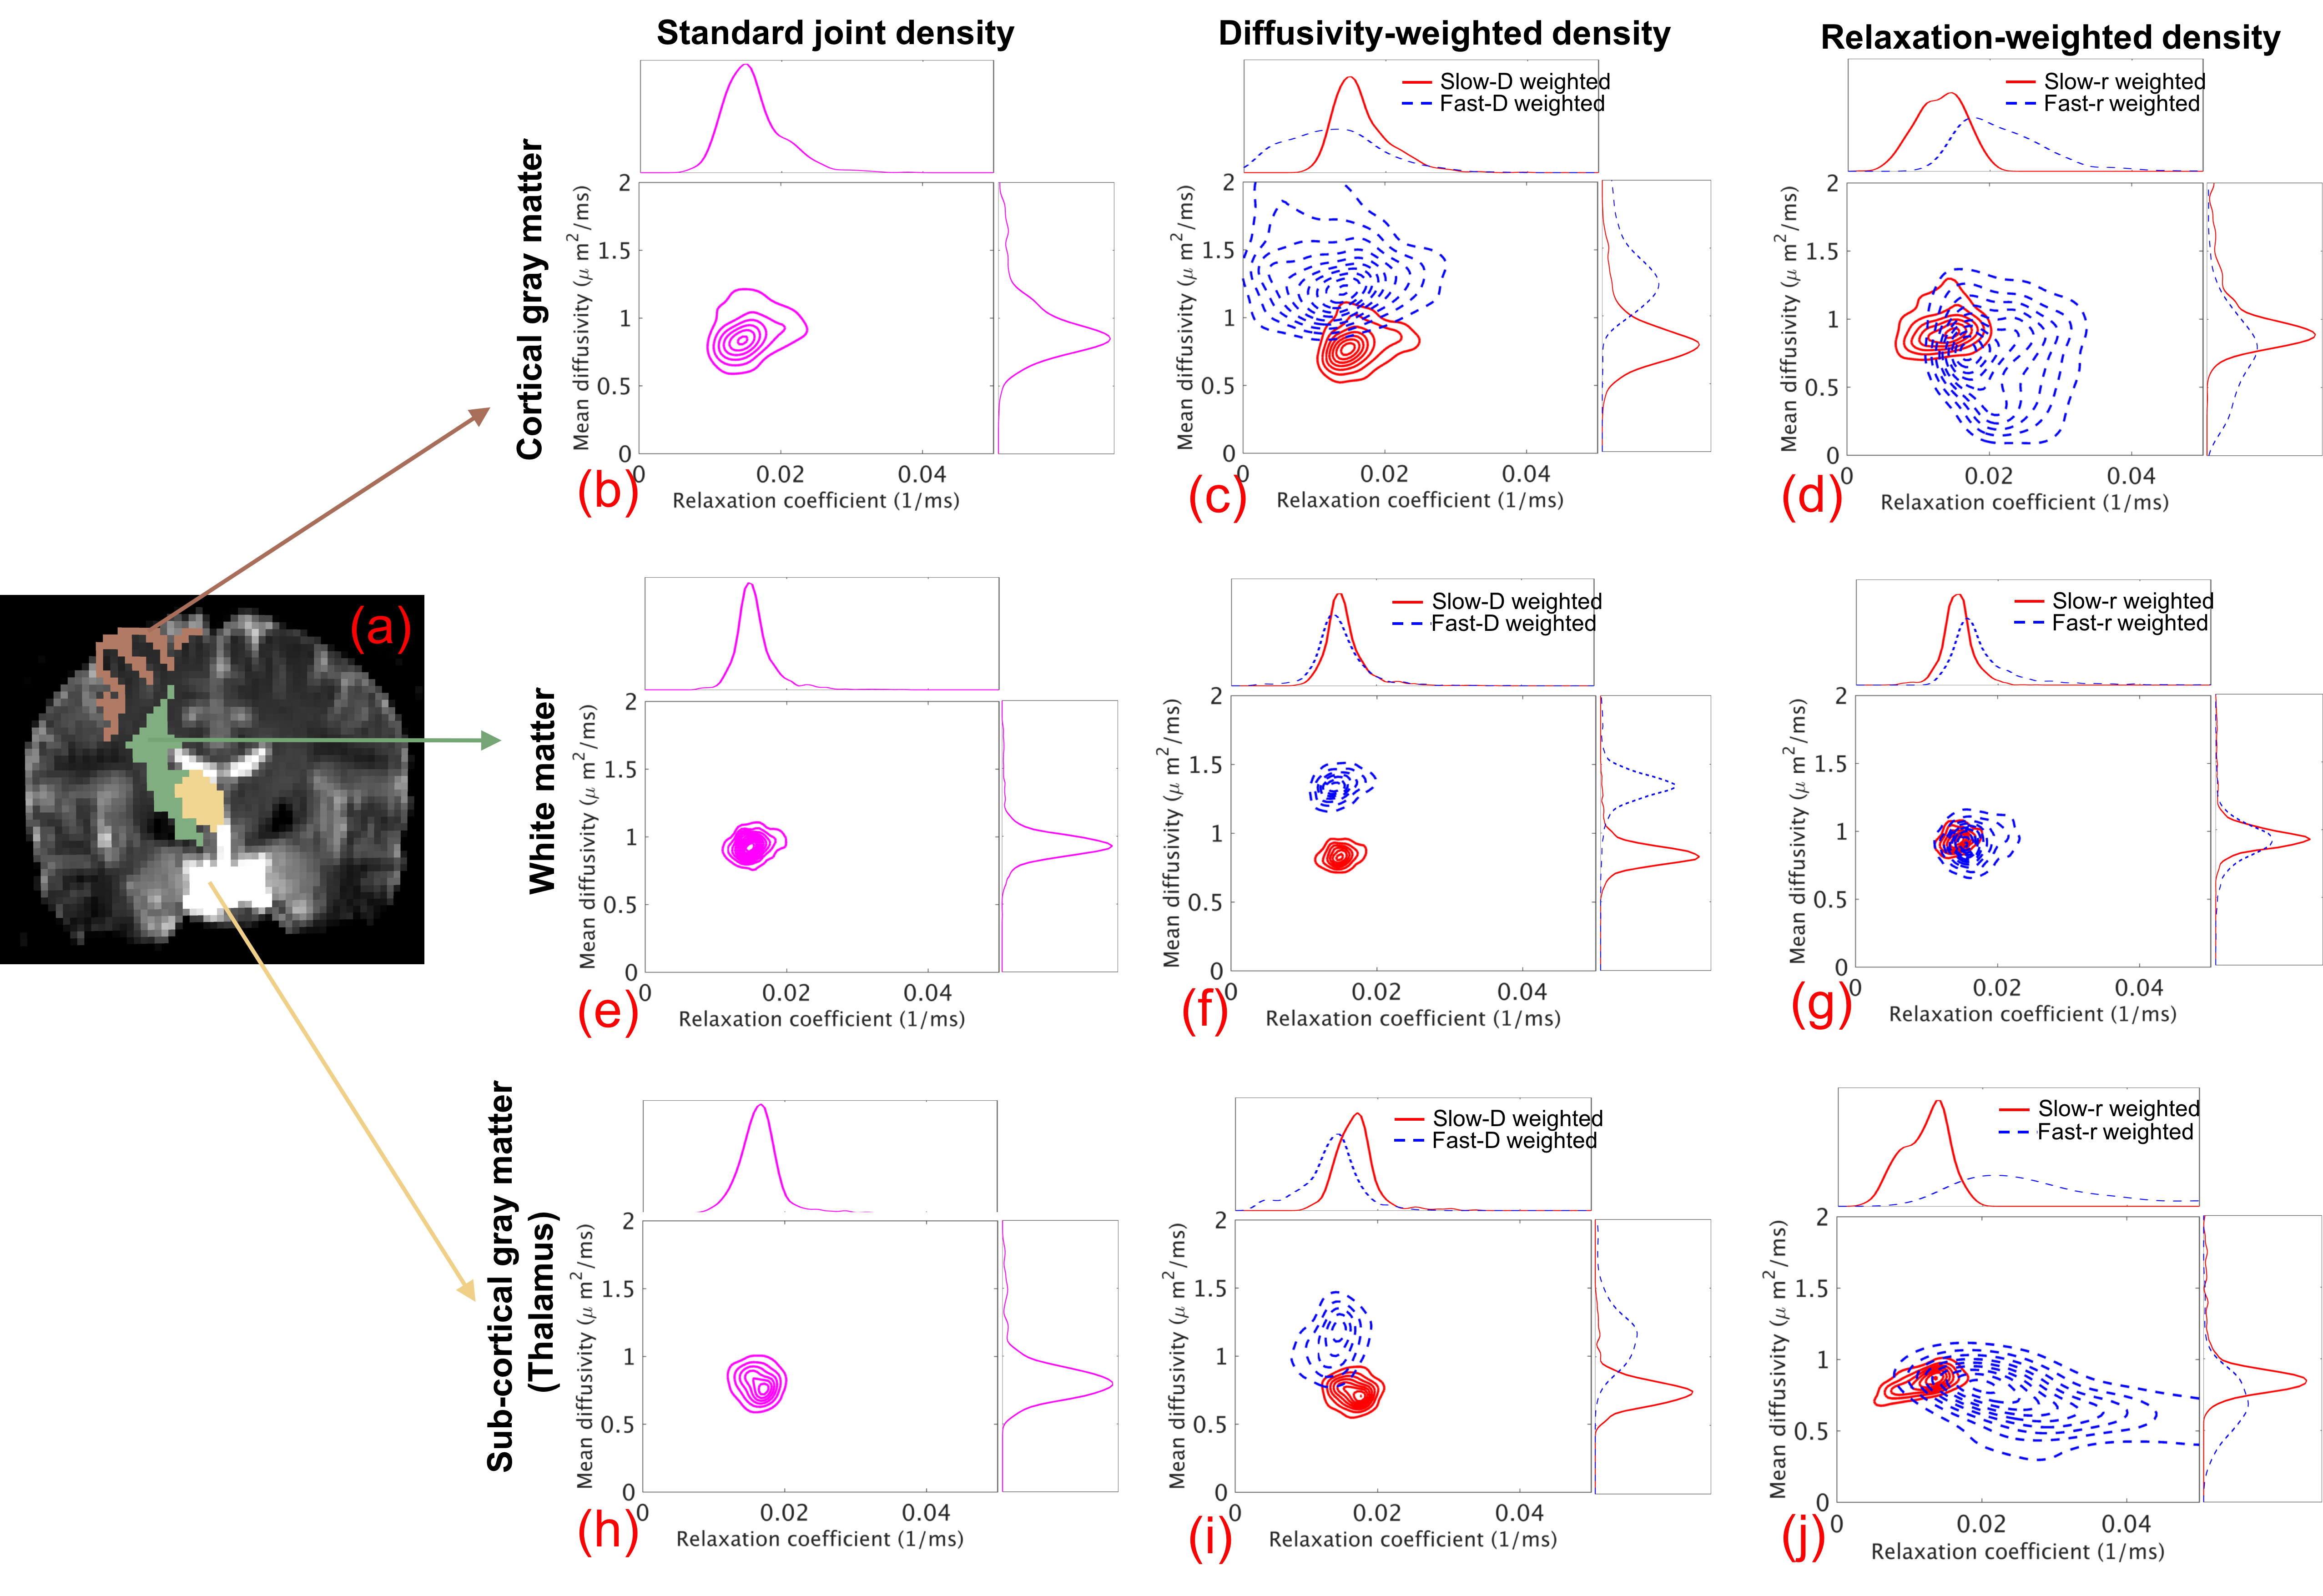
Figure 1 illustrates the MD, mean-relaxation (R2), MK measures corresponding to the standard PDF and the four types of zoomed PDFs. These images show different contrast in different brain regions. Figure 2 shows the contour plots of the the voxel-wise MD, R2 scatter density in three brain regions. We observe the existence of different relaxation components in cortical and sub-cortical gray matter with differences in diffusivity as well. Moreover, no difference in relaxation is seen in the white matter, although there exist both fast and slow diffusivity.Discussion and conclusion
We introduced an approach to characterize tissue microstructural heterogeneity using scaled multi-dimensional densities of MRI measures. Different from existing methods that focus on estimating the density functions, our method characterizes tissue microstructure using the lower order moments of the joint densities estimated using cumulant expansions. Experimental results show that our method can robustly estimate properties of the joint distributions, which is a key contribution of this work. This is the first time, such a detailed characterization of tissue properties has been possible using robust estimation of joint-density moments of diffusion-relaxation.Acknowledgements
This work is supported in part by NIH grants R21MH116352, R21MH115280 (PI: Ning), R01MH116173, R01MH097979, R01MH111917 (PI: Rathi), R01MH074794 (PI: Westin).References
[1] M. Hrlimann, L. Venkataramanan, Quantitative measurement of two- dimensional distribution functions of diffusion and relaxation in grossly in- homogeneous fields, Journal of Magnetic Resonance 157 (1) (2002) 31 – 42.
[2] P. Galvosas, P. T. Callaghan, Multi-dimensional inverse Laplace spec- troscopy in the NMR of porous media, Comptes Rendus Physique 11 (2) (2010) 172 – 180.
[3] R. Bai, A. Cloninger, W. Czaja, P. J. Basser, Efficient 2D MRI relaxometry using compressed sensing, Journal of Magnetic Resonance 255 (2015) 88 – 99.
[4] D. Benjamini, P. J. Basser, Use of marginal distributions constrained optimization (MADCO) for accelerated 2D MRI relaxometry and diffusometry, Journal of Magnetic Resonance 271 (2016) 40 – 45.
[5] D. Kim, E. K. Doyle, J. L. Wisnowski, J. H. Kim, J. P. Haldar, Diffusion- relaxation correlation spectroscopic imaging: A multidimensional approach for probing microstructure, Magnetic Resonance in Medicine 78 (6) (2017) 2236–2249.
[6] J. Veraart, D.S. Novikov, E. Fieremans, TE dependent Diffusion Imaging (TEdDI) distinguishes between compartmental T2 relaxation times, NeuroImage 182 (2018) 360–369.
Figures