1006
Exploring diffusion properties in neocortical grey matter using inversion recovery diffusion weighted imaging1Neurophysics, Max Planck Institute for Human cognitive and Brain Sciences, Leipzig, Germany, 2International Max Planck Research School on Neuroscience of Communication: Function, Structure, and Plasticity, Leipzig, Germany, 3Medical Center, Faculty of Medicine, University Freiburg, Freiburg, Germany, 4Department of Medical Physics, University Freiburg, Freiburg, Germany, 5Felix Bloch Institute for Solid State Physics, Faculty of Physics and Earth Sciences, Leipzig University, Leipzig, Germany
Synopsis
We measured inversion recovery prepared diffusion signal for grey matter. We found that the mean diffusivity (MD) in grey matter drops significantly for TIs higher than the nulling TI. MD in GM dropped from around 0.8×10⁻³ mm2/s before the null point to around 0.6×10⁻³ mm2/s immediately after the null point. Our findings suggest that the neocortical gray matter could be characterized using a two dimensional T1-diffusion correlation measurement.
Introduction
On a microscopic scale, brain cortical grey matter (GM) is organised into cells and fibres with distinct diffusion and MR relaxation properties. Most MR contrast mechanisms are closely related to myelination 1 -- the myelinated axons lodged in the GM are of particular interest. As myelin macromolecules act as relaxation sinks 2, it is plausible that the spin lattice relaxation time, T1, is different between the myelin proximal water (near myelinated axons) and the myelin non-proximal water in dendrites, cell bodies, etc. Then, an inversion recovery (IR) preparation with a specific inversion time (TI) can selectively suppress one compartment and allow studying other.
To explore diffusion in the cortex, we measured IR prepared diffusion weighted imaging (IR-DWI) 3,4 with a range of TIs and measured the diffusion tensor (DT) at each TI.
Methods
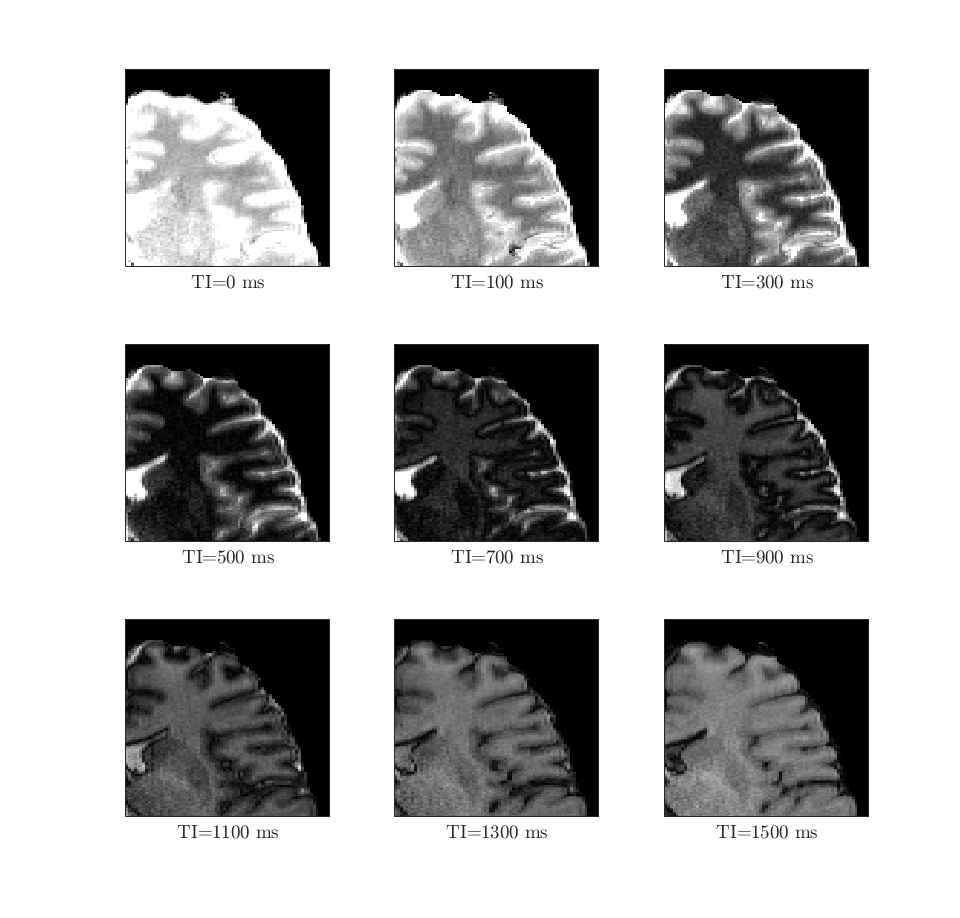
IR-DWI of a single subject were acquired on a 3T Connectom scanner (Siemens Healthineers, Erlangen, Germany, 300mT/m gradient amplitude) with 32-channel RF head coil. IR-DWI was performed with TI varying between 100-1700 ms in steps of 200 ms (Figure 1). The imaging parameters were: resolution (1.0 × 1.0 × 3.0 mm3), diffusion weighting 500 and 1300 s/mm2, 60 directions and one b=0 image, TE/TR 64 ms/5000 ms, GRAPPA factor 2, partial Fourier factor 6/8, 164 acquired phase encoding lines, acquisition matrix 220×220 and 12 interleaved slices. A reference DWI measurement with no inversion pulse was also acquired.
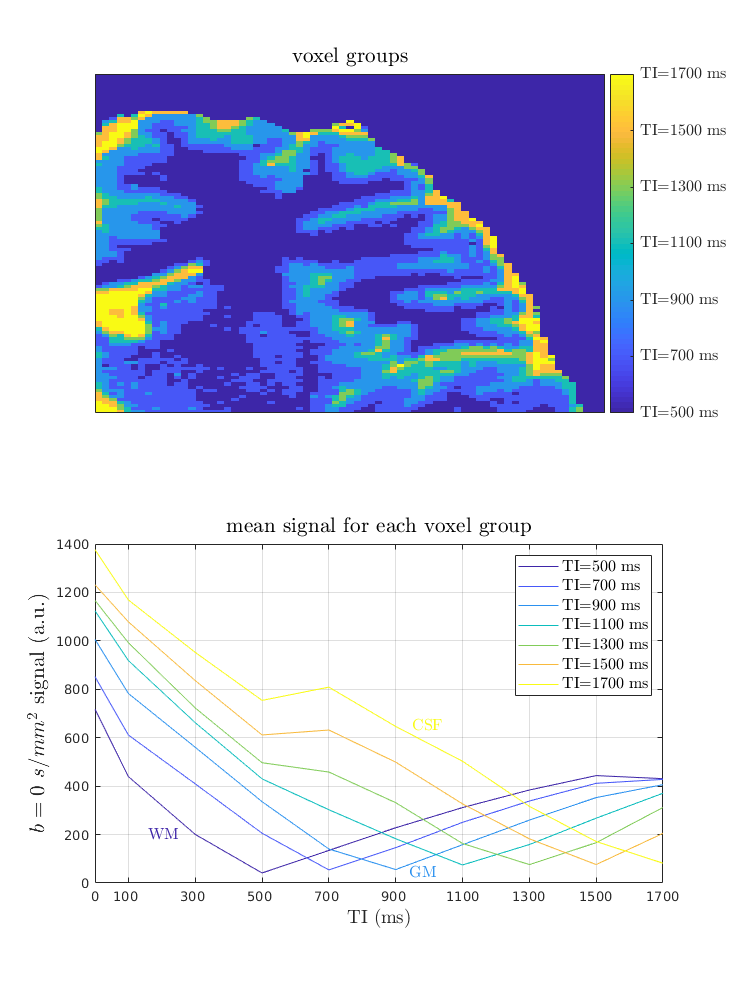
Image motion and eddy current-induced distortions were corrected using FSL eddy 5. For each TI, DT, fractional anisotropy (FA) and mean diffusivity (MD) were computed using MRtrix software. Partial volume effects (PVE) with cerebrospinal fluid (CSF) were minimised by computing the DT using only b=500 and 1300 s/mm2 images. The b=0 s/mm2 images were used as voxel-based proxy T1 - each voxel was binned based on the TI where the b=0 s/mm2 signal was minimal.
Results and Discussion
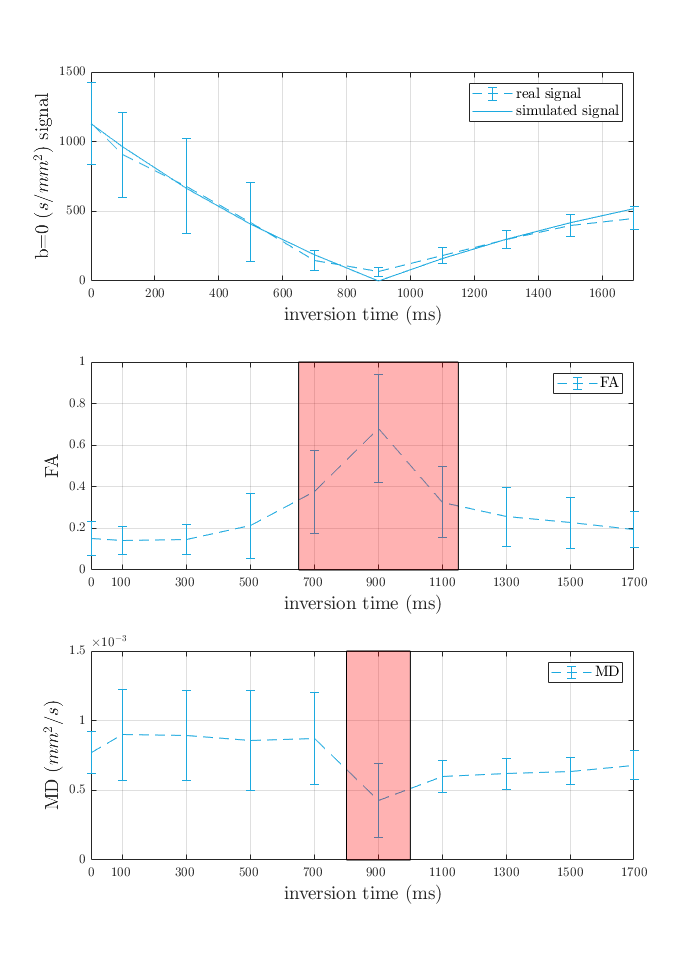
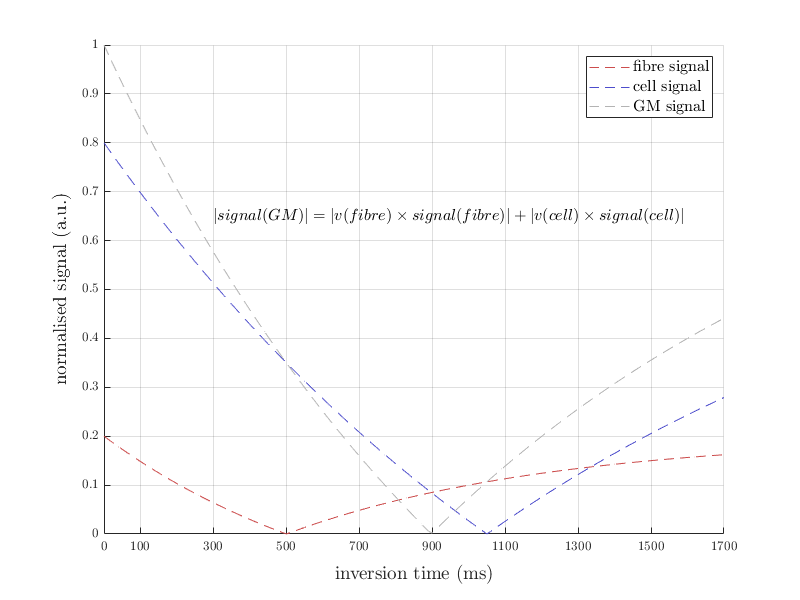
We found that diffusion properties in GM are TI dependent. Compared to baseline (DT without inversion preparation), MD showed a small increase at low TIs, however, this increase was reversed immediately for TIs higher than the nulling TI. The MD in these GM voxels dropped from around 0.8×10⁻³ mm2/s before the null point to around 0.6×10⁻³ mm2/s immediately after the null point (Figure 3). Mean MD observations in GM together with the proposed long T1 of the myelin non-proximal water compartment suggest that at short TI MD likely reflects the contributions of this compartment relatively more than the myelin-proximal water and myelinated fibres (Figure 4).
Our results may be affected by PVE due to CSF adjacent to the cortex. CSF has very long T1 and is suppressed at very long TI (Figure 2). However, this was mitigated by computing diffusion metrics using only b-values greater than 300 s/mm². CSF, with diffusivity around 3×10⁻³ mm²/s, would lose around one-third of its initial signal contribution at b= 300 s/mm².
Separating contributions from adjacent cortical layers would require sub-millimetre resolution. However, when signal from the myelin non-proximal water compartment is suppressed, the residual GM signal arising from the fibres is also quite low. The low SNR may have influenced the DT estimates in this study and would worsen the diffusion tensor estimates at even higher spatial resolution (Figure 4). Along with MD, small differences in FA occurred with different TI times.
Conclusion
Altered diffusion properties were observed with TI, featuring increased FA and notably decreased MD estimates that approach WM values at long TI. FA is a proxy measure for the orientation coherence of fibres in a voxel. However, GM contains radial long-range fibres as well as short-range cortico-cortical and intracortical fibres, all of which could be myelinated. This is probably why the change in FA at different TI is not as profound as those of MD. We note that filtering tissue compartments with an inversion recovery preparation could bundle the signal contribution of all other neurites including non-myelinated axons as well as glial processes and dendrites together with the cell bodies. However, they could also form a significant fraction of the GM and perhaps behave more like axons in their diffusion properties, therefore, the present results should not be taken as representing all neurites 6.
Effects of PVE at a lower imaging resolution and of low SNR at higher resolution on the estimation of GM diffusion properties need to be addressed in future studies to avoid potential bias. Application of formal compartment models would further help characterizing the contribution of cell and fibre structures to GM diffusion properties 7.
Acknowledgements
No acknowledgement found.References
1. Marques, J. P., Khabipova, D. and Gruetter, R. (2017) ‘Studying cyto and myeloarchitecture of the human cortex at ultra-high field with quantitative imaging: R1, R2* and magnetic susceptibility’,NeuroImage. Elsevier, 147(May 2016), pp. 152–163. doi: 10.1016/j.neuroimage.2016.12.009.
2.Koenig, S. H., Brown, R. D., Spiller, M., & Lundbom, N. (1990). Relaxometry of brain: Why white matter appears bright in MRI. Magnetic Resonance in Medicine, 14, 482–495.
3. De Santis, S., Barazany, D., Jones, D. K. and Assaf, Y. (2016) ‘Resolving relaxometry and diffusion properties within the same voxel in the presence of crossing fibres by combining inversion recovery and diffusion-weighted acquisitions’, Magnetic Resonance in Medicine, 75(1), pp. 372–380. doi: 10.1002/mrm.25644.
4.Andersson, J. L. R. and Sotiropoulos, S. N. (2016) ‘An integrated approach to correction for off-resonance effects and subject movement in diffusion MR imaging’, NeuroImage. Academic Press, 125, pp. 1063–1078.
5.Andersson, J. L. R. and Sotiropoulos, S. N. (2016) ‘An integrated approach to correction for off-resonance effects and subject movement in diffusion MR imaging’, NeuroImage. Academic Press, 125, pp. 1063–1078.
6. Hansen, M. B., Jespersen, S. N., Leigland, L. A. and Kroenke, C. D. (2013) ‘Using diffusion anisotropy to characterize neuronal morphology in gray matter: the orientation distribution of axons and dendrites in the NeuroMorpho.org database’, Frontiers in Integrative Neuroscience, 7(May), pp. 1–13. doi: 10.3389/fnint.2013.00031.
7. Truong, T. K., Guidon, A. and Song, A. W. (2014) ‘Cortical depth dependence of the diffusion anisotropy in the human cortical gray matter in vivo’, PLoS ONE, 9(3). doi: 10.1371/journal.pone.0091424.
8. Lifshits, S., Tomer, O., Shamir, I., Barazany, D., Tsarfaty, G., Rosset, S. and Assaf, Y. (2018) ‘Resolution considerations in imaging of the cortical layers’, NeuroImage. Academic Press, 164, pp. 112–120. doi: 10.1016/J.NEUROIMAGE.2017.02.086.
Figures