1005
The relationship between diffusion MRI-derived axon diameters and conduction velocities in human peripheral nerves1National Institute of Biomedical Imaging and Bioengineering, National Institutes of Health, Bethesda, MD, United States, 2National Institute of Neurological Disorders and Stroke, National Institutes of Health, Bethesda, MD, United States, 3National Institute of Child Health and Human Development, National Institutes of Health, Bethesda, MD, United States, 4Biomedical Engineering, University of Arizona, Tucson, AZ, United States, 5Clinical Center, National Institutes of Health, Bethesda, MD, United States, 6Center for Information Technology, National Institutes of Health, Bethesda, MD, United States, 7National Institute of Mental Health, National Institutes of Health, Bethesda, MD, United States
Synopsis
From diffusion-weighted MRIs with large
Introduction
Diffusion MRI is uniquely suited to characterize the microstructure of anisotropic tissues1 such as white matter or peripheral nerves non-invasively. Within the well-defined geometry of myelinated axons, which can be modeled as tightly-packed, infinitely-long, parallel cylinders with impermeable boundaries, water molecules undergo restricted diffusion generating an MR signal with a distinctive signature compared the signal from extra-axonal water undergoing free or hindered diffusion. By analyzing diffusion MRIs using a tissue model of restricted and hindered diffusion2 it is possible to estimate useful features myelinated axons3, such as the average axon diameter (AAD). AADs could provide important clinical and pathological information in neurodegenerative diseases and could reflect functional properties (i.e., propagation speeds) in healthy nerve fibers, but they can only be measured invasively and with limited coverage using biopsies.
Despite numerous validation experiments of diffusion MRI-based AAD measurements in well-calibrated phantoms4 and fixed spinal cord tissues5, validation in human volunteers has been challenging6,7. Given the invasiveness and limited coverage of histological sampling, an alternative approach is to correlate AAD estimates with directly measured conduction velocities8. Classical work in electrophysiology has established a linear relationship between the axon diameters of myelinated axons and their conduction speeds9-11. Preliminary validation attempts using EEG-derived conduction velocities in the brain show promising results but call for better-controlled experiments8.
We estimate AADs in the ulnar and median nerves of healthy volunteers by analyzing diffusion MRIs using a tissue model of restricted and hindered diffusion6 and describing the signals with the multiple correlation function (MCF) framework12. We quantify the variation of AADs along these nerves and compare them to average conduction velocity (ACV) estimates derived from electrophysiology using the classical Hopf collision method13
Methods
We scanned five volunteers using a flexible RF surface coil tightly wrapped around the right forearm. The arm was positioned in a plane perpendicular to the [1 1 1] direction in scanner coordinates (Fig. 1) to maximize the effective diffusion gradient component that can be applied perpendicular to the nerve fiber orientation14. Cross-sectional diffusion-weighted images (DWIs) of the arm were acquired at 4 locations using spin-echo diffusion EPI with b-values ranging from 0-10,000 s/mm2 and diffusion-encoding gradients applied along multiple orientations. The maximum gradient strength was 79.5 mT/m/axis, while the diffusion gradient pulse durations and separations were 20 ms and 26 ms, respectively. Other imaging parameters were 5 mm slice thickness, 2.5 mm in-plane resolution, 160 mm field-of-view, and TE/TR=81/4000 ms. A 1mm T1-weighted structural scan and a 2.5 mm isotropic DTI scan were also acquired in the same session.
After post-processing15, the signals in voxels containing the median and ulnar nerves were analyzed with a tissue model of restricted and hindered diffusion:
$$E\left(d,f_{ax},D_{ax},D_{ex,\perp}\right)=\left(1-f_{ax}\right)e^{-\mathbf{R}\begin{bmatrix}D_{ex,\perp} & 0 & 0 \\0 & D_{ex,\perp} & 0\\ 0 & 0 & D_{ex,\parallel}\end{bmatrix}\mathbf{R}}+f_{ax}\Theta\left( d, D_{ax}\right)$$
The intra-axonal signal, $$$\Theta\left( d, D_{ax}\right)$$$, was described numerically using the MCF framework12. The additional model parameters $$$f_{ax}$$$, $$$D_{ax}$$$, and $$$D_{ex,\perp}$$$, are the intra-axonal signal fraction, intra-axonal diffusivity, and radial diffusivity of the extra-axonal signal which was modeled using a cylindrically symmetric diffusion tensor with the principal orientation given by the rotation matrix $$$\mathbf{R}$$$, derived using DTI obtained from the low-b signals. The variation of these parameters was quantified along the nerves and across subjects. AADs in the ulnar nerves were compared to average conduction velocities (ACVs) measured using the Hopf collision method in separate experiments.
Results and Discussion
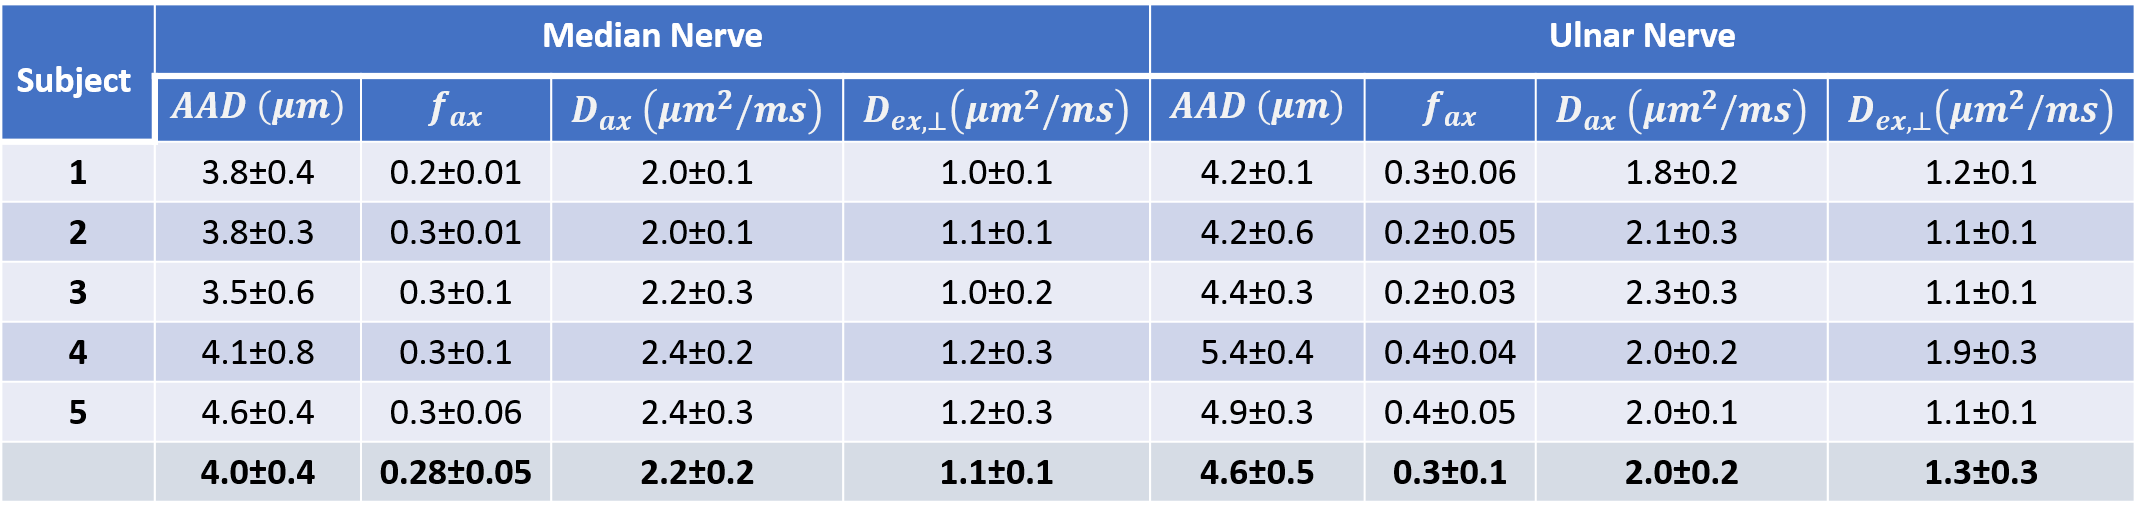
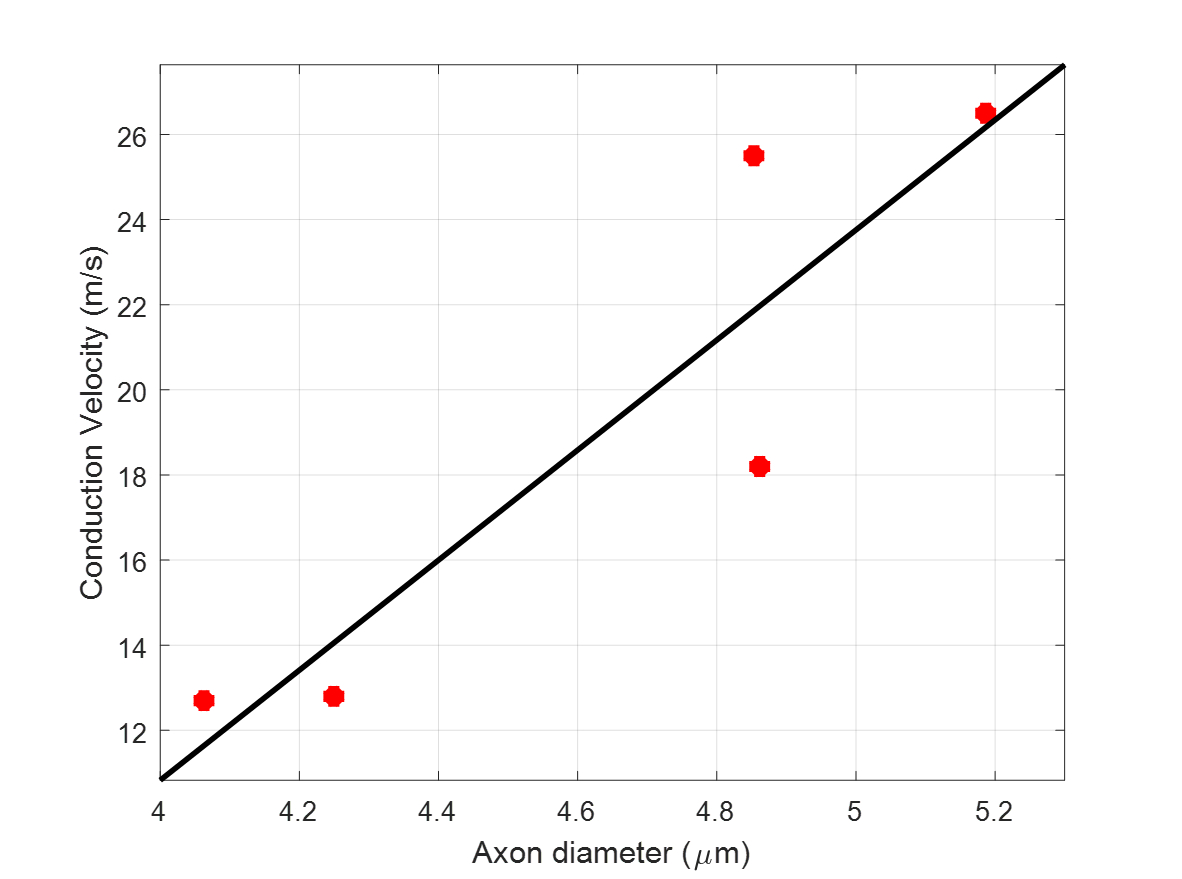
For most subjects the nerve orientations were within 10° of the [1 1 1] direction, yielding good diffusion sensitization transverse to the axonal fiber direction. The ranges of tissue model parameters across multiple subjects (Table 1) were consistent with previous in vivo findings6. Larger AADs were estimated in the ulnar nerves compared to the median nerves. AAD variations along the nerves were not negligible and may be due to nerve branching and to differences in voxel composition (partial volume). Among all model parameters, $$$f_{ax}$$$ showed the largest inter-subject variability. Conduction velocity distributions (CVDs) measured using the classical Hopf collision technique in the ulnar nerves showed relatively large variability across subjects. Nevertheless, ACVs derived from CVDs were compared to the diffusion-MRI derived AADs using linear regression analysis (Fig. 3) and a slope of 12.9 m/s/µm was obtained (R2=0.82), consistent with results in the classical electrophysiology literature9-11.
Discrepancies between electrophysiology and diffusion MRI experiments may be due to:
- Measuring signals from different subpopulations of nerve fibers
- Inter-subject variations in the linear dependence (due to differences in myelination, internodal distances, etc.),
- Temperature-dependence of electrical conduction in nerves.
- Differences in relative orientations of the peripheral nerves.
Conclusion
Our preliminary results support the linear relationships between action potential propagation speed and axon diameters in myelinated fibers and suggest the possibility of inferring inter-cortical latencies from whole-brain diffusion MRIs7,16.Acknowledgements
This work was supported by NIH BRAIN Initiative grant R24-MH-109068-01 and the Intramural Research Programs (IRP) of the National Institute of Biomedical Imaging and Bioengineering (NIBIB), the Eunice Kennedy Shriver National Institute of Child Health and Human Development (NICHD), and the National Institute of Neurological Disorders and Stroke (NINDS).
References
1 Basser, P. J., Mattiello, J. & LeBihan, D. MR diffusion tensor spectroscopy and imaging. Biophys J 66, 259-267 (1994).
2 Assaf, Y. & Basser, P. J. Composite hindered and restricted model of diffusion (CHARMED) MR imaging of the human brain. Neuroimage 27, 48-58 (2005).
3 Assaf, Y., Blumenfeld-Katzir, T., Yovel, Y. & Basser, P. J. AxCaliber: a method for measuring axon diameter distribution from diffusion MRI. Magn Reson Med 59, 1347-1354 (2008).
4 Komlosh, M. E. et al. Pore diameter mapping using double pulsed-field gradient MRI and its validation using a novel glass capillary array phantom. J Magn Reson 208, 128-135 (2011).
5 Komlosh, M. E. et al. Mapping average axon diameters in porcine spinal cord white matter and rat corpus callosum using d-PFG MRI. Neuroimage (2013).
6 Avram, A. V., Ozarslan, E., Sarlls, J. E. & Basser, P. J. In vivo detection of microscopic anisotropy using quadruple pulsed-field gradient (qPFG) diffusion MRI on a clinical scanner. Neuroimage 64, 229-239 (2013).
7 Avram, A. V. & Basser, P. Inferring Millisecond-Scale Functional Connectivity from Tissue Microstructure. Proceedings of the ISMRM 22, 3001 (2014).
8 Horowitz, A. et al. In vivo correlation between axon diameter and conduction velocity in the human brain. Brain Structure and Function 220, 1777-1788 (2015).
9 Rushton, W. A. A theory of the effects of fiber size in medullated nerve. The Journal of Physiology 115, 101-122 (1951).
10 Waxman, S. & Bennett, M. Relative conduction velocities of small myelinated and non-myelinated fibers in the central nervous system. Nature New Biology 238, 217 (1972).
11 Tasaki, I., Ishii, K.-i. & Ito, H. On the relation between the conduction rate, the fiber diameter, and the internodal distance of medullated nerve fibers. Jpn. J. Med. Sci. 39, 189-200 (1943).
12 Ozarslan, E., Shemesh, N. & Basser, P. J. A general framework to quantify the effect of restricted diffusion on the NMR signal with applications to double pulsed field gradient NMR experiments. J Chem Phys 130, 104702 (2009).
13 Hopf, H. C. Electromyographic Study on So-Called Mononeuritis. Arch Neurol 9, 307-312 (1963).
14 Conturo, T. E., McKinstry, R. C., Akbudak, E. & Robinson, B. H. Encoding of anisotropic diffusion with tetrahedral gradients: a general mathematical diffusion formalism and experimental results. Magnetic Resonance in Medicine 35, 399-412 (1996).
15 Pierpaoli, C. et al. TORTOISE: an integrated software package for processing of diffusion MRI data. Proceedings of the ISMRM, 1597 (2010).
16 Pajevic, S., Basser, P. J. & Fields, R. D. Role of myelin plasticity in oscillations and synchrony of neuronal activity. Neuroscience 276, 135-147 (2014).
Figures
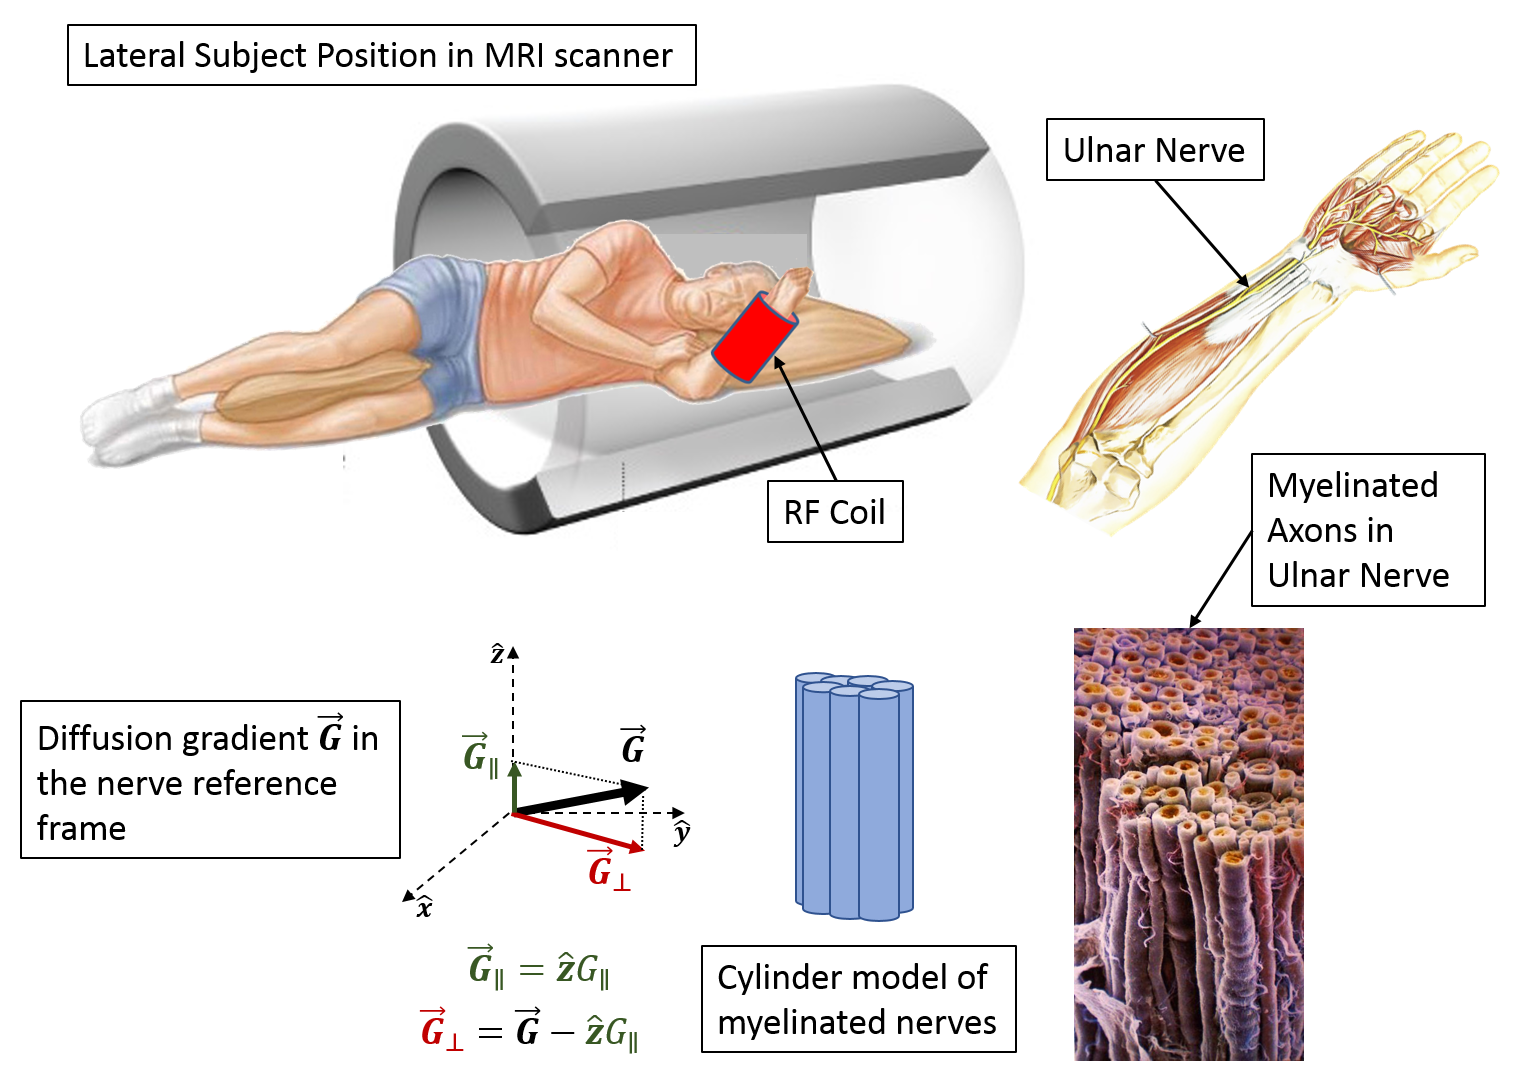
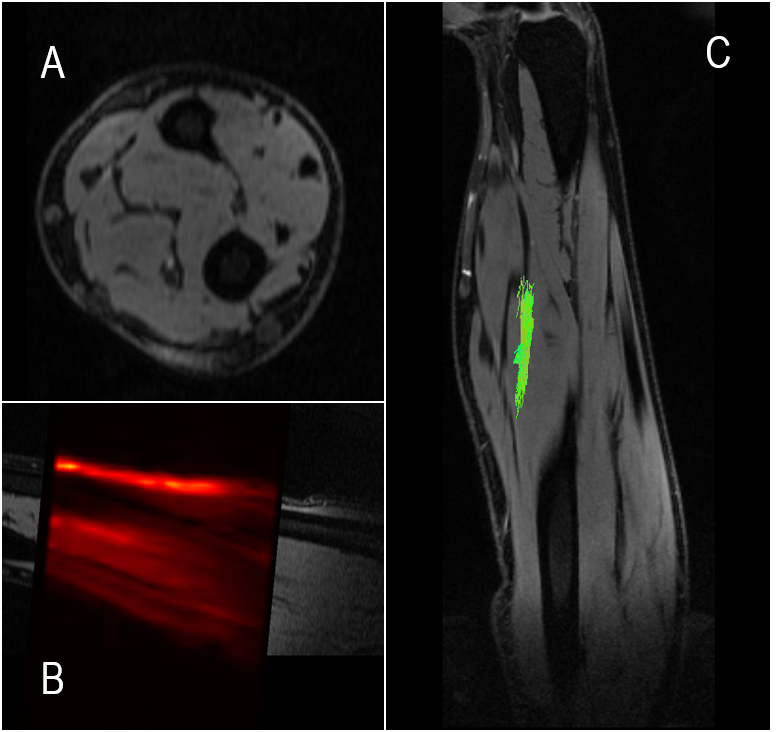
Figure 2. DWIs were registered to high-resolution anatomical images of the forearm (A and B), and diffusion fiber tractography was used to visualize the nerve (C). The direction of each nerve, measured with DTI, was used to decompose the applied gradients into parallel and perpendicular components. The perpendicular diffusion gradient component was used with the MCF framework to estimate AADs.