1004
The performance of intravoxel-incoherent motion diffusion-weighted imaging (IVIM) derived hypoxia for the risk stratification of prostate cancer1The Department of Radiology, The First Affiliated Hospital of Wenzhou Medical University, Wenzhou, China
Synopsis
Prostate cancer (PCa) is one of the most common malignant cancers in man. A recently work derived the information of hypoxia from intravoxel-incoherent motion diffusion-weighted imaging (IVIM) and demonstrated strong correlation between IVIM derived hypoxia and immunohistological hypoxia marker. In our work, IVIM derived hypoxia demonstrated better discrimination ability for the risk of PCa than apparent diffusion coefficient (ADC) and pure tissue diffusion (Ds). It might further improve the risk stratification of PCa and can be used as a prognostic factor.
Introduction
Prostate cancer (PCa) is one of the most common malignant cancers in man1. It is well established that hypoxia is closely associated with metastasis and treatment resistance of PCa 2,3. A recently work derived the information of hypoxia from intravoxel-incoherent motion diffusion-weighted imaging (IVIM) and demonstrated strong correlation between IVIM derived hypoxia and immunohistological hypoxia marker4. In our study, we further explored the discrimination ability of IVIM derived hypoxia for the risk stratification of PCa.
Materials and methods
Study population
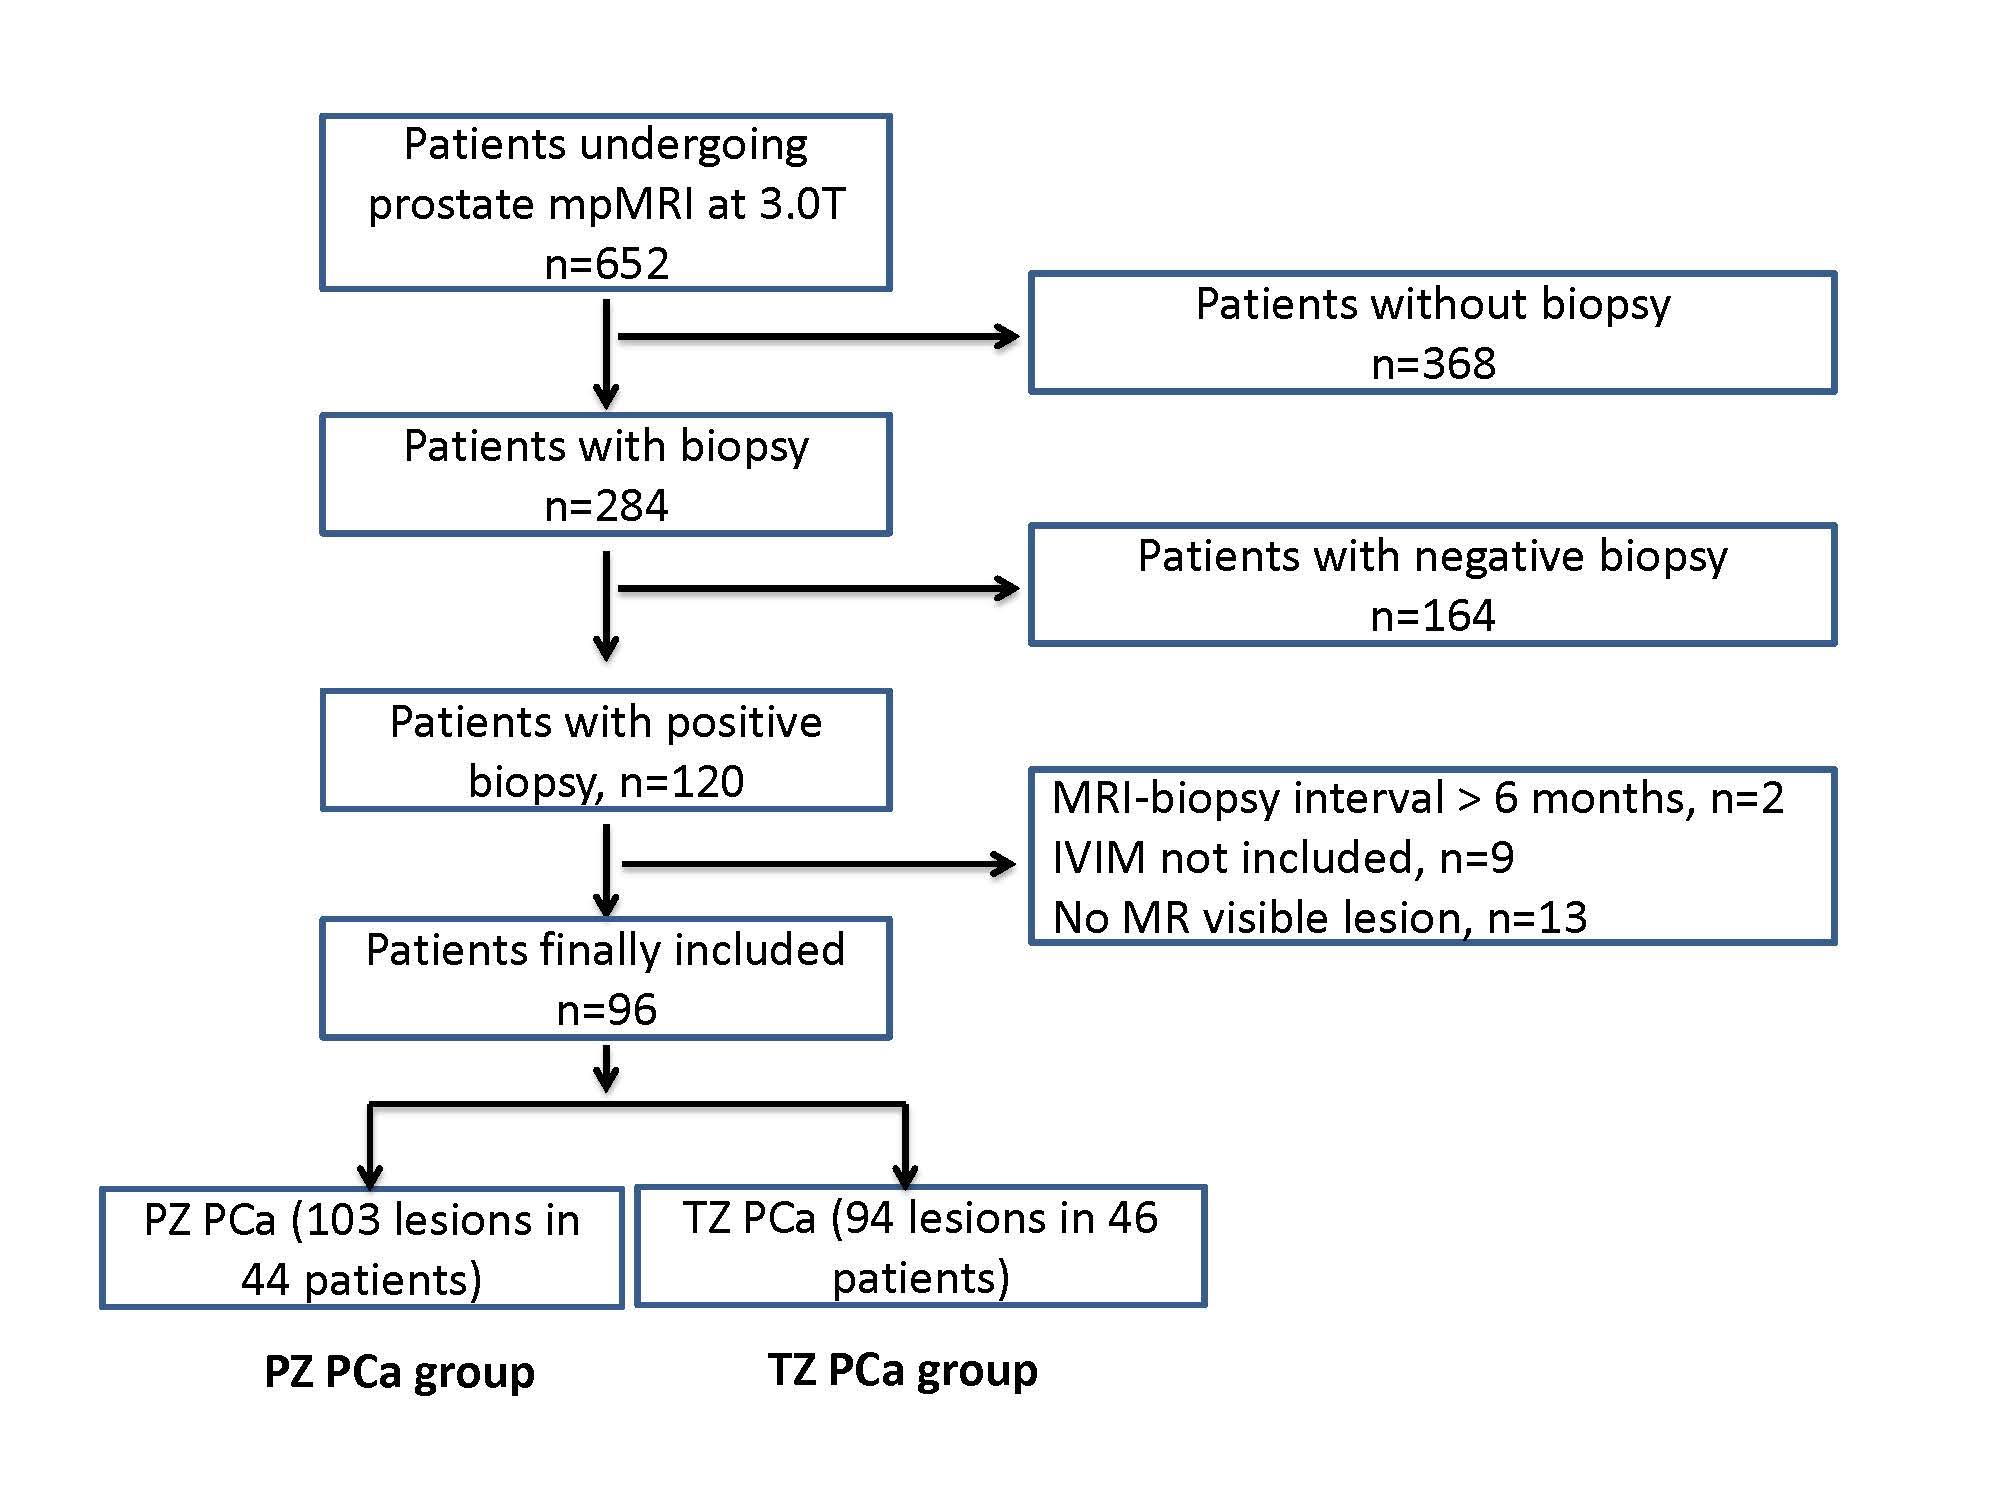
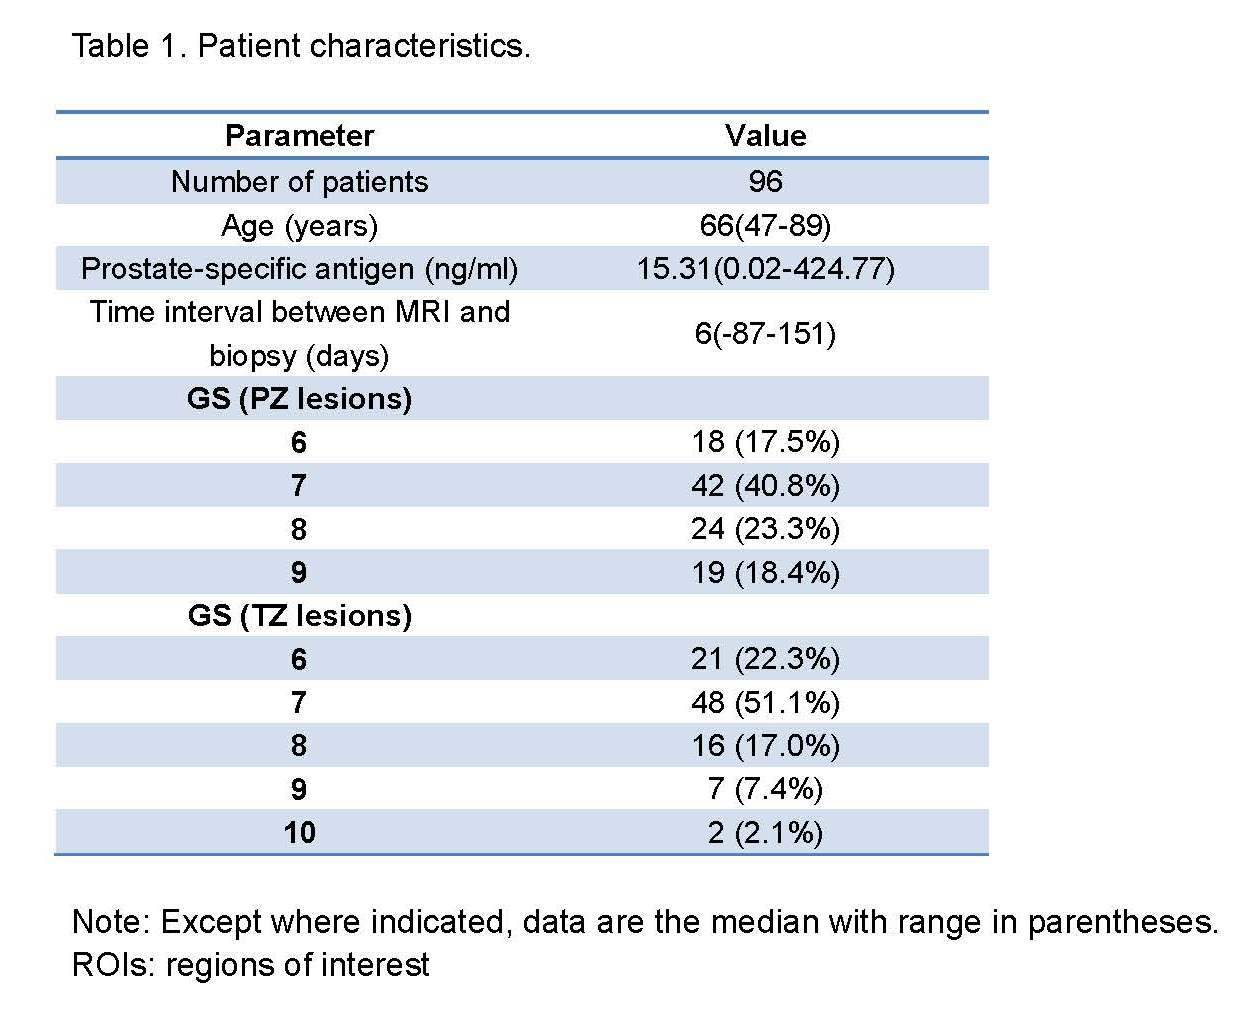
In total, 652 patients underwent prostate mpMRI. Among them, 120 patients were confirmed with PCa by ultrasound guided biopsy. Histological results were reported sextant-wisely (left, right, apex, middle and base). Twenty-four PCa patients were further excluded. At the end, 96 PCa patients were included in this study. The detailed workflow of patient selection is shown in Fig 1. In total 197 MR visible suspicious lesions were identified (103 in PZ, 94 in TZ). Detailed patient characteristics are listed in Table 1.
MRI acquisition
MR scan was carried out on 3.0T scanner (Achieva, Philips Healthcare, The Netherlands) equipped with abdominal torsor coil without endorectal coil. The mpMRI protocol included T2 weighted spin-echo imaging (T2WI) in three orthogonal directions and axial T1 weighed imaging (T1WI)/DWI/Dynamic contrast-enhanced (DCE) images. DWI was acquired with single-shot spin-echo echo-planar imaging sequence with following parameters: TE/TR=63/3000 ms, FOV=352×264 mm2, matrix=160×185, slice thickness=5.0 mm without gap, No. of slices=24, NAS=3, 5 b-values=0, 188, 375, 563, 750 s/mm2, SENSE=2.5, scan time=5min54sec. The diffusion sensitization gradients in DWI were applied along three orthogonal directions.
Calculation of parametric maps
All parametric maps were generated by using home-developed programming in Matlab (The MathWorks Inc., Natick, MA, USA). Apparent diffusion coefficient (ADC) was determined by monoexponential fitting of signal intensities over all b-values. Based on original IVIM model, signal intensity of DWI attenuates with b-values biexponentially5. As reported in the study by Pang et al, the influence of pseudo-diffusion and non-Gaussian diffusion could be neglected for the range of b-values used (188≤b≤750, s/mm2)6,7, then
S(b)=S(0)∙(fp∙δ0 (b)+(1-fp )∙exp(-b∙Ds ) ) [1]
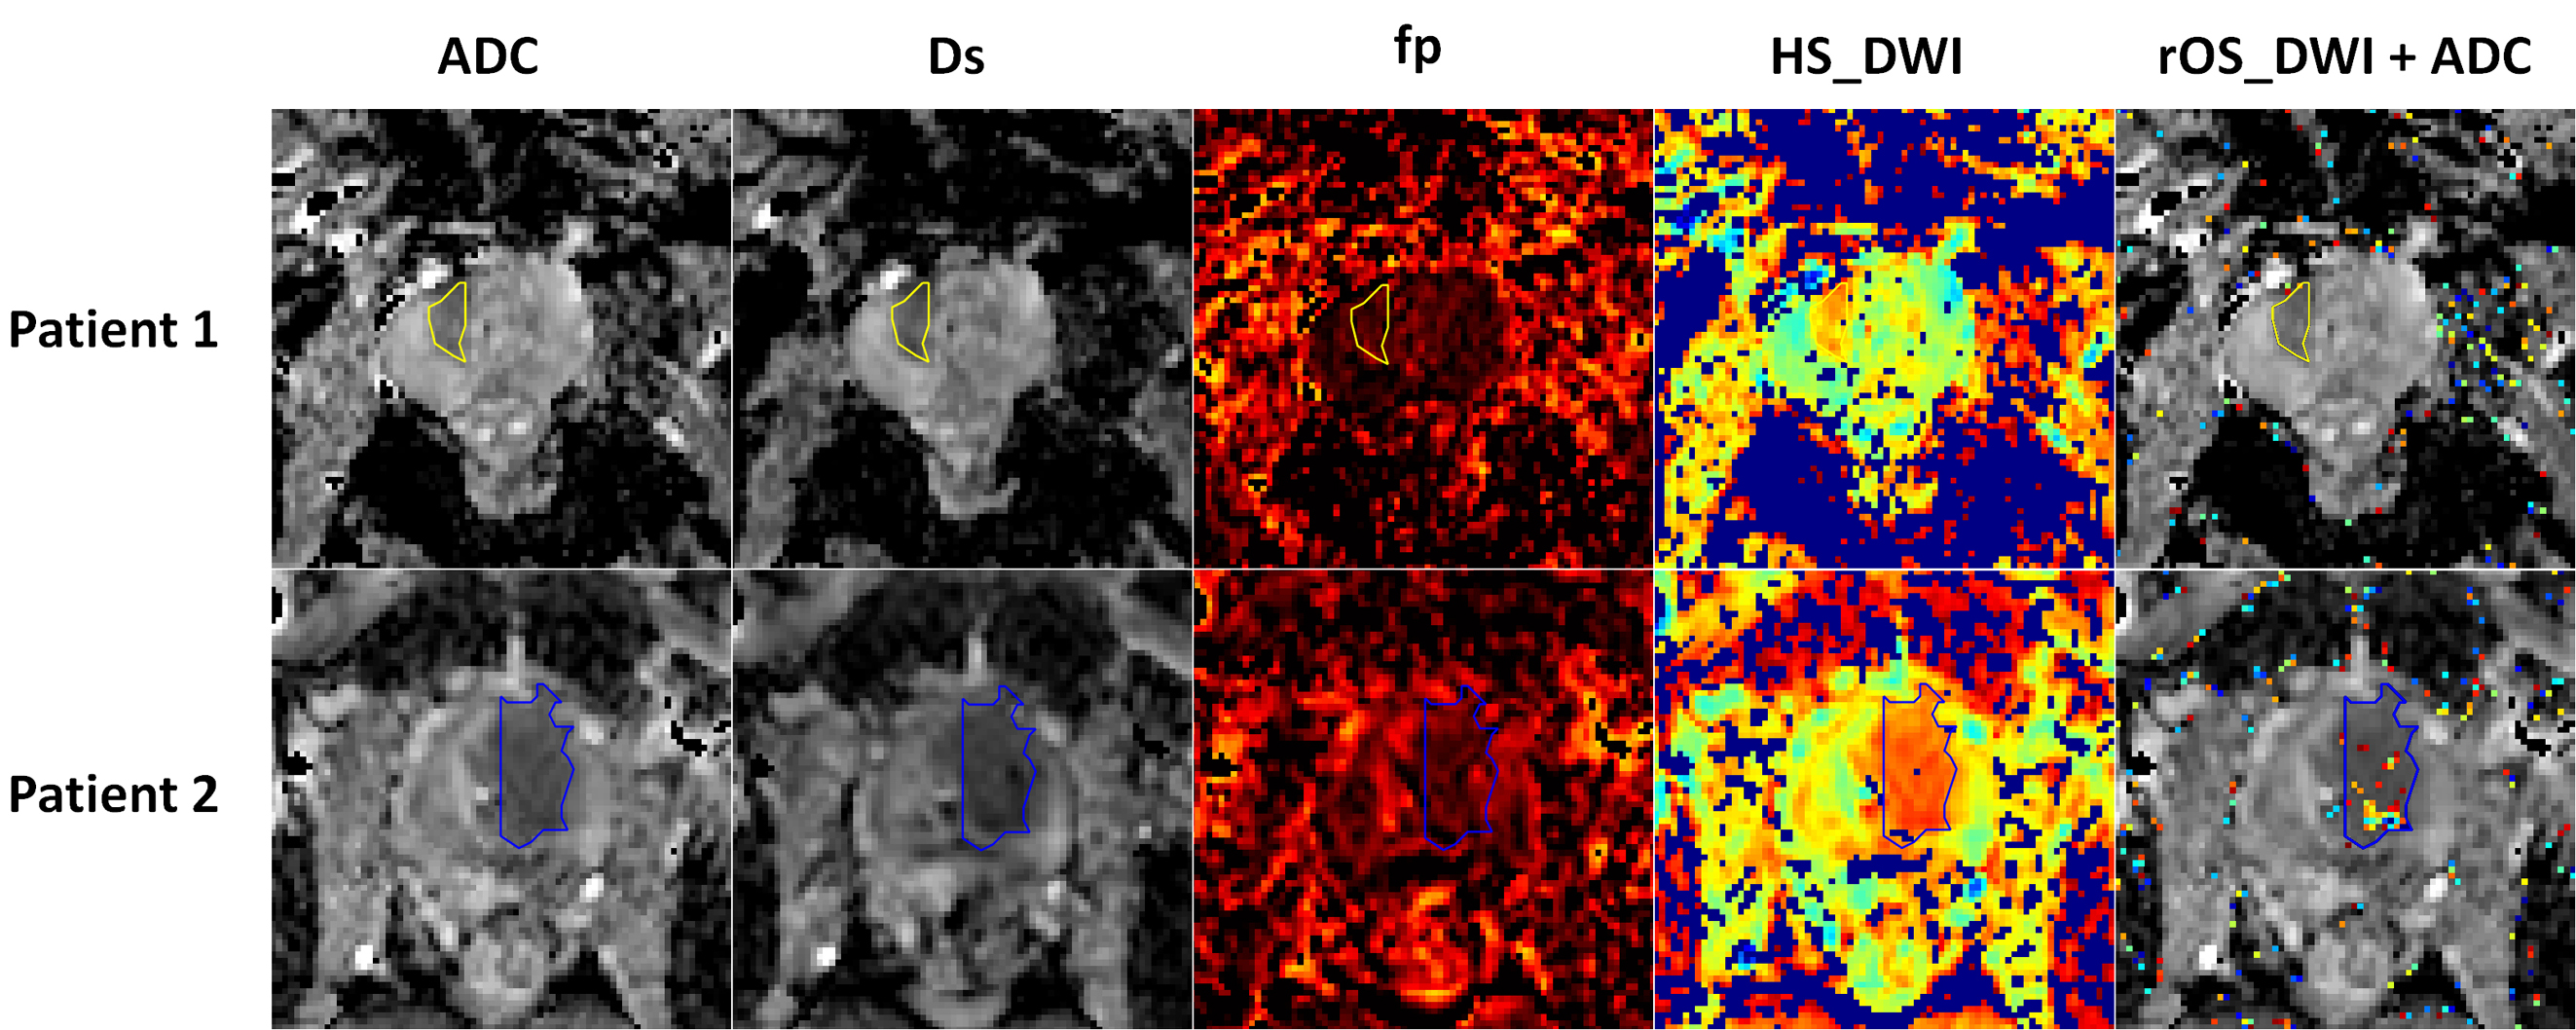
Where b is the diffusion sensitive gradient determined parameter, S(b) is the signal intensity, S(0) is the signal intensity at b=0, Ds is the pure tissue diffusion, fp is the volume fraction of pseudo-diffusion. IVIM-derived hypoxia was generated in accordance with the literature4. HF_DWI and HS_DWI, which stand for the area fraction of hypoxia and the visualization of hypxia, were calculated. Moreover, rOS_DWI, which was defined by 1.0-the relative perpendicular distance to discrimination line, was further developed to quantitatively evaluate the relative oxygen saturation.
Data analysis
Representative parametric maps of PCa patients are shown in Fig 2. Two radiologists, who were aware of the diagnosis, manually outlined regions of interest (ROIs) in consensus by using ImageJ (NIH, USA). Cancerous ROIs were delineated on ADC maps with T2WI as reference. Analysis of each ROI included mean, STD, median, kurtosis, skewness and the 10th percentile. Based on radiology-histology correlation, suspicious lesions were further divided into low-grade (LG, GS≤6) and intermediate-to-high grade (HG, GS≥7) groups.
Statistical Analysis
Data is presented as the mean±standard deviation (STD). Group comparison was applied. The Receiver Operating Characteristics (ROC) analysis was performed in MedCalc Statistical Software (MedCalc Software, Ostend, Belgium; 2017). For all statistical tests, a p value<0.05 was considered significant.
Results
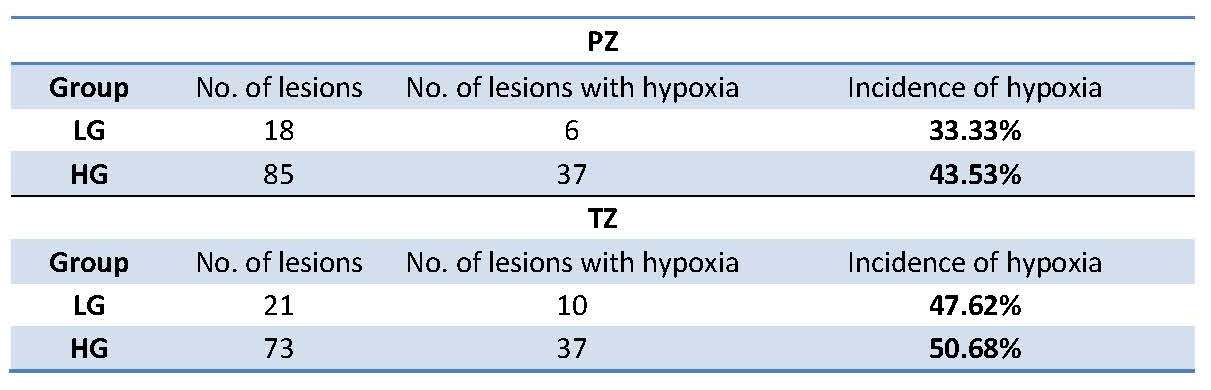
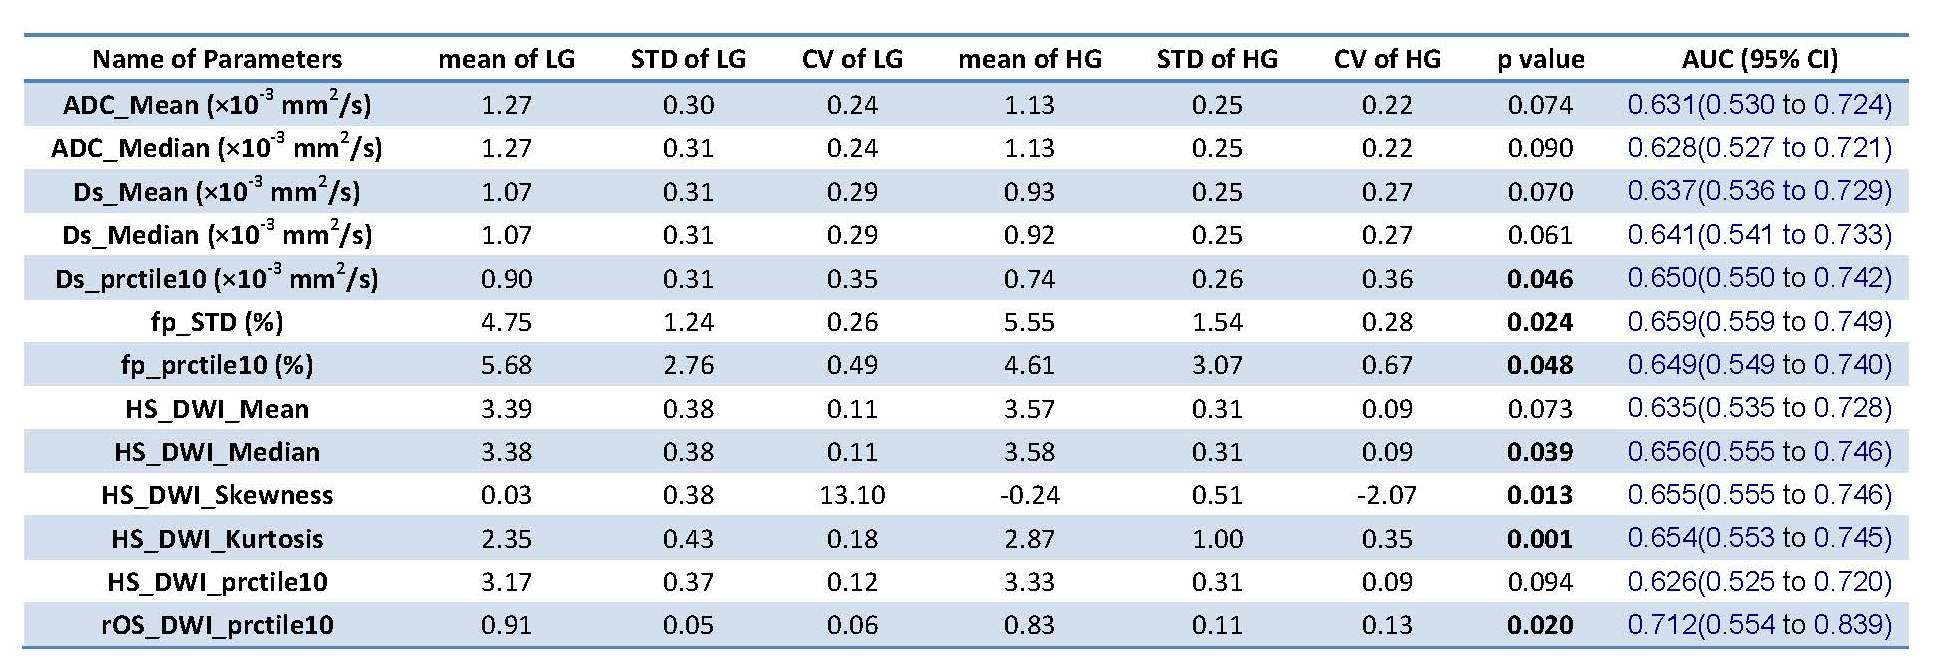
Among the suspicious lesions identified by radiology-histology correlation, the incidence of hypoxia was higher in HG group than LG group for both PZ and TZ (Table 2). From the statistical group comparison, the parameters with p<0.1 were listed in Table 3 and 4 for PZ and TZ respectively. In PZ, 10th percentile of Ds, STD / 10th percentile of fp, median/kurtosis/skewness of HS_DWI, and 10th percentile of rOS_DWI differed significantly between groups (p<0.05), while in TZ, only rOS_DWI showed significant difference (p=0.027). It was noted that the relative oxygen saturation (rOS_DWI) was significantly lower in HG lesions for both PZ and TZ. Among all the analyzed parameters, 10th percentile rOS_DWI (AUC rOS_DWI =0.712) demonstrated the highest discrimination ability, which was superior to both ADC and Ds (AUCmean ADC=0.631, AUCmean Ds=0.637).
Discussion
IVIM derived hypoxia is feasible for clinical routine. From our results, hypoxia existed in both LG and HG lesions, which was in line with literature8. Yet, hypoxi doesn't occure in all PCa. For the PCa with hypoxia, the discrimination ability of IVIM derived hypoxia seems superior to ADC and Ds alone. It can potentially further improve the risk stratification of PCa.
Conclusion
IVIM derived hypoxia seems superior to ADC and Ds for the risk stratification of PCa. Moreover, it can provide supplemental physiology information.
Acknowledgements
Project supported by the National Natural Science Foundation of China (Grant No. 81401544 ) and Natural Science Foundation of Zhejiang Province of China (Grant No. LQ14H180006).References
1. Siegel RL, Miller KD, Jemal A. Cancer Statistics, 2017. CA: a cancer journal for clinicians. 2017;67(1):7-30.
2. Ackerstaff E, Artemov D, Gillies RJ, Bhujwalla ZM. Hypoxia and the presence of human vascular endothelial cells affect prostate cancer cell invasion and metabolism. Neoplasia. 2007;9(12):1138-1151. 3. Lee CT, Boss MK, Dewhirst MW. Imaging tumor hypoxia to advance radiation oncology. Antioxidants & redox signaling. 2014;21(2):313-337.
4. Hompland T, Hole KH, Ragnum HB, Aarnes EK, Vlatkovic L, Lie AK, Patzke S, Brennhovd B, Seierstad T, Lyng H. Combined MR Imaging of Oxygen Consumption and Supply Reveals Tumor Hypoxia and Aggressiveness in Prostate Cancer Patients. Cancer research. 2018;78(16):4774-4785.
5. Le Bihan D, Breton E, Lallemand D, Aubin ML, Vignaud J, Laval-Jeantet M. Separation of diffusion and perfusion in intravoxel incoherent motion MR imaging. Radiology. 1988;168(2):497-505.
6. Pang Y, Turkbey B, Bernardo M, Kruecker J, Kadoury S, Merino MJ, Wood BJ, Pinto PA, Choyke PL. Intravoxel incoherent motion MR imaging for prostate cancer: An evaluation of perfusion fraction and diffusion coefficient derived from different b-value combinations. Magn Reson Med. 2013;69(2):553-562. 7. Yuan Q, Costa DN, Senegas J, Xi Y, Wiethoff AJ, Rofsky NM, Roehrborn C, Lenkinski RE, Pedrosa I. Quantitative diffusion-weighted imaging and dynamic contrast-enhanced characterization of the index lesion with multiparametric MRI in prostate cancer patients. Journal of magnetic resonance imaging : JMRI. 2017;45(3):908-916.
8. Ragnum HB, Vlatkovic L, Lie AK, Axcrona K, Julin CH, Frikstad KM, Hole KH, Seierstad T, Lyng H. The tumour hypoxia marker pimonidazole reflects a transcriptional programme associated with aggressive prostate cancer. British journal of cancer. 2015;112(2):382-390.
Figures