1002
B-tensor encoding in meningiomas: Comparisons with histology, microimaging and tumor consistency1Medical Radiation Physics, Lund University, Lund, Sweden, 2Laboratory of Mathematics in Imaging, Harvard Medical School, Boston, MA, United States, 3Radiology, Brigham and Women's Hospital, Boston, MA, United States, 4Oncology and Pathology, Clinical Sciences, Lund University, Skåne University Hospital, Lund, Sweden, 5Neurosurgery, Clinical Sciences, Lund University, Skåne University Hospital, Lund, Sweden, 6Russell H. Morgan Department of Radiology and Radiological Science, Johns Hopkins University School of Medicine, Baltimore, MD, United States, 7Diagnostic Radiology, Clinical Sciences, Lund University, Lund, Sweden, 8Lund University Bioimaging Center, Lund University, Lund, Sweden
Synopsis
B-tensor encoding enables a mapping of novel dMRI parameters such as microscopic anisotropy and tissue heterogeneity which are sensitive to elongated cell structures and heterogeneity in cell density, respectively. We applied b-tensor encoding to patients with meningioma tumors and compared the imaging findings to the histological type and grade as well as to the tumor consistency determined during surgery. Results show that microcystic/angiomatous meningiomas could be differentiated, and tumor consistency linked both to tissue heterogeneity and microscopic anisotropy and that tumor heterogeneity could provide additional contrast.
Introduction
Meningiomas stem from the membranes of the brain and spinal cord and are primarily treated by surgical resection. Pre-operative assessment of meningioma microstructure (type, malignancy and consistency) would be valuable for treatment planning. B-tensor encoding[1] is a method that yields imaging parameters sensitive to the elongation of cell structures (microscopic anisotropy) or heterogeneity in cell density (tissue heterogeneity)[2,3]. The aim of this study was to establish the relationship between these novel imaging parameters and independent measures of meningioma microstructure. These measured included postoperative histological assessment, tumor consistency assessed during surgery, and tumor heterogeneity as determined by ex-vivo high-resolution MRI.
Methods
26 patients with meningioma tumors were examined on a 3T scanner (MAGNETOM Prisma, Siemens Healthcare, Erlangen, Germany) prior to surgery. Informed written consent was obtained from all subjects. A prototype spin-echo b-tensor encoding sequence was used with TR=5.3 s, TE = 80 ms, FOV=230×230 mm2, slices=21, resolution=2.3×2.3×2.3 mm3, iPAT=2, partial-Fourier=6/8, two tensor shapes (linear and spherical) and four equidistant b-values between 0.1 and 2.0 ms/µm2. The mean diffusivity (MD), microscopic anisotropy (MKA) and tissue heterogeneity (MKI) were obtained by fitting the signal equation [1-3]:
$$\rm{S(\mathit{b},\mathit{b}_{\Delta})=exp(-\mathit{b}MD+\mathit{b}^2MD^2MK_I/6+\mathit{b}_{\Delta}^2\mathit{b}^2MD^2MK_A/6)}$$
where $$$b$$$ and $$$b_{\Delta}$$$ are the trace and shape of the encoding tensor, respectively. Region-of-interests (ROIs) were drawn in the contrast-enhancing region on the post-Gd T1w image. Image analysis was performed using the diffusion software package available at https://github.com/markus-nilsson/md-dmri. The consistency of the tumors was assessed during surgery (soft, average, or stiff). Resected tumors underwent a standard histological procedure, stored, analyzed for grade and type by a histopathologist. Two tissue samples were also imaged by a DTI sequence using Bruker BioSpec 9.4T (TR=1 s, TE=30 ms, slices=41, averages=10, FOV=200×200 µm2, using icosahedral direction set with b-values for each direction 100, 1000 and 3000 s/mm2).
Results
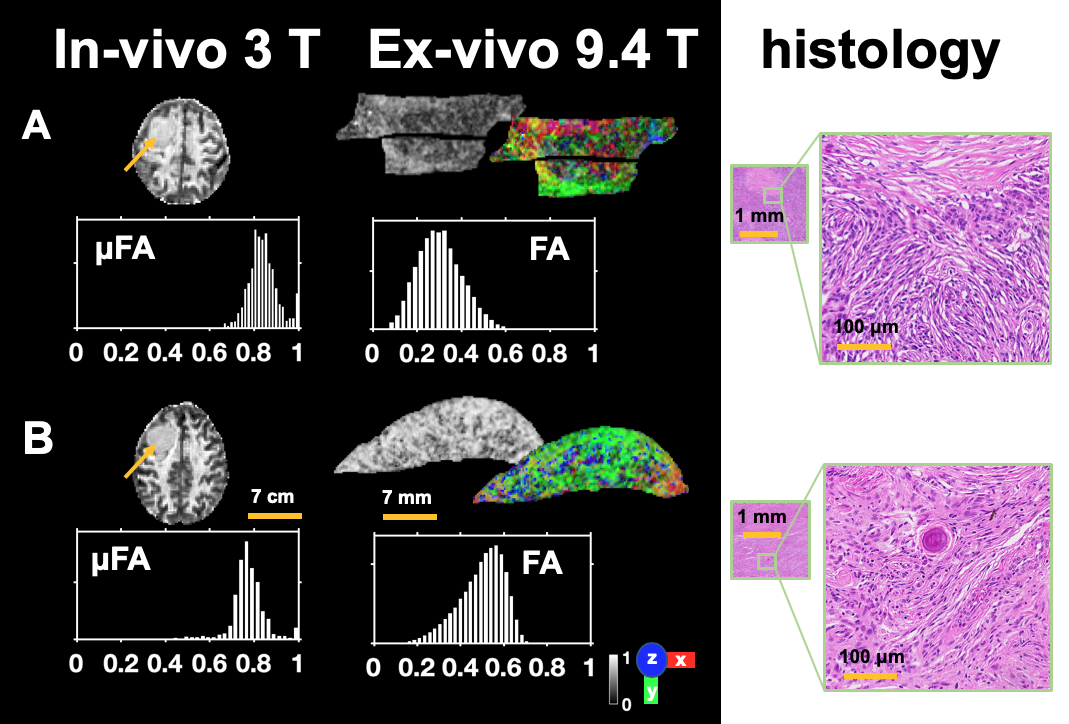
Figure 1 shows post-Gd T1w images from one patient together with maps of the mean diffusivity, microscopic anisotropy, and tissue heterogeneity. In the example, microscopic anisotropy and tissue heterogeneity were lower than those of the white matter and gray matter, respectively, although some variability within the tumor can be seen in both parameters. Figure 2 shows dMRI parameters for each tumor type. The microcystic/angiomatous type had the highest mean diffusivity and the lowest microscopic anisotropy. The psammomatous type had the highest microscopic anisotropy. Fibroblastic meningiomas were the most common type and exhibited a wide range of parameter values. Figure 3 shows dMRI parameters versus histological grade and tumor consistency. Grade I and II meningiomas did not show any significant differences in the dMRI parameters. Tumor consistency was weakly associated with tissue heterogeneity (p = 0.071 for difference in medians between stiff versus average and soft, U-test; positive predictive of stiff consistency of 75 % value at threshold 0.214) but also with microscopic anisotropy (p = 0.142, U-test; positive predictive value of 75 % at 0.975). Figure 4 shows the improved contrast of the b-tensor encoding. Figure 5 shows tumors imaged in-vivo, ex-vivo and their histology. Samples had ex-vivo not only different mean values of the fractional anisotropies but also opposite skewness of the distributions. In-vivo distributions of microscopic fractional anisotropies had higher means.Discussion and conclusion
Using b-tensor encoding, we found that both tissue heterogeneity and microscopic anisotropy provided information that may help to differentiate stiff tumors, although a larger sample size is necessary for definite answers. Most histological types showed overlapping values of the dMRI parameters, but two types stood out from the rest. First, meningiomas of the microcystic/angiomatous type exhibited high mean diffusivity, consistent with the notion that the key microstructural features that defines these tumours are cysts/vessels filled with liquid. Psammomatous meningioma exhibited extraordinarily high microscopic anisotropy (Fig. 2). Contrary to our expectations the most common type, the fibroblastic meningioma which contains collagen fibers, did not exhibit high microscopic anisotropy. This agrees with our finding that tumors with stiff consistency tended to have lower microscopic anisotropy. This suggests that collagen fibers may not cause anisotropic diffusion. We will corroborate this finding, in our on-going work, by linking presurgical dMRI with high-resolution in-vitro diffusion tensor imaging (Fig. 5). The WHO grade of the meningioma did not correlate with any of the dMRI parameters. This finding is in line with a larger study using conventional DWI[6], probably because the defining features of higher grade tumors are subtle such as mitotic activity[7]. In conclusion, stiff tumor consistency was found among different meningioma types and was characterized by a higher tissue heterogeneity and lower microscopic anisotropy. This may potentially enable preoperative assessment of tumor consistency, which is relevant when considering different neurosurgical strategies.Acknowledgements
We thank Siemens Healthcare for access to the pulse sequence programming environment. Michael Gottschalk, René In 'T Zandt and Lund University Bioimaging Center (LBIC), Lund University are gratefully acknowledged for providing experimental resources.
References
1. Westin, C.-F., et al., Q-space trajectory imaging for multidimensional diffusion MRI of the human brain. Neuroimage, 2016. 135: p. 345-362.
2. Szczepankiewicz, F., et al., The link between diffusion MRI and tumor heterogeneity: Mapping cell eccentricity and density by diffusional variance decomposition (DIVIDE). NeuroImage, 2016. 142: p. 522-532.
3. Lasič, S., et al., Microanisotropy imaging: quantification of microscopic diffusion anisotropy and orientational order parameter by diffusion MRI with magic-angle spinning of the q-vector. Frontiers in Physics, 2014. 2: p. 11.
4. Szczepankiewicz, F., et al., Quantification of microscopic diffusion anisotropy disentangles effects of orientation dispersion from microstructure: applications in healthy volunteers and in brain tumors. NeuroImage, 2015. 104: p. 241-252.
5. Szczepankiewicz, F. and M. Nilsson. Maxwell‐compensated waveform design for asymmetric diffusion encoding. in Annual Meeting of the International Society for Magnetic Resonance in Medicine. 2018.
6. Santelli, L., et al., Diffusion-weighted imaging does not predict histological grading in meningiomas. Acta neurochirurgica, 2010. 152(8): p. 1315-1319.
7. Louis, D.N., H. Ohgaki, and O.D. Wiestler, WHO classification of tumours of the central nervous system. Vol. 1. 2007: WHO Regional Office Europe.
Figures
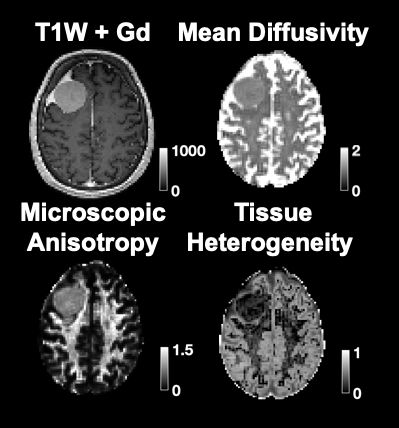
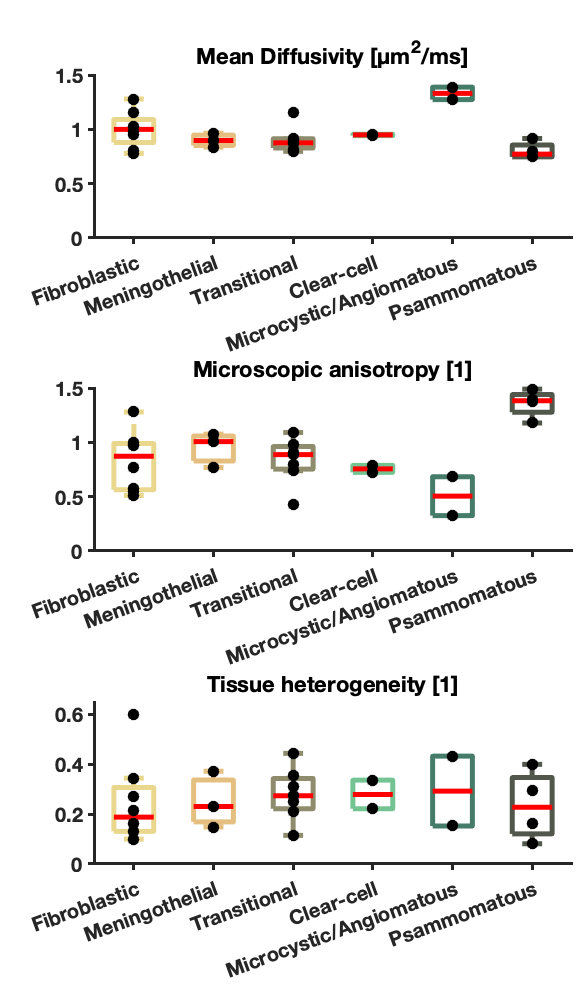
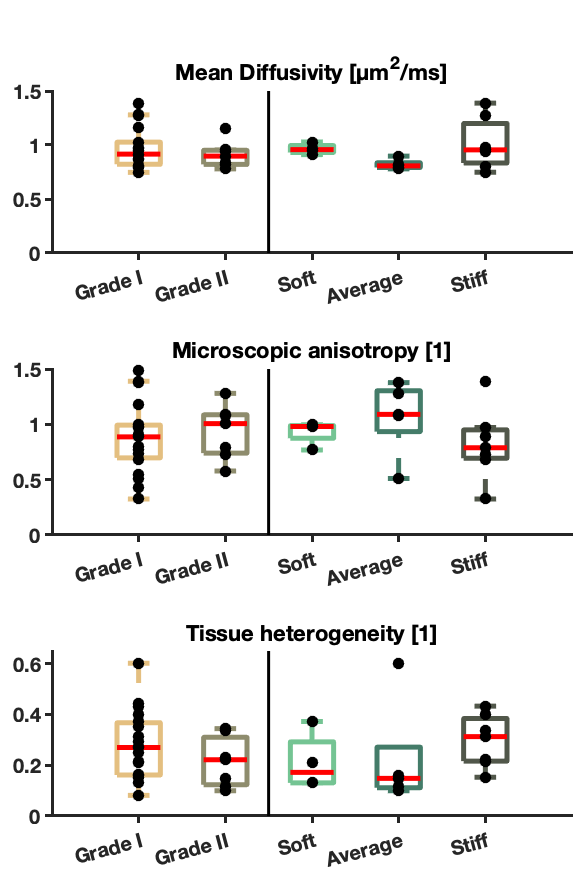
Figure 3. Comparison of dMRI parameters versus grade and consistency. The stiffness of the meningiomas was associated with higher tissue heterogeneity (p = 0.071 for difference in medians between stiff versus average and soft, U-test; positive predictive of stiff consistency of 75 % value at threshold 0.214) and also with lower microscopic anisotropy (p = 0.142, U-test; positive predictive value of stiff consistency of 75 % at threshold 0.975). However, no significant difference between tumor grades and of the dMRI parameters was found.