1000
A Multiparametric DTI analysis for Stratification of CSVD Subgroups1The Mind Research Network, Albuquerque, NM, United States, 2University of New Mexico Health Sciences Center, Albuquerque, NM, United States, 3University of New Mexico, Albuquerque, NM, United States
Synopsis
Vascular cognitive impairment and dementia (VCID) which includes all forms of small vessel diseases is associated with white matter (WM) damages. Diffusion tensor imaging (DTI) has been used widely in several studies in characterizing these WM changes in VCID. The aim of this study is to evaluate the classification accuracy of diffusion measures to distinguish cerebral small vessel disease (CSVD) subjects from healthy controls (HC) and be further able to discriminate CSVD subgroups consisting of subcortical ischemic vascular disease , mixed dementia , leukoaraiosis , and Alzheimer’s disease. The proposed classification framework includes feature extraction followed by multiclass random forest classification with leave one out cross validation. The classification features were defined based on histogram measures calculated on 4 WM regions from four DTI modalities (FA, MD, AD, and RD). Multiple classification tasks were performed owing to the different subject groups. We have shown that DTI combined with FLAIR and cognitive score can give up to 78% classification accuracy for the 5-group and the 4-group classification without the need of the harder to measure cerebrospinal fluid biomarkers.
Introduction
Our goal is to stratify cerebral small vessel disease (CSVD) individuals into subgroups consisting of subcortical ischemic vascular disease (SIVD), mixed dementia (MX), leukoaraiosis (LA), and Alzheimer’s disease (AD). This subdivision is based on differences in neuroinflammation as observed by white matter damage, neurodegeneration as observed by cerebrospinal fluid biomarkers, and other clinical measures. We apply diffusion tensor imaging (DTI) based biomarkers, combined with other easily measurable biomarkers, such as white matter hyperintensities volume (WMHV) and neuropsychological test scores for the purposes of CSVD groups stratification. To our knowledge, this stratification has not been done before and is needed because drugs specifically directed for neuroinflammation or neurodegeneration are being developed. Moreover, in order to evaluate the efficacy of these treatments with a small sample size it is important to characterize the subject groups precisely. A similar DTI analysis without classification was reported earlier showing only the differences between controls and CSVD treated as a single group1.Methods
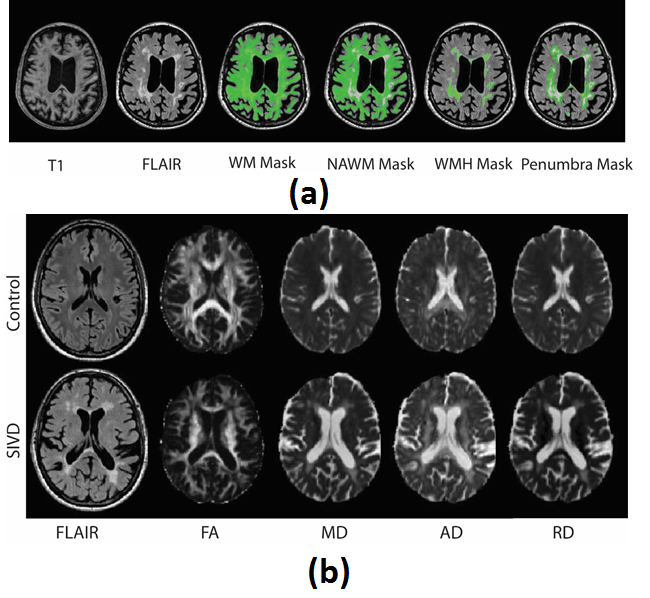
The subject group consisted of 53 healthy controls (HC), 21 SIVD subjects, 9 MX subjects, 20 LA subjects, and 29 subjects with AD, for a total of 132 subjects. We study classification of these subjects into 5 groups [SIVD, MX, LA, AD, HC] and 4 groups without controls consisting of [SIVD, MX, LA, AD]. In addition we report the results for simpler 2-group classifications, consisting of separating controls from patients [CSVD, HC] and separating patients with high neuroinflammation from others [SIVD+MX, LA+AD]. The WMHV and the normally appearing white matter (NAWM) were based on FLAIR images. Diffusion biomarkers are based on histograms calculated from four DTI modalities (FA, MD, AD, and RD), each calculated for four different white matter regions (WM, NAWM, WMH, and WMH penumbra) (Figure 1). The eight histogram features consisted of mean, median, mode, standard deviation (Std), inter-quartile range (IQR), peak height (PHt), skewness, and kurtosis. This resulted in 128 histogram features calculated from the same diffusion data. All MRI measurements were done on Siemens 3T TRIO. The classification results we present are based on the above diffusion biomarkers combined with PSMD (Peak width of skeletonized mean diffusivity) which is a diffusion biomarker based on white matter skeleton2, WMHV, and neuropsychological memory (NPM) test score. An exploratory analysis also included hippocampal volume, mean cortical thickness, brain atrophy, NAA concentration, blood-brain barrier permeability, and other neuropsychological tests, but these were not as effective for stratification purposes. The classification is based on the random forest algorithm with leave one out cross-validation. The best parameters for random forest classifier were chosen based on hyperparameter tuning, searching for optimal settings of parameters. All implementations were done in python using Scipy. Random forest classification, hyperparameter tuning and cross-validation were based on scikit-learn3.Results
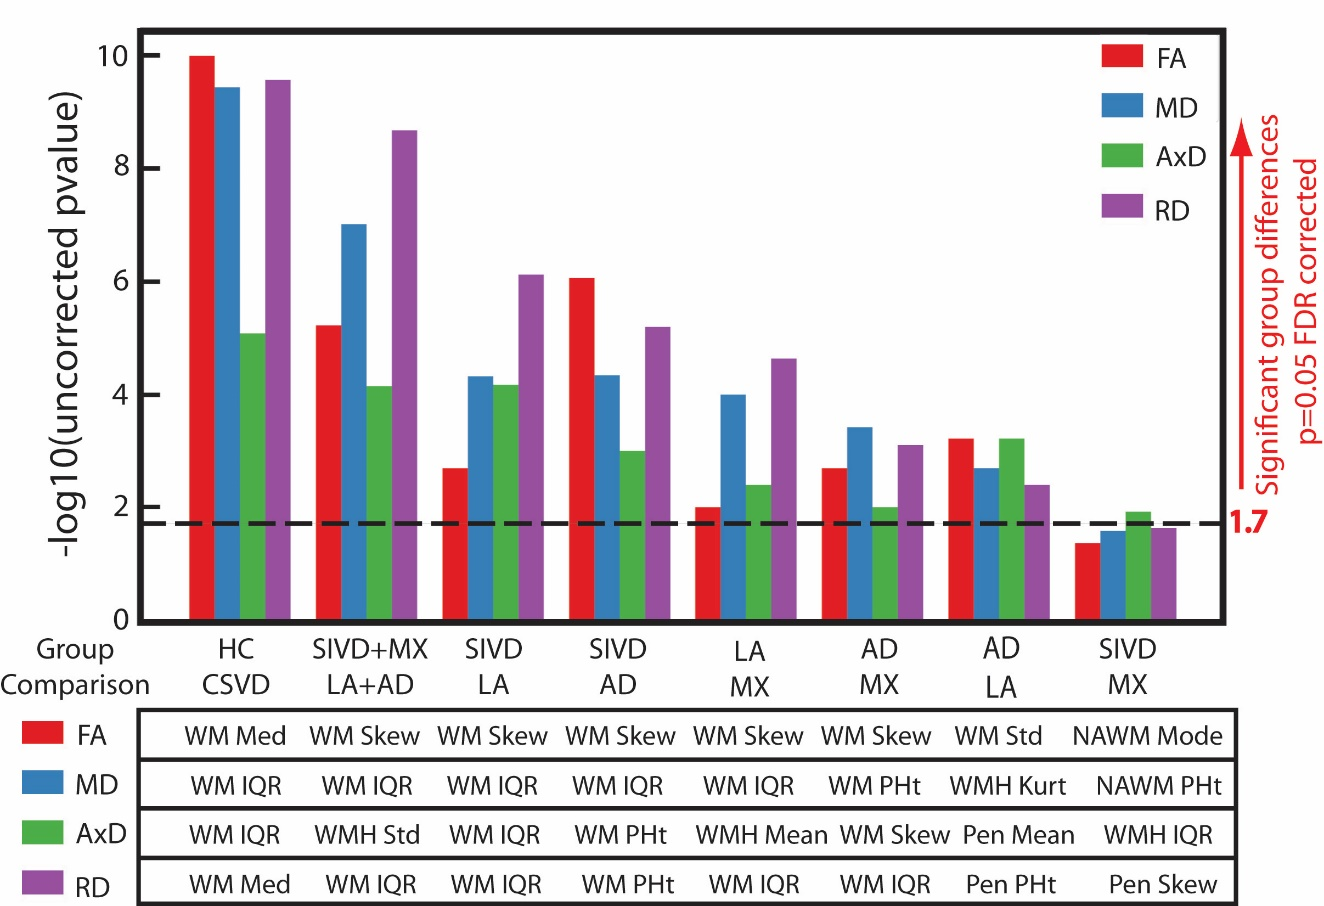
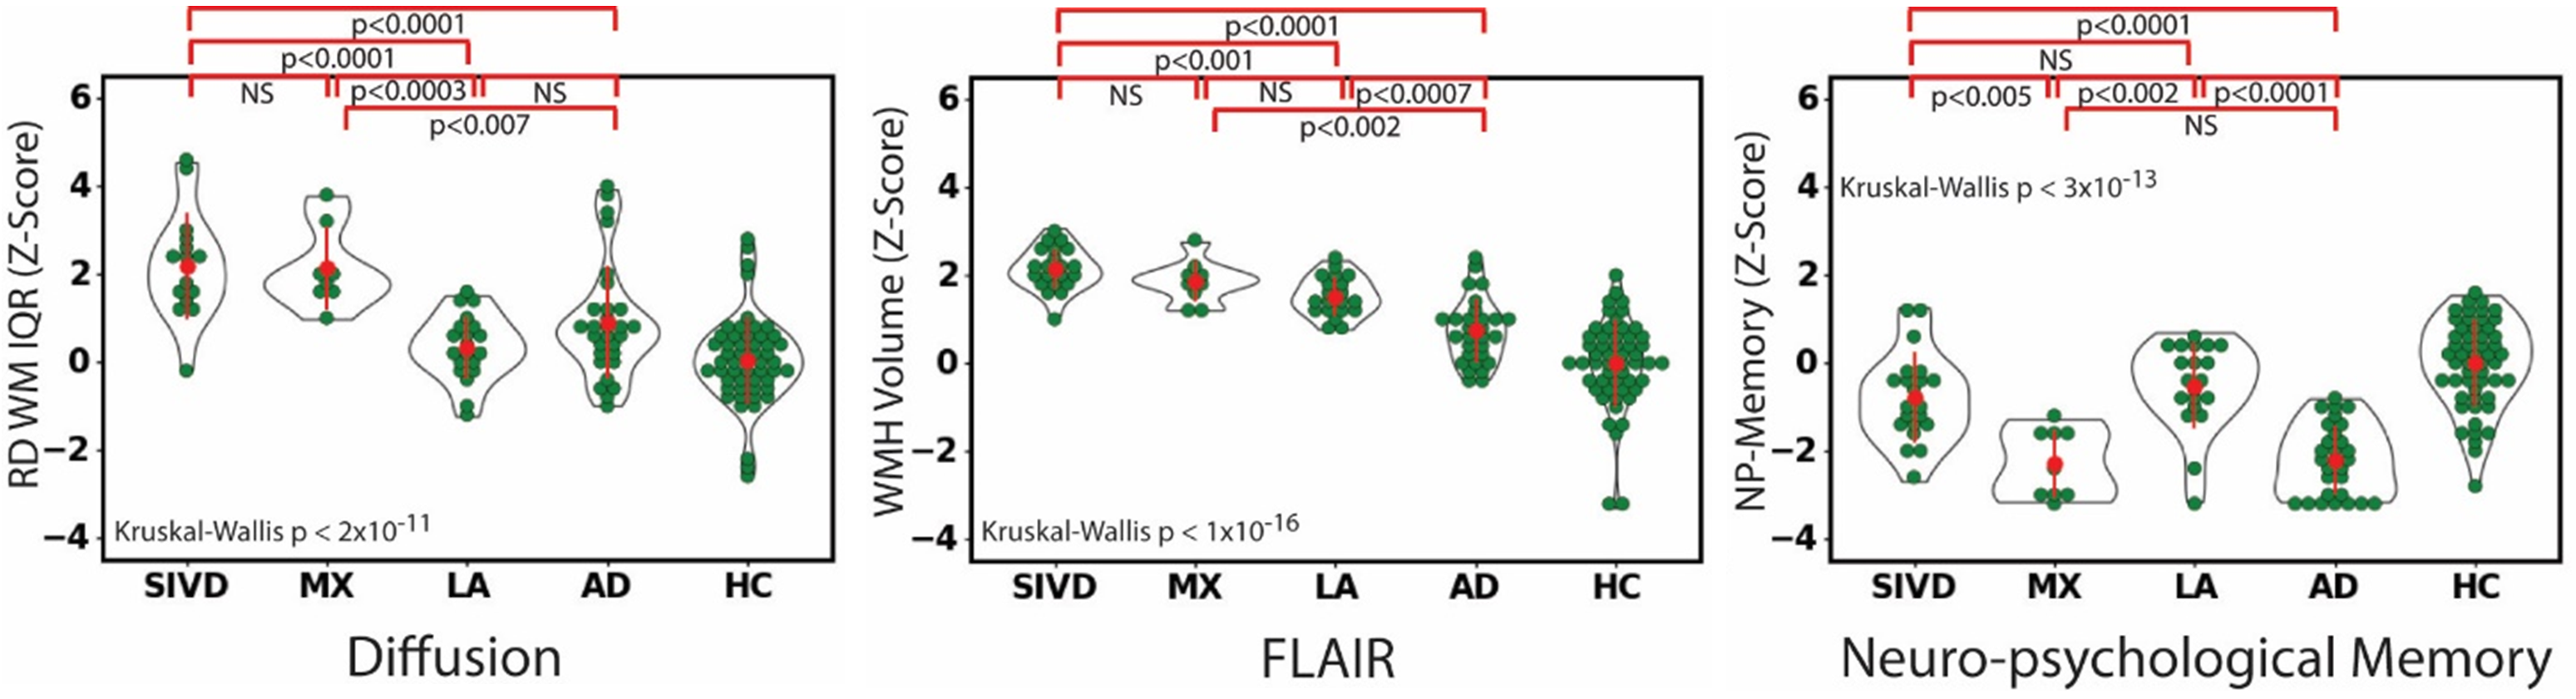
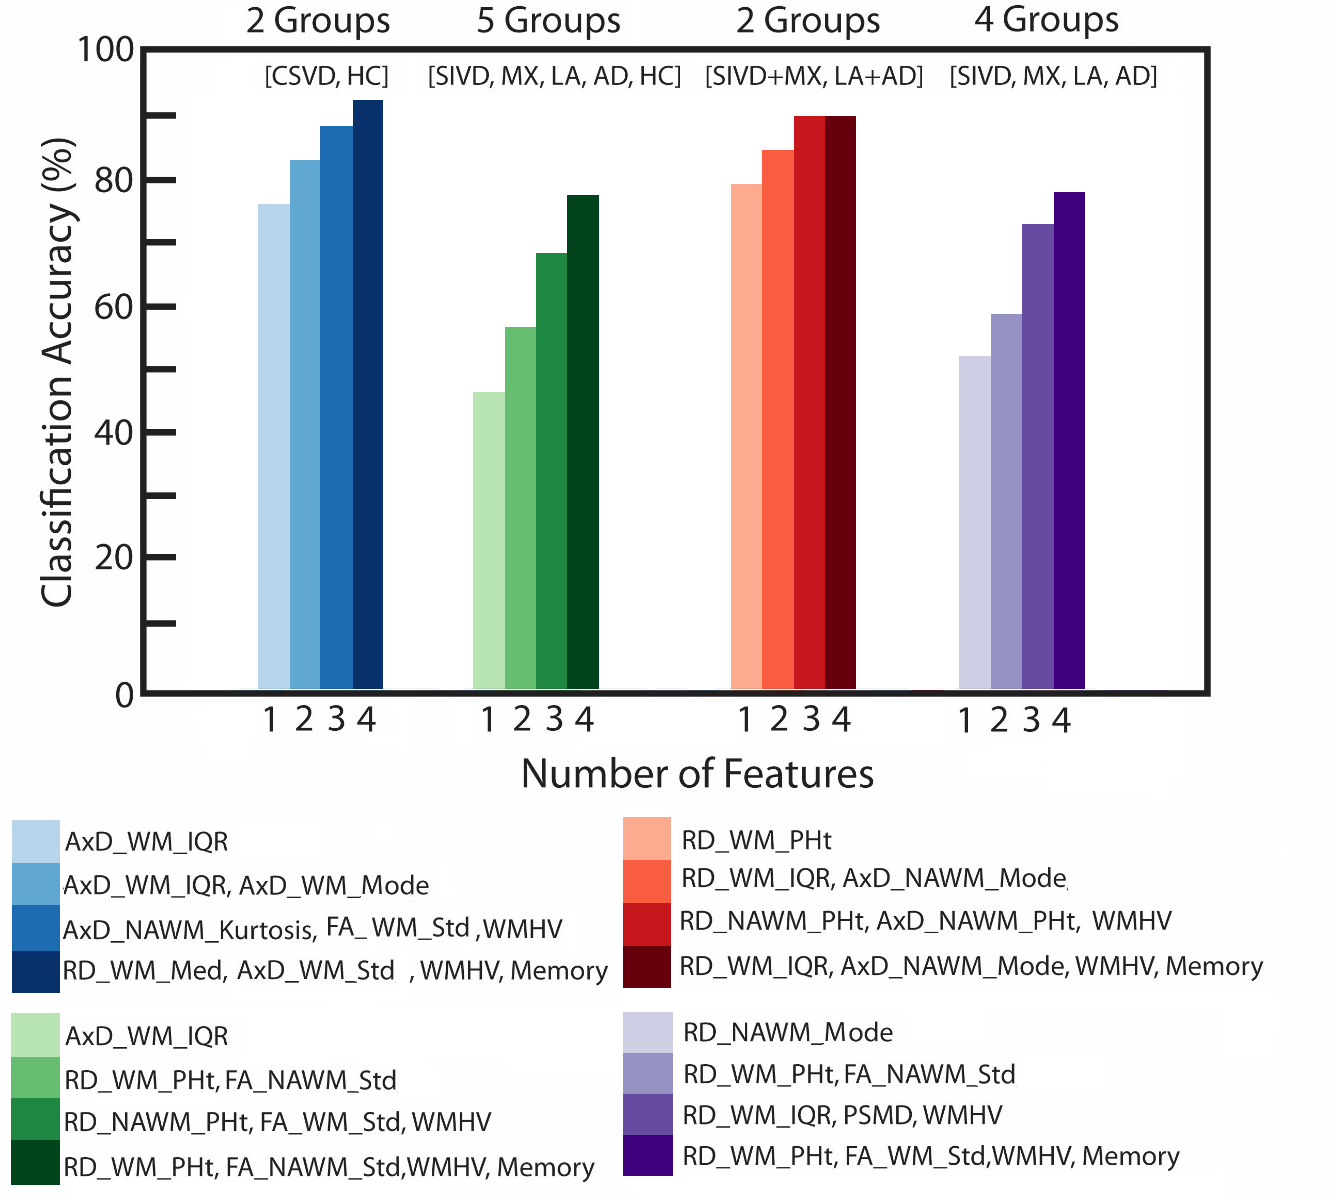
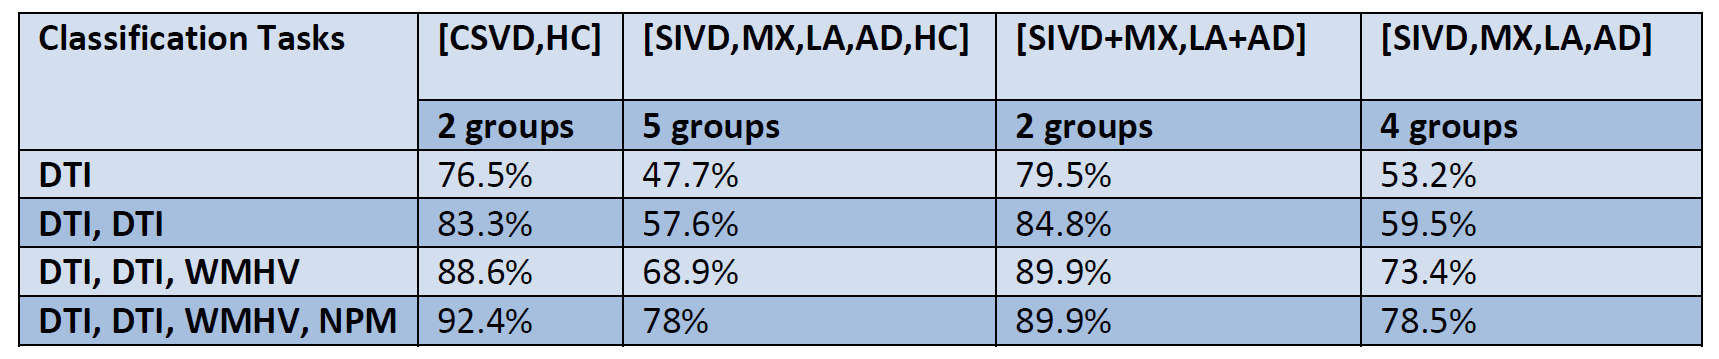
There are 128 diffusion features measured from the same diffusion data and we expect them to be correlated and all to reflect some aspect of white matter damage. We first discuss if some of them are better for group discrimination than others (Figure 2). The radial diffusivity features calculated from the white matter and the features related to the histogram width had consistent good group discrimination. The hardest group to discriminate by diffusion was SIVD and MX, followed by LA and AD. We then motivate combining diffusion with WMH volume and the NPM score, because each of them shows a different group discrimination pattern, they are not strongly correlated, providing independent information for stratification (Figure 3). The classification results are shown in Figure 4. The classification accuracies for the four classification studies and the advantage of adding memory scores are summarized in Table 1. In the 5-group and the 4-group case the addition of WMHV increases the classification accuracy by about 10% and the inclusion of NPM further increases the accuracy by at least 5%, with the maximum accuracy of 78% with four biomarkers.Discussion and Conclusion
Notably, although the diffusion in WMH shows clear damage, it was less sensitive for group discrimination. This was because the white matter damage within the WMH was captured by histograms is similar across groups. The small group size and the lack of an independent data set for cross-validation make these results a little specific to our data set. We have also shown that the classification accuracy of the PSMD taken by itself, or when combined with others was lower than other combinations. DTI combined with FLAIR and the NPM score gives up to 78% classification accuracy for the 5-group and the 4-group classification without the need of the harder to measure CSF biomarkers.Acknowledgements
This work was supported by NIH grant UH3-NS-100598.References
1. Lawrence, Andrew J., et al. "Mechanisms of cognitive impairment in cerebral small vessel disease: multimodal MRI results from the St George's cognition and neuroimaging in stroke (SCANS) study." PloS one 8.4 (2013): e61014.
2. Baykara, Ebru, et al. "A novel imaging marker for small vessel disease based on skeletonization of white matter tracts and diffusion histograms." Annals of neurology 80.4 (2016): 581-592.
3. Pedregosa, Fabian, et al. "Scikit-learn: Machine learning in Python." Journal of machine learning research 12.Oct (2011): 2825-2830.
Figures