0998
Assessing Human Optic Nerve Function using Diffusion Basis Spectrum Imaging (DBSI)1Radiology, Washington University School of Medicine, St Louis, MO, United States, 2Hope Center for Neurological Disorders, Washington University School of Medicine, St Louis, MO, United States, 3Biostatistics, Washington University School of Medicine, St Louis, MO, United States, 4Neurology, Washington University School of Medicine, St Louis, MO, United States, 5Radiology, Icahn School of Medicine at Mount Sinai, New York, NY, United States, 6Biomedical Engineering, Washington University in St. Louis, ST. LOUIS, MO, United States
Synopsis
Previously, we employed diffusion fMRI to assess mouse optic nerve activation in response to flashing-light visual stimulation. Perpendicular apparent diffusion coefficient (ADC⊥) decreased independent of vascular effects. In the current study, we applied DTI and diffusion basis spectrum imaginig (DBSI) to assess human optic nerve activation with flashing checkerboard stimulation. We observed 43% and 13% decrease of DBSI λ⊥ and λǁ, respectively, but not in DTI.
Introduction
Previously, we
employed single-direction diffusion-weighted MRI, perpendicular to axonal fibers, to assess mouse optic nerve activation,
and we demonstrated that apparent diffusion coefficient (ADC⊥) decreased during
flashing-light stimulation.1 Unlike
blood-oxygen level dependent (BOLD) fMRI, the activation induced ADC⊥ decrease was independent of alterations in blood flow and more directly
associated with axonal activation.1 In a subsequent
study, we observed that the decrease in ADC⊥ was attenuated in
optic nerves affected by optic neuritis in mice.2 We speculate this is due, in part, to the
presence of inflammation confounding ADC⊥ measurements3 which may have masked
the effects of actual axonal activation.
Recently, we
performed repetitive electrical stimulation of in vitro perfused frog sciatic
nerve and reported that conventional diffusion tensor imaging (DTI) was able to
precisely localize the site of axonal conduction blockage.4
Therefore, diffusion fMRI could potentially serve as an indicator of axonal
dysfunction. In this study, we applied DTI and diffusion basis spectrum
imaginig (DBSI)5, 6 to assess human
optic nerve activation in response to flashing checkerboard stimulation.
Materials and Methods
Subject set-up: Seven healthy subjects were recruited. Three had normal vision uncorrected, and four wore contact lenses. Scans were performed on a 3T Siemens Prisma. A 64-channel head coil was used with a mirror to allow the subject to see the flashing checkerboard while in the scanner. One eye was covered by gauze and taped shut with medical tape. Imaging protocol: Whole brain MPRAGE was acquired to precisely locate the optic nerves (Fig.1A). Two image slices were adjusted perpendicular to the tested optic nerve (Fig. 1A, blue rectangles, approximately 4mm away from optic nerve head). Imaging was performed in 31 directions with 31 b-values (max b-value = 1,000 s/mm2) including one b = 0 diffusion-weighted image using inner-volume single-shot EPI:8 TR = 2.5 s, TE = 53.8 ms, Δ = 18 ms, δ = 6 ms, in-plane resolution = 1.1 x 1.1 mm, slice thickness = 4 mm, echo-train length = 30, and acquisition time = 1.26 minutes. Each diffusion fMRI measurement consisted of a series of three baseline, three stimulation (8 Hz flashing checkerboard), and three stimulation-off images (Fig. 2). Thus, three measurements were averaged for each condition. Data processing: Raw DWIs were post-processed and coregistered before DBSI-λ⊥/λǁ and DTI-λ⊥/λǁ were derived using lab-developed software. Measurement from both image slices were averaged for each subject.Results
Baseline DBSI-λ⊥ was lower and λǁ was higher than baseline DTI-λ⊥ and λǁ, respectively (Fig. 3 and 4). This suggested that DBSI minimized the confounding effects of surrounding CSF and resident cells. During visual stimulation, DBSI-λ⊥ and -λǁ were 43% (p < 0.05, Fig. 4) and 13% (p = 0.05, Fig. 4) lower than their baseline values. After stimulation, both DBSI-λ⊥ and -λǁ normalized toward the baseline value (Fig. 4 and corresponding table). Meanwhile, DTI-λ⊥ and λǁ were not changed during visual stimulation, suggesting that changes may have been masked by confounding partial-volume effects or that DTI is less sensitive to change than DBSI (Fig. 4).Conclusions
Our results demonstrated that DBSI was able to detect optic nerve activation in humans by reductions in DBSI-λ⊥ and -λǁ. DTI failed to detect these changes. DBSI holds potential to directly depict axonal activation and perhaps to identify axonal pathologies simultaneously. We believe that this is the first report of direct measurement of optic nerve axonal function in humans using diffusion MRI.Acknowledgements
This work was supported in part by NIH R01-NS047592, P01-NS059560, U01-EY025500, National Multiple Sclerosis Society (NMSS) RG 5258-A-5, RG 1701-26617, FG-1507-05315 and Department of Defense Idea Award W81XWH-12-1-0457.References
1. Spees WM, Lin TH, Song SK. White-matter diffusion fMRI of mouse optic nerve. NeuroImage 2013;65:209-215.
2. Lin TH, Spees WM, Chiang CW, Trinkaus K, Cross AH, Song SK. Diffusion fMRI detects white-matter dysfunction in mice with acute optic neuritis. Neurobiology of disease 2014;67:1-8.
3. Chiang CW, Wang Y, Sun P, et al. Quantifying white matter tract diffusion parameters in the presence of increased extra-fiber cellularity and vasogenic edema. NeuroImage 2014;101:310-319.
4. Spees WM, Lin TH, Sun P, et al. MRI-based assessment of function and dysfunction in myelinated axons. Proc Natl Acad Sci U S A 2018;115:E10225-E10234.
5. Wang Y, Wang Q, Haldar JP, et al. Quantification of increased cellularity during inflammatory demyelination. Brain : a journal of neurology 2011;134:3590-3601.
6. Wang Y, Sun P, Wang Q, et al. Differentiation and quantification of inflammation, demyelination and axon injury or loss in multiple sclerosis. Brain : a journal of neurology 2015;138:1223-1238.
7. Lin TH, Chiang CW, Perez-Torres CJ, et al. Diffusion MRI quantifies early axonal loss in the presence of nerve swelling. Journal of neuroinflammation 2017;14:78.
8. Xu J, Shimony JS, Klawiter EC, et al. Improved in vivo diffusion tensor imaging of human cervical spinal cord. NeuroImage 2013;67:64-76.
Figures
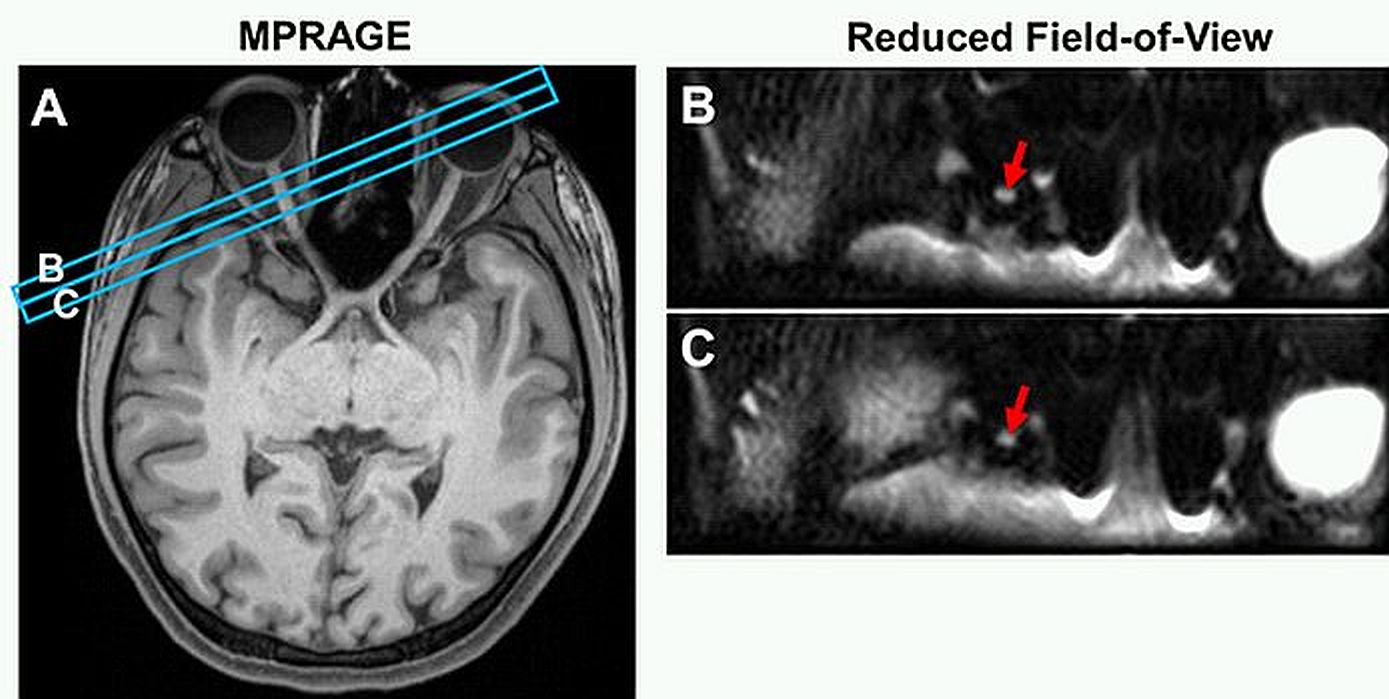
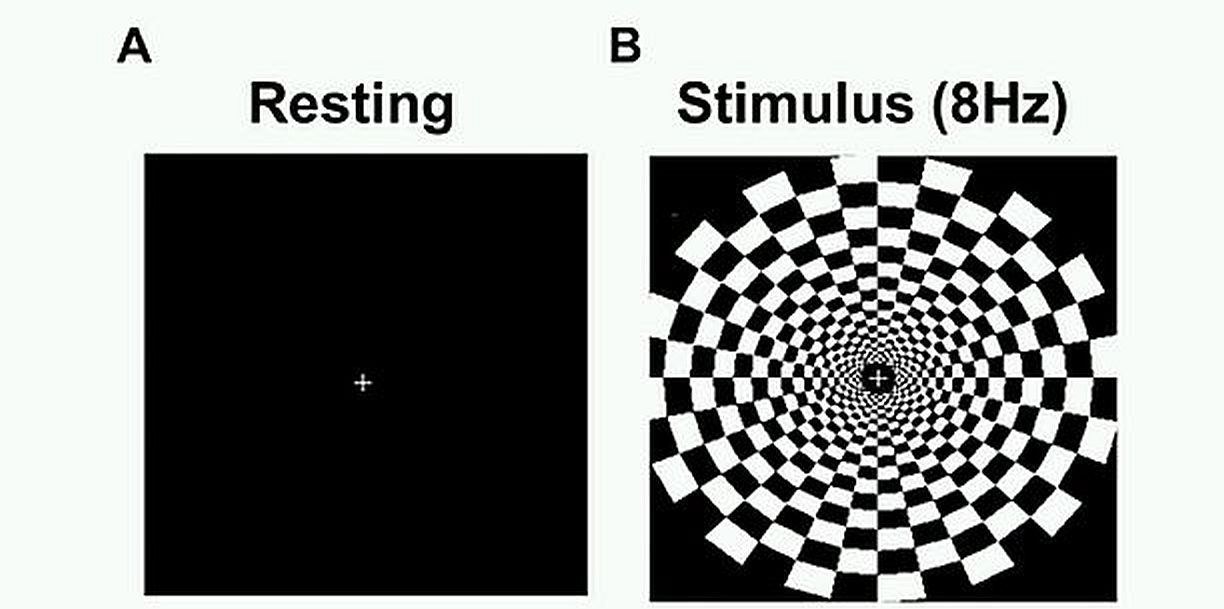
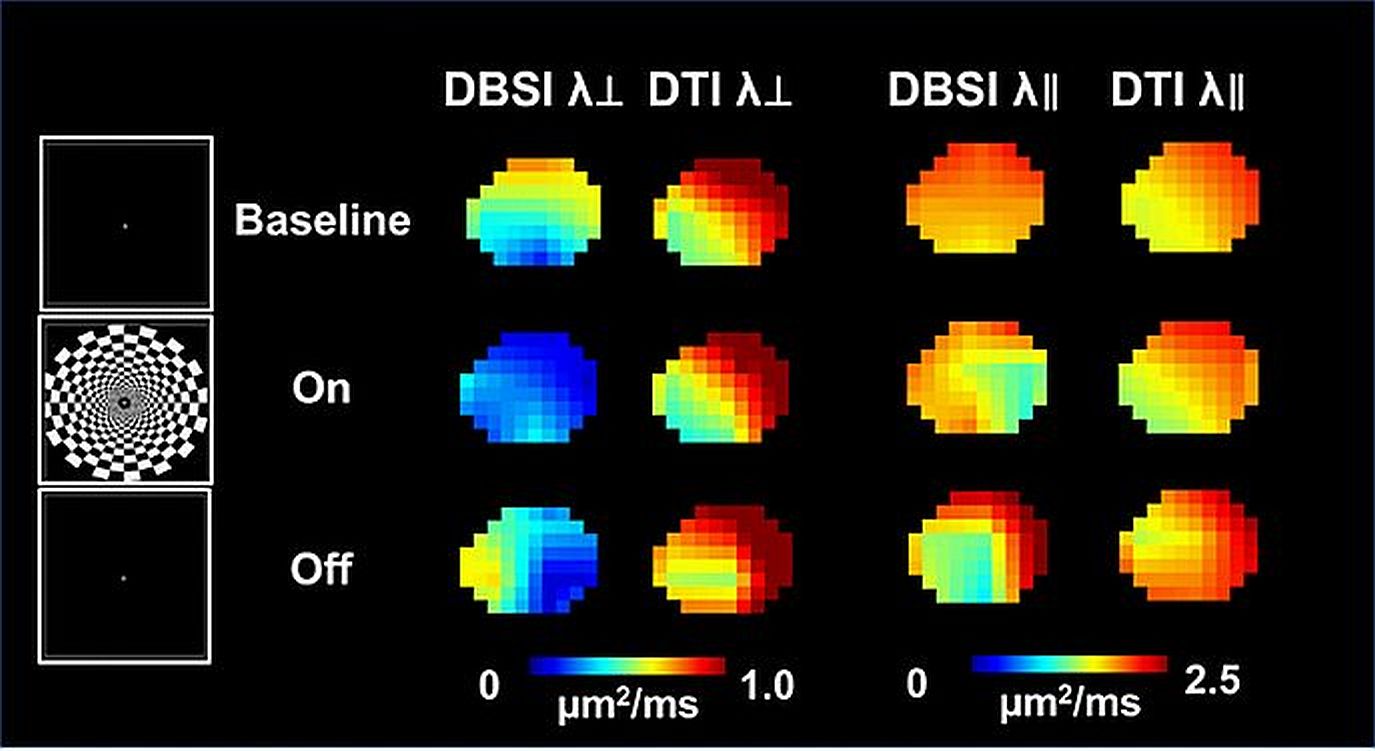
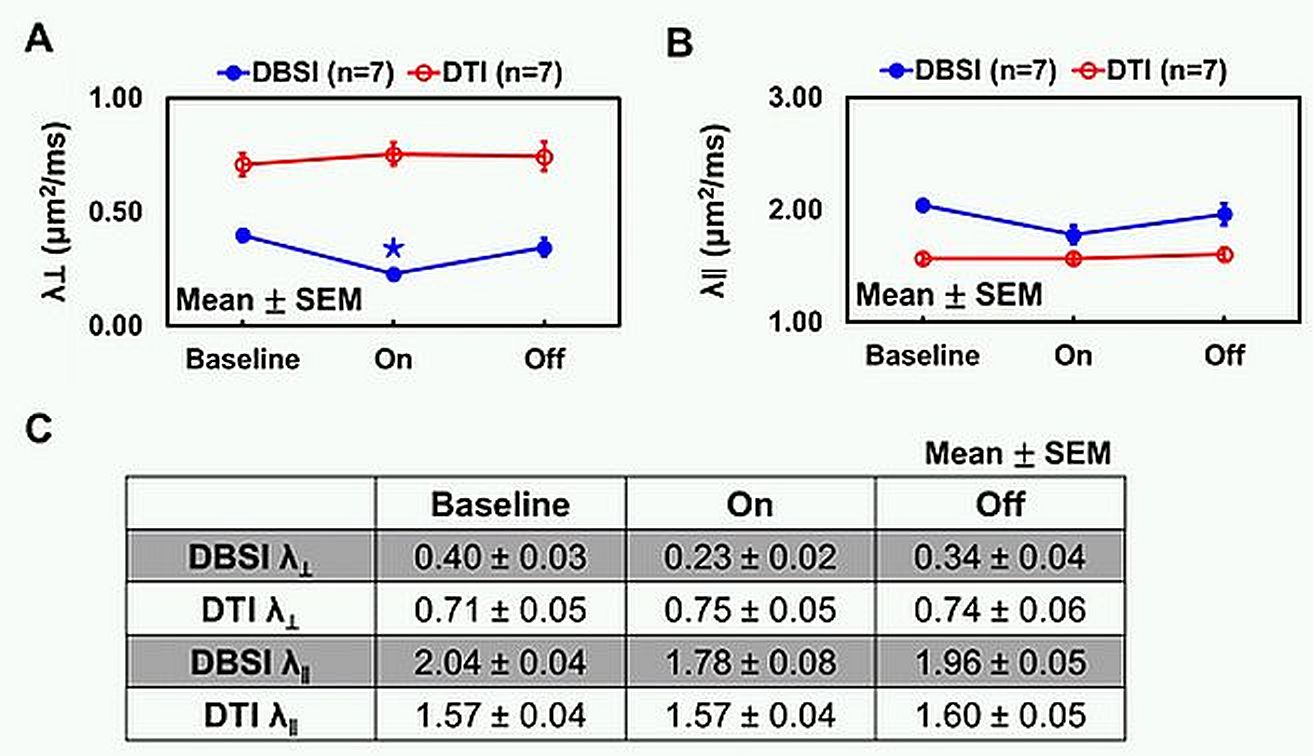
Figure 4 Quantitative data of λ⊥ (A), λ∥ (B) and corresponding table (C).
⋆ indicates p < 0.05