0995
A novel 11.7T ultra-high field dMRI connectivity atlas of the Japanese quail1CEA (Commissariat à l'Energie Atomique et aux Energies Alternatives), NeuroSpin, Gif-sur-Yvette, France, 2Université Paris-Saclay, Orsay, France, 3FLI/Noeud Paris-Sud, Orsay, France, 4CNRS IFCE Université François Rabelais Tours, INRA (Institut national de la recherche agronomique), Nouzilly, France, 5Université Grenoble Alpes, GIN (Grenoble Institut des Neurosciences), Grenoble, France, 6Beauval Nature, ZooParc de Beauval, Saint-Aignan, France
Synopsis
Despite the existence of several structural atlases of avian brains, few of them address the bird structural connectivity. In this study, a novel atlas of the structural connectivity is proposed for the Japanese quail, aiming at investigating two lines: the short and the long tonic immobility lines. Using high resolution T2-weighted MRI and ultra-high field diffusion MRI, the connectivity of both lines was investigated, showing the existence of structural differences between the connectivity patterns characterizing the two lines. Thus, the link between their specific behaviors facing fear and their underlying anatomical substrates reached a better understanding.
Introduction
Despite the existence of atlases of avian brain structures1,2,3, few of them address their anatomical connectivities4. The Japanese quail (Coturnix Japonica) is a little nidifugous bird that presents a quantifiable response to fear called tonic immobility5,6, leading to two short tonic immobility (STI) and long tonic immobility (LTI) lines. Little is known about the main circuits controlling birds’ behavior7 to understand the differences between STI and LTI emotional circuits. To unveil the link between behavior and neuroanatomy, this work is focused on the creation of a novel atlas of the Japanese quail structural connectivity using ultra-high field (UHF) diffusion-weighted magnetic resonance imaging (dMRI).Materials and methods
Japanese quail cohort – 21 male and sexually mature Japanese quails, including 11 LTI and 10 STI subjects, were scanned post mortem. After being perfused using a 4% paraformaldehyde (PFA) solution, the heads were collected and conserved in PFA for two months. Heads hydration in a 0.1M phosphate buffered saline solution was required before scanning.
MRI protocols – The subjects were scanned with a preclinical Bruker 11.7T MRI scanner equipped with a strong gradient set (Gmax=780mT/m, slew-rate=9500T/m/s) and using a 40mm Bruker 1H transmit-receive volume coil. The imaging protocol included a T2-weighted spin echo (SE) sequence with the following parameters: isotropic 150μm resolution, TE=16ms, TR=9000ms, 8 averages, 1 repetition; and a dMRI 3D segmented echo planar imaging sequence, using a Pulsed Gradient Spin Echo scheme with the following parameters: isotropic 200μm resolution, TE=23.88ms, TR=250ms, b= 4500s/mm2, 75 directions, δ=5ms, Δ=12.3ms.
Post-processing
–
A
dedicated
post-processing
pipeline was developed to analyze the data and establish the
connectivity atlas. No preprocessing was required thanks to the use
of a multishot dMRI sequence that helped compensating for
susceptibility and eddy current artifacts, as well as the high SNR
level of diffusion
data (SNR=13).
The
analytical
Q-ball (aQBI)8
and diffusion tensor imaging
(DTI)
models
were
used to map the local orientation and
obtain the orientation diffusion function (ODF) maps
of the diffusion process in
addition to
quantitative DTI-based measures from
the diffusion
dataset.
A
streamline
regularized deterministic tractography available in Connectomist9
was used
to infer the connectivity in each individual from
its ODF map using
the following parameters: step 50μm,
aperture angle 30°, 8 seeds per voxel, regularization factor of
0.12.
At
the individual scale, the reconstructed fibers were
subdivided into fiber clusters or fascicles using the approach
previously
detailed9,
and
resulting
in
a map
of
centroids representative
of the fiber clusters.
In
order to bring the individuals into
a common space,
birds’
brains were reoriented using their
anterior and
posterior commissures
(AC-PC),
instead
of a
reorientation based on the midline
of their
beaks10.
Therefore,
a
template space was
defined from the subject TQ being the closest to the others,
resulting
from the
scaling criterion $$$TQ
= argmin_{j} \sum_{i=1, i\neq j}^N \sqrt{S{x_i}^2 + S{y_i}^2 + S{z_i}^2}$$$
using
affine transformations between brains. Sx,
Sy, Sz correspond
to the scaling parameters along
the x, y and z axes between
two quails i and j. A
second
clustering step was
used to match
centroid
clusters
across subjects, giving
clusters
of centroid
clusters in
the previously defined AC-PC template space. Ultimately, labeled inter-subject
clusters led to the target atlas
of the Japanese quail connectivity.
Results and discussion
The
anatomical SE scans displayed on Figure 1 revealed a suitable
contrast between gray and white matter structures allowing to
accurately delineate a brain mask as well as its anatomical
structures. Similarities with other birds (canary, pigeon, zebra
finch and starling) were exploited to enhance the segmentation
process. The tractogram in Figure 2 pointed out relevant white
matter bundles, specifically those of the cerebellum. Figure 3
depicted a primal level of connectivity, containing 21237 fascicles
on average with a standard deviation of 3404 fascicles between all
quails. The inter-subject fiber
clustering of the LTI lineage, as presented in Figure 4, included 50
groups of fiber clusters. A closer look at the fibers revealed a larger number of connections for both lines. The connections were analyzed by a
neuroanatomist to establish the first Japanese quail connectivity
atlas showed in Figure 5. It included well known white matter
bundles such as the optic tract, the cerebellar peduncles, and the anterior
commissure. A disparity of the number of clusters between the STI
(137) and LTI (239) lines was noticed,
advocating for a strong difference of their structural
connectivities.Conclusion
Through this study, we showed that UHF dMRI enabled the design of the first Japanese quail connectivity atlas, displaying significant differences between the STI and LTI lines. This work paves the way to a better understanding of how the anatomical structures of the Japanese quail communicate and how this communication regulates its emotional behaviors.Acknowledgements
This study received funding from the Centre-Val de Loire regional council (Neuro2Co, France), Beauval Nature and from the European Union’s Horizon 2020 Framework Program for Research and Innovation (Grant Agreement No 720270, Human brain Project SGA2).References
1. Vellema M, et al. A Customizable 3-Dimensional Digital Atlas of the Canary Brain in Multiple Modalities. NeuroImage, 2011; 57(2):352-361.
2. Güntürkün O, et al. A 3-Dimensional Digital Atlas of the Ascending Sensory and the Descending Motor Systems in the Pigeon Brain. Brain Structure & Function, 2013; 218(1):269-281.
3. De Groof G, et al. A Three-Dimensional Digital Atlas of the Starling Brain. Brain Structure & Function, 2016; 221(4):1899-1909.
4. Güntürkün O, Stacho M and Ströckens F. The Brains of Reptiles and Birds. Evolution of Nervous Systems, 2017; 2(1):171-221.
5. Mills AD and Faure JM. Divergent Selection for Duration of Tonic Immobility and Social Reinstatement Behavior in Japanese Quail (Coturnix Coturnix Japonica) Chicks. Journal of Comparative Psychology (Washington, D.C. : 1983), 1991; 105(1):25-38.
6. Bryan Jones R, et al. Restraint, Fear, and Distress in Japanese Quail Genetically Selected for Long or Short Tonic Immobility Reactions. Physiology & Behavior, 1994; 56(3):529-534.
7. Saint-Dizier H, et al. Subdivisions of the Arcopallium/Posterior Pallial Amygdala Complex Are Differentially Involved in the Control of Fear Behaviour in the Japanese Quail. Brain Research Bulletin, 2009; 79(5):288–295.
8. Descoteaux M, et al. Regularized, fast, and robust analytical Q-ball imaging. Magnetic Resonance in Medicine, 2007; 58(3):497-510.
9. Guevara P, et al. Robust Clustering of Massive Tractography Datasets. NeuroImage, 2011; 54(3):975–99.
10. Karten HJ and Hodos W. A Stereotaxic Atlas of the Brain of the Pigeon (Columba Livia). The Johns Hopkins Press (Baltimore, Maryland), 1967.
Figures
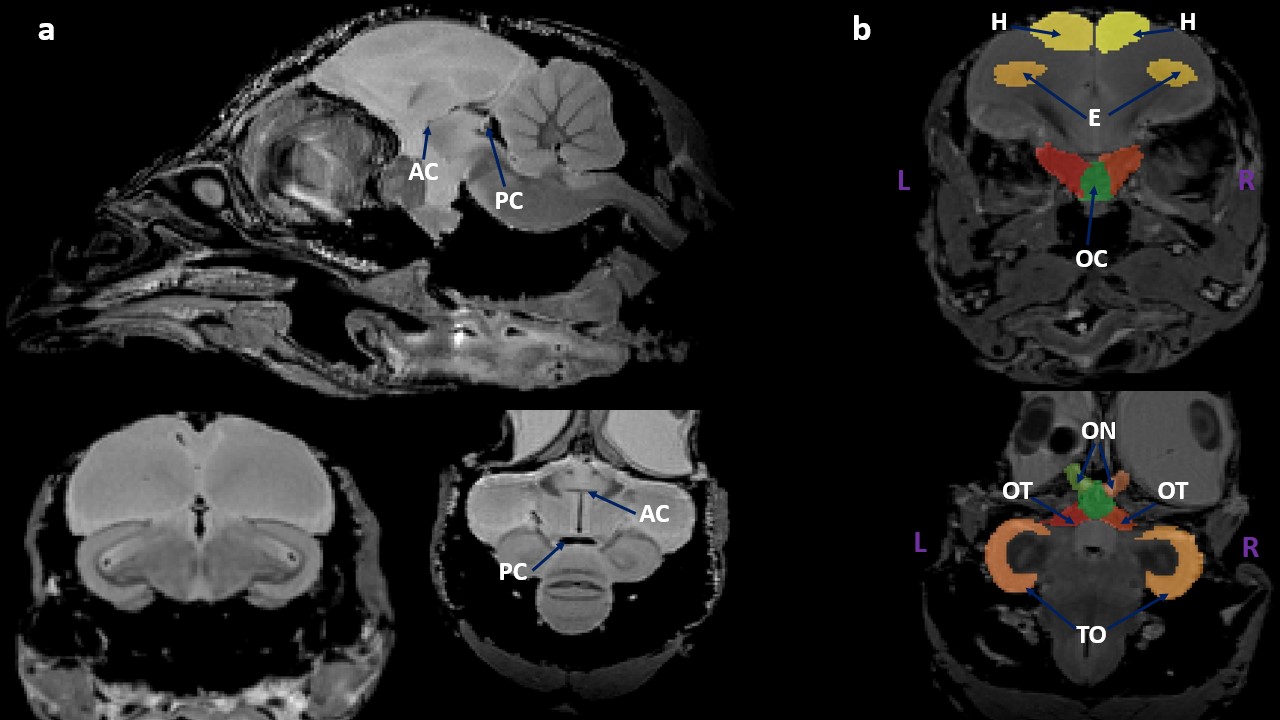
Anatomical images of sample 7419 STI in its AC-PC frame with an isotropic 150μm resolution: (a) in the sagittal, coronal and axial views showing the anterior commissure (AC) and the posterior commissure (PC); (b) the manual segmentation of the brain structures contributing to the visual system of the Japanese quail in the coronal and axial views.
We can observe here the brain structures involved in the visual system of the Japanese quail: the entopallium (E), the hyperpallium (H), the optic chiasma (OC), the optic nerves (ON), the optic tract (OT), and the tectum opticum (TO).
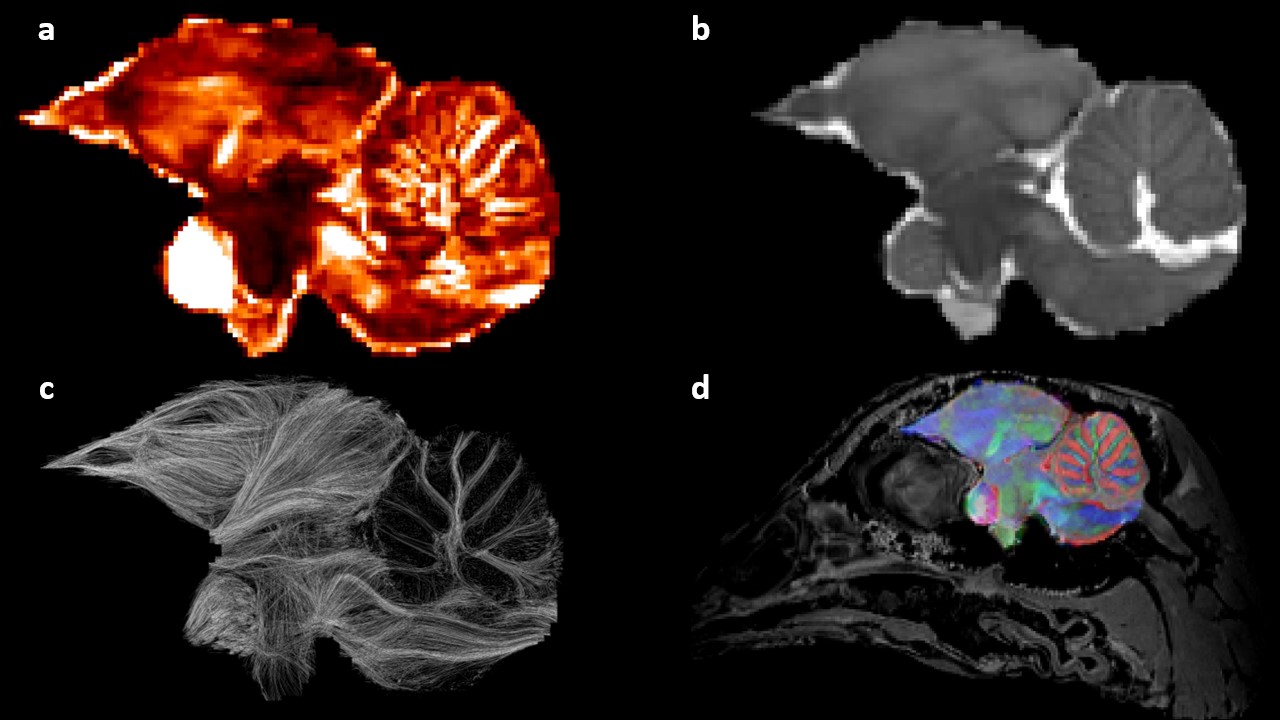
Results of the post-processing step for the brain mask of sample 7180 LTI reoriented in its AC-PC frame: (a) the fractional anisotropy; (b) the apparent diffusion coefficient; (c) the tractogram stemming from a streamline regularized deterministic algorithm; (d) the fusion of the isotropic 150μm resolution anatomical image and a color-encoded diffusion directions map coming from the DTI model.
The full brain reorientation requires the coordinates of three points: the anterior commissure, the posterior commissure, and another point chosen on the interhemispherical line.
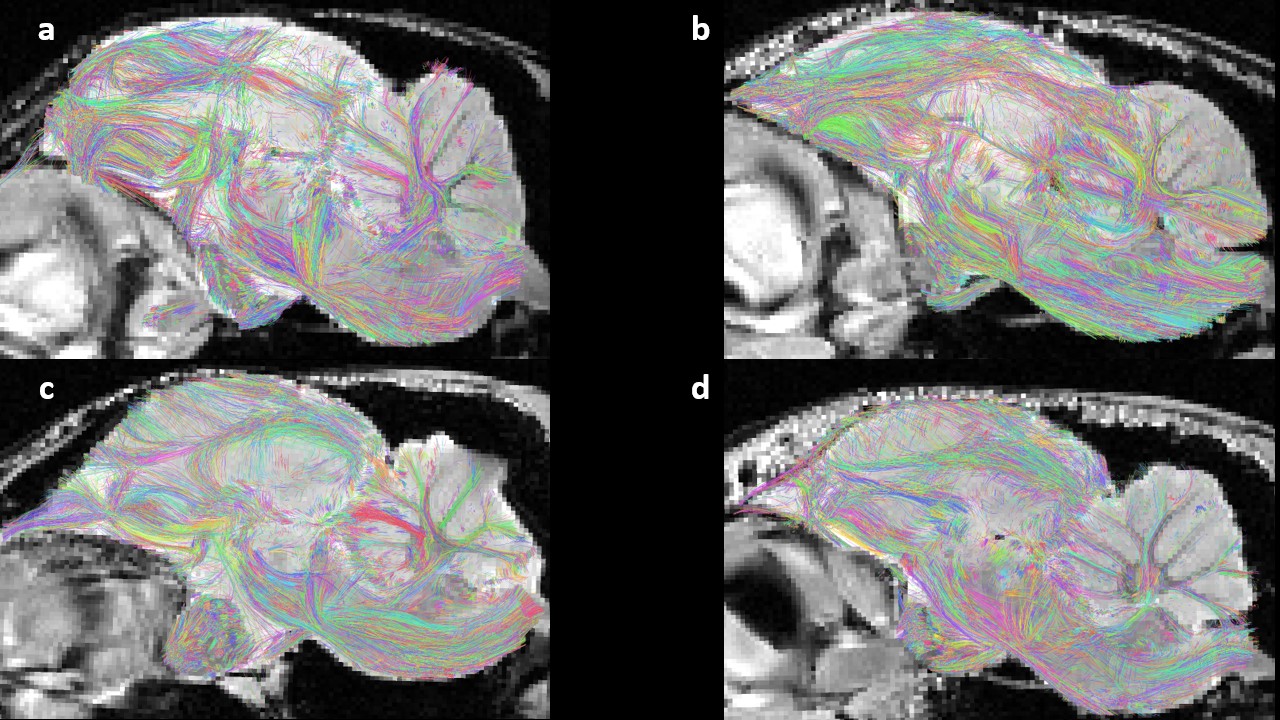
Results of the intra-subject fiber clustering for both lines on their own anatomical images at an isotropic 150μm resolution : (a) sample 7412 STI; (b) sample 7419 STI; (c) sample 7147 LTI; (d) sample 7157 LTI.
The outcome of the intra-subject fiber clustering step offers a visual comparison between subjects since it corresponds to the extraction of geometrically coherent fibers at the individual scale. Therefore, we may observe the existence of similar fascicles between individuals of a same lineage, encouraging the next clustering step.
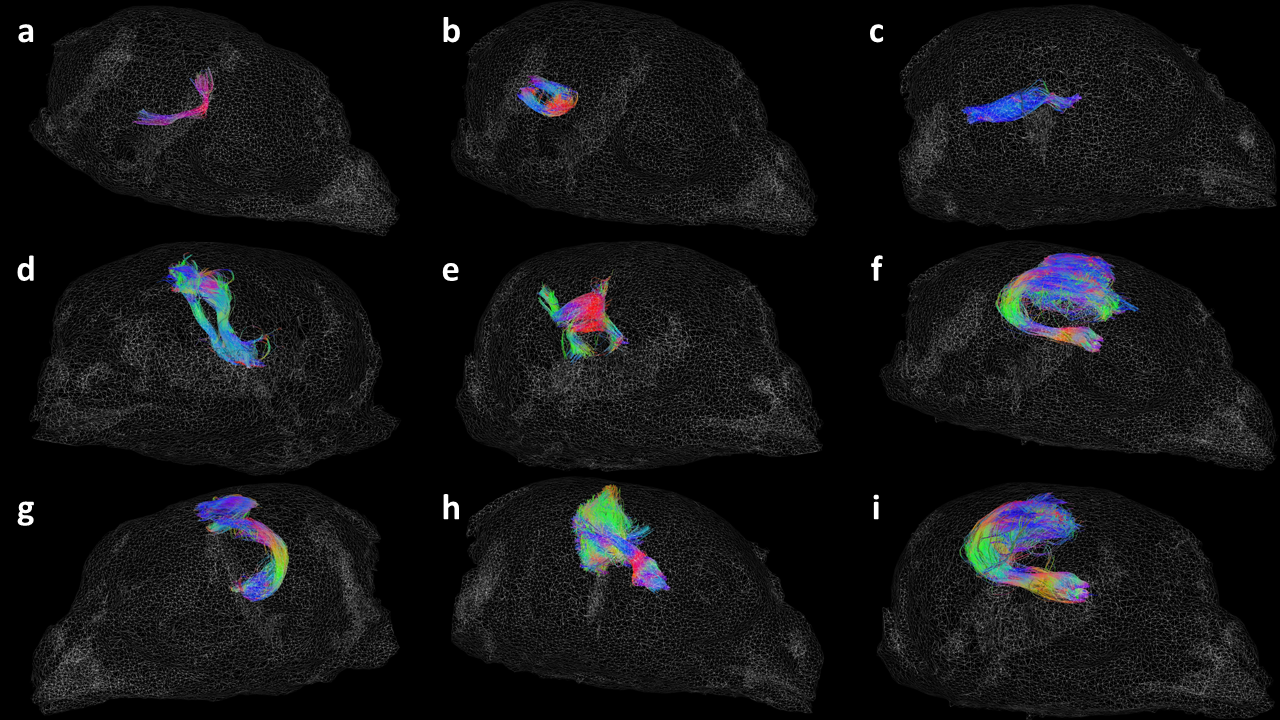
Results of the LTI inter-subject fiber clustering showing nine different long fibers on a 3D mesh image of sample 7157, including: (a) the anterior commissure; (b) the cerebellar peduncles; (c) the optic tract; (d) the descending motor pathway.
The quail 7157 LTI was found to be the TQ subject of its line. Thus, all the other LTI subjects were reoriented in its AC-PC frame. The coherent fibers are represented by centroids in different colors to highlight the small anatomical fascicles they belong to and the fiber direction.
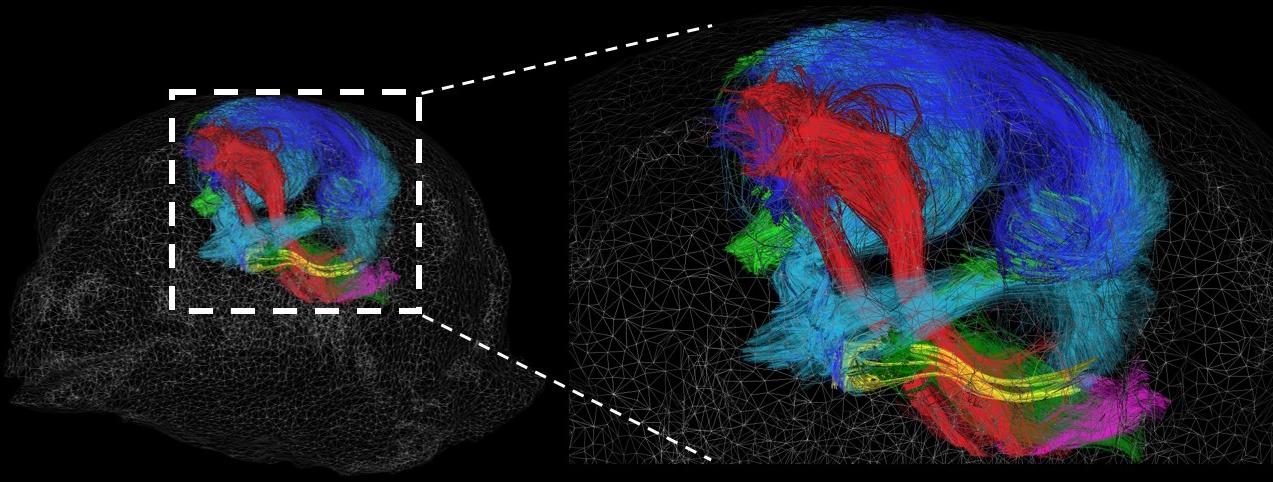
The structural connectivity atlas of the Japanese quail showing major tracts: the descending motor pathway (red/pink); the ascending somesthetic pathway (light green); ascending and tectofugal visual/auditory pathways (light blue); the somatosensory pathway (dark green); thalamic projections (yellow); amygdala-hippocampal pathways (arcopallium/pallial amygdala) (dark blue).
More specific tracts to the Japanese quail can be found if we optimize the labeling of the brain structures defined by the segmentation process. Thus, the building of a complete morphological atlas based on histological analyses of the Japanese quail was instrumental in the accurate brain structure labeling.