0994
Simultaneous T1, T2 and ADC Mapping in Prostate Cancer and BPH using STimulated-Echo based Mapping (STEM)1Medical Physics, University of Wisconsin Madison, Madison, WI, United States, 2Radiology, University of Wisconsin Madison, Madison, WI, United States, 3Mechanical Engineering, University of Wisconsin Madison, Madison, WI, United States, 4Biomedical Engineering, University of Wisconsin Madison, Madison, WI, United States
Synopsis
A method for simultaneous T1, T2 and Apparent Diffusion Coefficient (ADC) mapping, STimulated-Echo based Mapping (STEM), has been proposed to achieve rapid and co-registered multi-slice T1, T2 and ADC maps within a moderate scan time. In this study, the STEM method is optimized for prostate imaging and evaluated in 16 patients with suspected prostate cancer (PCa) or benign prostatic hyperplasia (BPH). T1, T2 and ADC maps were successfully estimated and compared among BPH, PCa and healthy prostate tissues.
Introduction
Quantitative multi-parametric MRI may enable improved diagnosis and treatment monitoring of prostate cancer and other prostatic diseases1-4. A method for simultaneous T1, T2 and Apparent Diffusion Coefficient (ADC) mapping, STimulated-Echo based Mapping (STEM), has been proposed5 to achieve rapid and co-registered multi-slice T1, T2 and ADC maps within reasonable scan time. The accuracy and reproducibility of STEM acquisitions have been evaluated in phantoms, brain and prostate in healthy volunteers in a previous study5. However, its ability to differentiate cancer from non-neoplastic tissue in patients needs to be further evaluated. In this study, the STEM method5 is optimized for prostate imaging and evaluated in patients with suspected prostate cancer (PCa) or benign prostatic hyperplasia (BPH).Methods
Protocol Optimization: In order to determine STEM acquisition parameters, the choice of mixing-time (TM), echo-time (TE) and b-values was formulated as a minimax optimization problem of the Cramér-Rao Lower Bound (CRLB)-based standard deviation of the resulting T1, T2 and ADC estimates5. The range of T1, T2 and ADC values for the optimization were selected as 600 to 2000ms, 50 to 200ms and 800 to 1700 10-6mm2/s, respectively, to cover the values commonly observed in prostate imaging2-4,6. The optimization also included constraints on scanner configuration as well as the achievable TM, TE and b-values. The minimum b-value was set as 100s/mm2 (similar to our local clinical DWI protocol) to avoid potential IVIM effects.
Patient Evaluation: After IRB approval and informed written consent, 16 patients with suspected PCa and/or BPH were recruited to evaluate the T1, T2 and ADC values from STEM acquisitions. STEM acquisitions were performed with in-plane resolution = 2mm$$$\times$$$2mm, slice thickness = 4.8mm, acquisition bandwidth = $$$\pm$$$62.5kHz, TR=4s, diffusion direction = three orthogonal directions and parallel imaging factor = 2 with partial Fourier acquisition. The overall scan time is 3 minutes and 56 seconds for STEM.
T1 relaxation, T2 relaxation and ADC maps, are jointly estimated by voxel-wise non-linear least-squares fitting of the following equation: $$S=A(1-e^{\frac{-TR_{eff}}{T1}})e^{-\frac{TM}{T1}}e^{-\frac{TE}{T2}}e^{-bADC}$$, where $$TR_{eff}=TR-TM-\frac{TE}{2}$$.
ROIs were drawn in the healthy peripheral zone (PZ), healthy central gland (CG), PCa and BPH respectively for each patient. Two-sample t-test was applied without assuming equal variance to evaluate the difference of measurements between lesion and healthy tissue.
Results
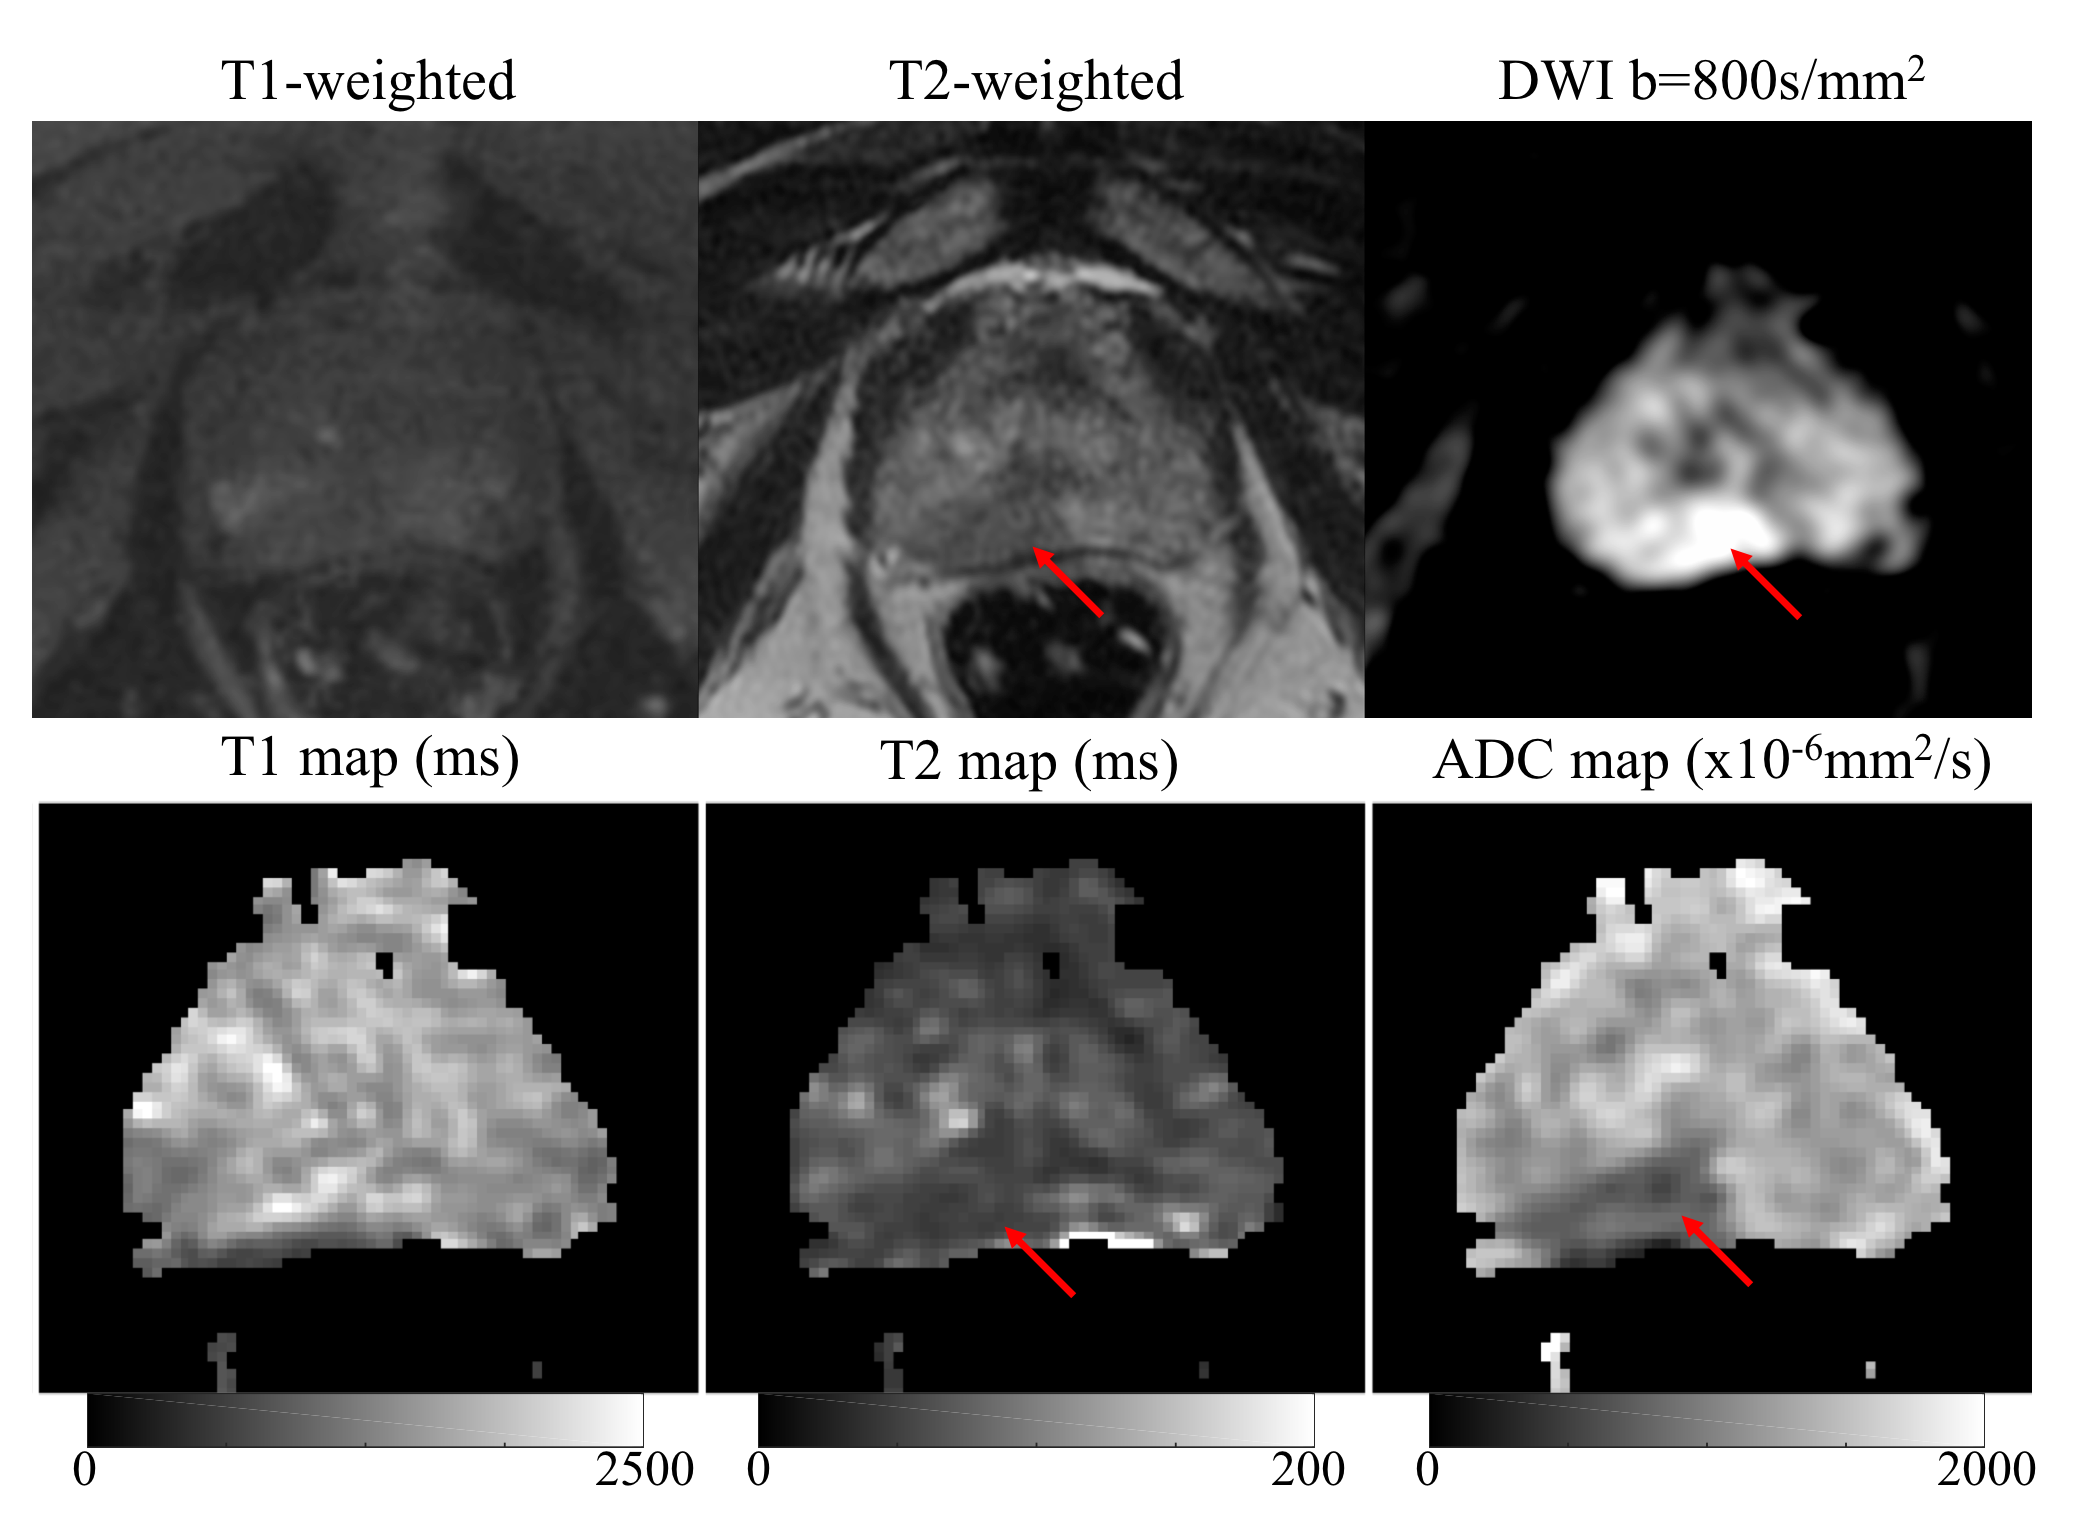
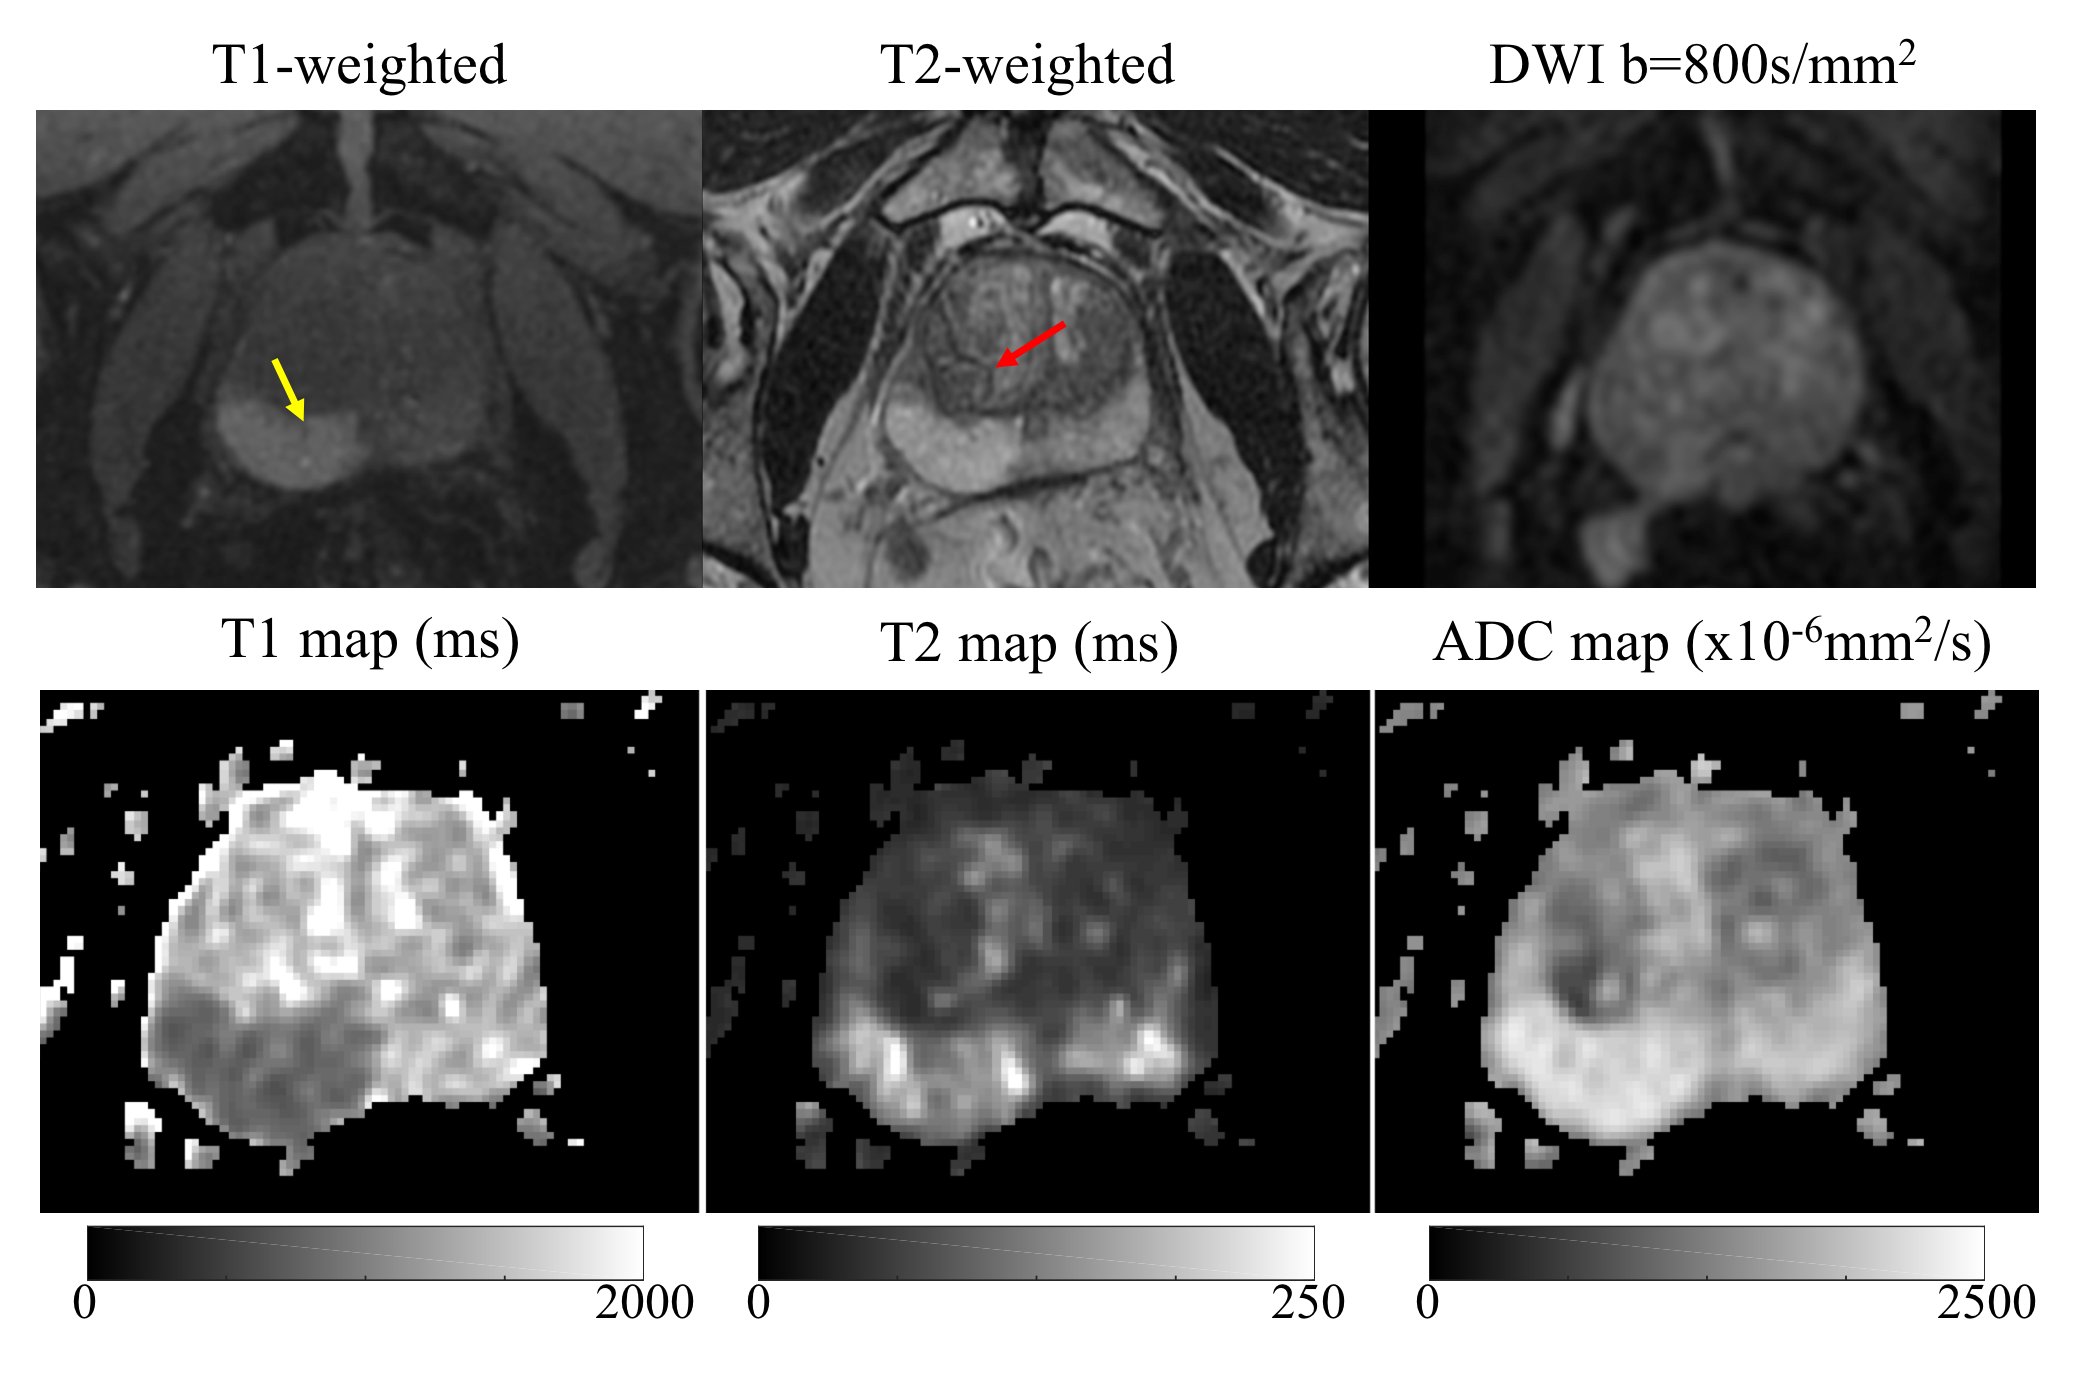
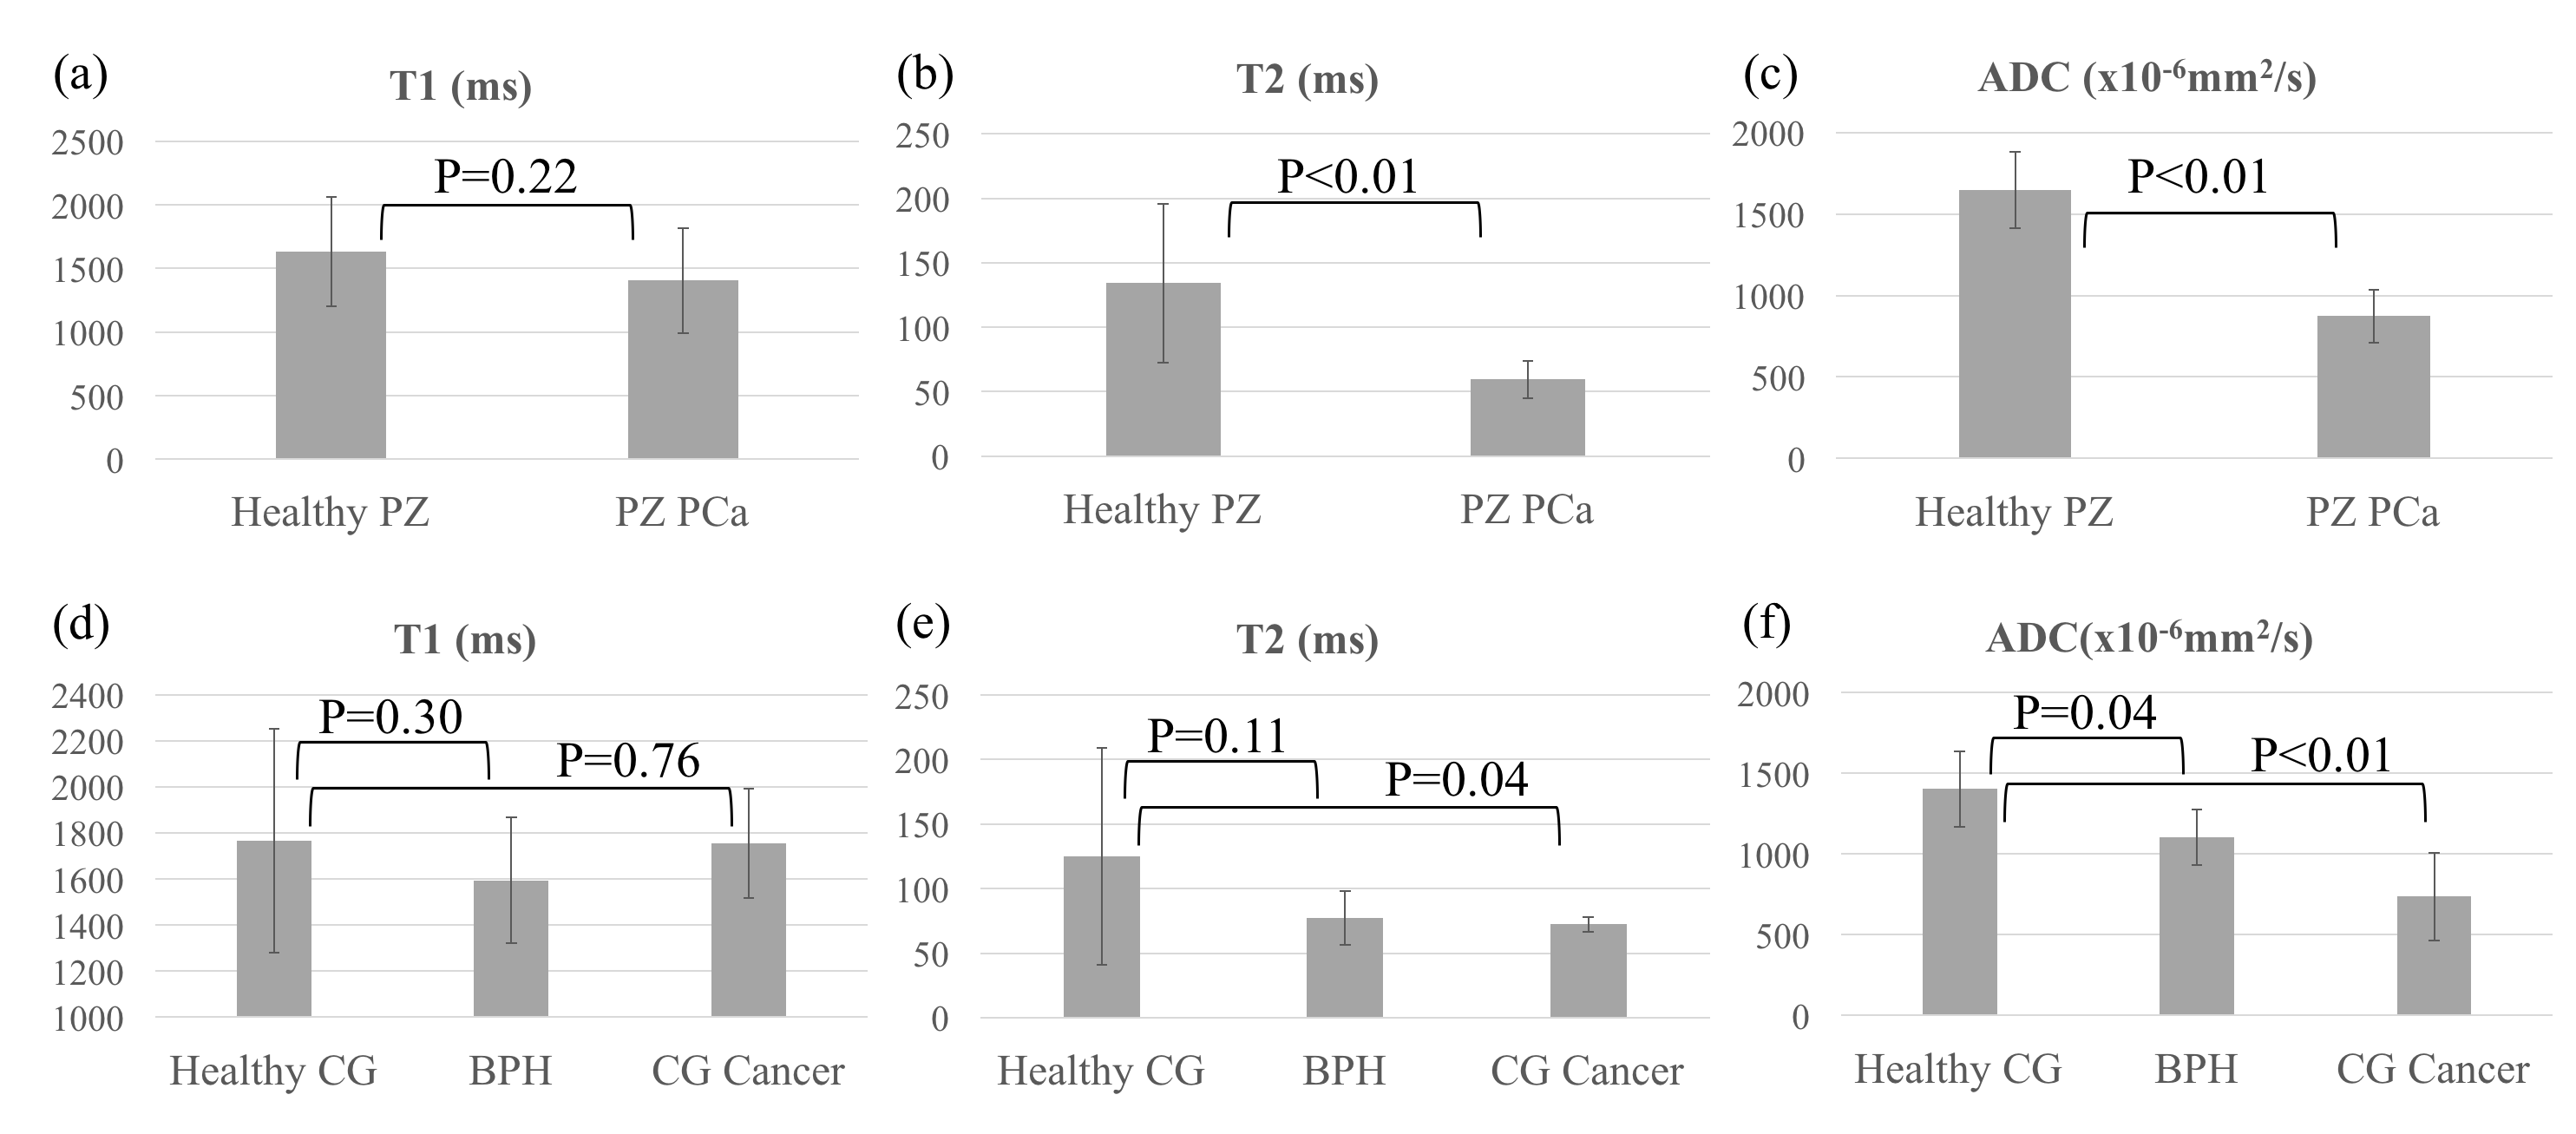
Based on the protocol optimization and scanner limitations, STEM acquisitions were performed with four TE, TM and b-value combinations shown in Table 1. Among 16 patients, seven patients had PCa in the PZ, two had PCa in the CG and nine had BPH-related changes, based on imaging evaluation by a radiologist experienced in prostate imaging and MRI. Example T1, T2 and ADC maps of two patients are shown in Fig.2 and Fig.3. Average and standard deviation of ROI measurements are shown in Fig.4 to compare the difference in T1, T2 and ADC values among healthy tissue, PCa and BPH.Discussion
In this study, we have evaluated the T1, T2 and ADC maps of patients with known or suspected PCa or BPH, acquired with the STimulated-Echo based Mapping (STEM) method. The quantitative measurements in this study agree with previous studies2-3,6. Both T2 and ADC values are lower in the PZ cancer compared to healthy PZ (p<0.01). The difference in T1 values between PZ cancer and healthy PZ is not significant (p=0.22) and varies among patients. In the central gland, BPH and cancer have lower T2 and ADC measurements compared to healthy tissue. However, the number of patients in this ongoing study is still small. Evaluation on a larger number of patients is needed to fully characterize the STEM-measured T1, T2 and ADC in PCa and BPH.Conclusion
In conclusion, STEM enables characterization of the prostate, including healthy tissue and lesions, by providing co-registered T1, T2 and ADC maps.Acknowledgements
The authors would like to acknowledge research support from GE Healthcare. The authors acknowledge grant support from NIH-NIDDK Wisconsin Multidisciplinary K12 Urologic Research Career Development Program K12DK100022 (PD: D. Bjorling).References
[1] Foltz WD, Wu A, Chung P, et al. (2013). Changes in apparent diffusion coefficient and T2 relaxation during radiotherapy for prostate cancer. J Magn Reson Imag 2013;37(4):909-916.
[2] Gibbs P, Tozer DJ, Liney GP, Turnbull LW. Comparison of quantitative T2 mapping and diffusion‐weighted imaging in the normal and pathologic prostate. Magn Reson Med 2001;46(6):1054-1058.
[3] Langer DL, van der Kwast TH, Evans AJ, Trachtenberg J, Wilson BC, Haider MA. Prostate cancer detection with multi‐parametric MRI: Logistic regression analysis of quantitative T2, diffusion‐weighted imaging, and dynamic contrast‐enhanced MRI. J Magn Reson Imag 2009; 30(2):327-334.
[4] Yu AC, Badve C, Ponsky LE, et al. Development of a Combined MR Fingerprinting and Diffusion Examination for Prostate Cancer. Radiology 2017;283(3):729-738.
[5] Zhang, Y., Wells, S.A. and Hernando, D., 2018. Stimulated echo based mapping (STEM) of T1, T2, and apparent diffusion coefficient: validation and protocol optimization. Magnetic resonance in medicine.
[6] De Bazelaire CM, Duhamel GD, Rofsky NM, Alsop DC. MR imaging relaxation times of abdominal and pelvic tissues measured in vivo at 3.0 T: preliminary results. Radiology. 2004 Mar;230(3):652-9.
Figures