0988
Preliminary application of Three-Dimensional Multifrequency MR Elastography for the Prostate Disease1Department of Radiology, The third affiliated hospital of Sun Yat-sen University, Guangzhou, China, 2MR Research China, GE Healthcare, Beijing, China, 3Department of Radiology, Mayo Clinic, Rochester, Armenia
Synopsis
Prostate cancer (PCa) is the second leading cause of cancer deaths among males in the in the United States. Early detection of clinically significant PCa is a major challenge. MR elastography (MRE) is a noninvasive technique capable of quantifying the mechanical properties of tissue and has shown promising results in the detection and localization of PCa. Our results show that transpelvic three-dimensional (3D) MRE using a pelvic wall driver could be successful performed in the prostate at the frequencies of 60 Hz and 90 Hz and can provide a potential quantitative biomarker to evaluate prostate diseases.
Introduction
Multiparametric magnetic resonance imaging (mp-MRI) has shown considerable promise in the detection, localization and staging of prostate cancer (PCa)1. However there are still cases where the differential diagnosis of benign and malignant lesions remain challenging. MR elastography (MRE) is a noninvasive method for measuring the mechanical properties of tissue and has the potential to provide new information for improving the diagnosis of PCa2-4. The aim of this study was to evaluate the feasibility of transpelvic 3D MRE of the prostate at the frequencies of 60 Hz and 90 Hz and assess the diagnostic performance of 3D MRE for PCa.Methods
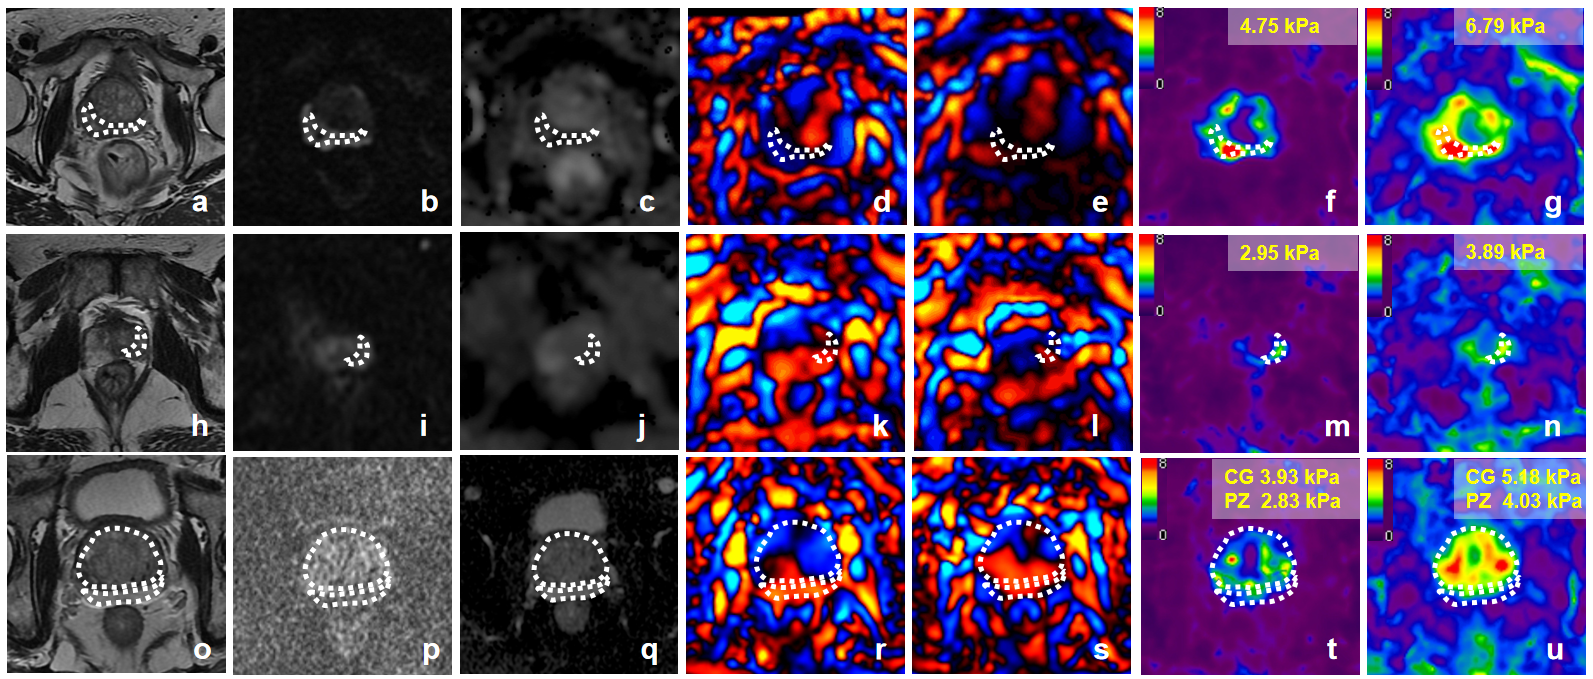
Our institutional review board approved this retrospective study. A total of 121 patients underwent mp-MRI and prostate MRE using a pelvic wall driver developed by Mayo Clinic. Out of these patients, 80 patients were excluded for the following reasons: no histopathological findings (n = 77), previous endocrine therapy (n=1), undetected lesion on conventional MRI (n = 1), and failure of the MRE exam (n = 1). Thus, the final study population comprised 41 patients. Out of these patients, 16 patients had pathologically confirmed, clinically significant PCa (Gleason scores were 7 for 5 patients, 8 for 6, 9 for 3, and 10 for 2), 7 patients had prostatitis and 18 patients had benign prostatic hyperplasia (BPH). All MRI examinations were performed using a 3.0-T scanner (Discovery MR750; GE Healthcare, Waukesha, WI). MRE images were performed with a free-breathing, multi-slice, single-shot, flow-compensated, spin-echo EPI MRE sequence using 60-Hz and 90-Hz vibrations. The acquisition parameters were as follows: repetition time/echo time: 1650/56.3 ms; field of view: 24×24 cm; acquisition matrix: 80×80 (reconstructed to 256×256) and twenty 3-mm slices with 1-mm gap. Stiffness maps were obtained using a direct inversion algorithm. Regions of interest (ROIs) were placed on proven PCa, prostatitis, and the peripheral zone (PZ) and central zone (CZ) in BPH on the basis of mp-MRI images and the pathological findings. Then, these ROIs were copied to the same part of the prostate in the MRE elastograms to report the mean stiffness in kilopascals (kPa). One-way analysis of variance tests were performed for the multiple comparison of the stiffness of all the tissue types. The performance of stiffness for differentiating PCa from the other tissue types was evaluated with receiver operating characteristic curve analysis. A P value <0.05 was considered statistically significant.
Results
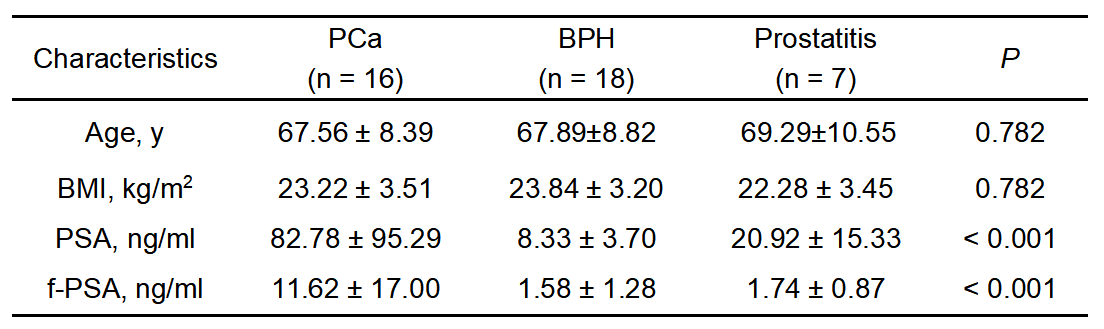
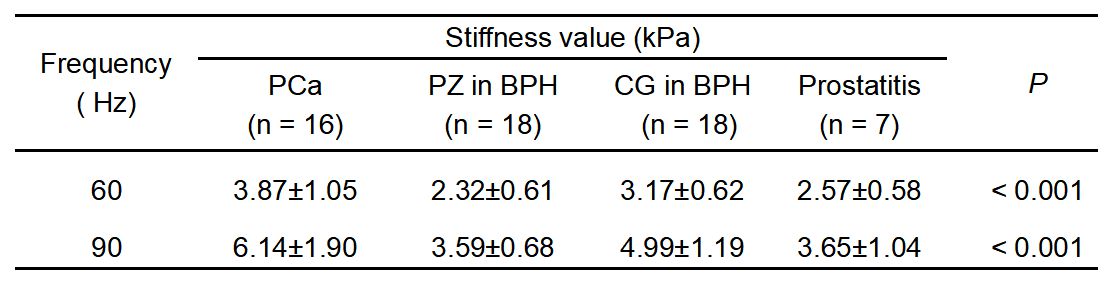
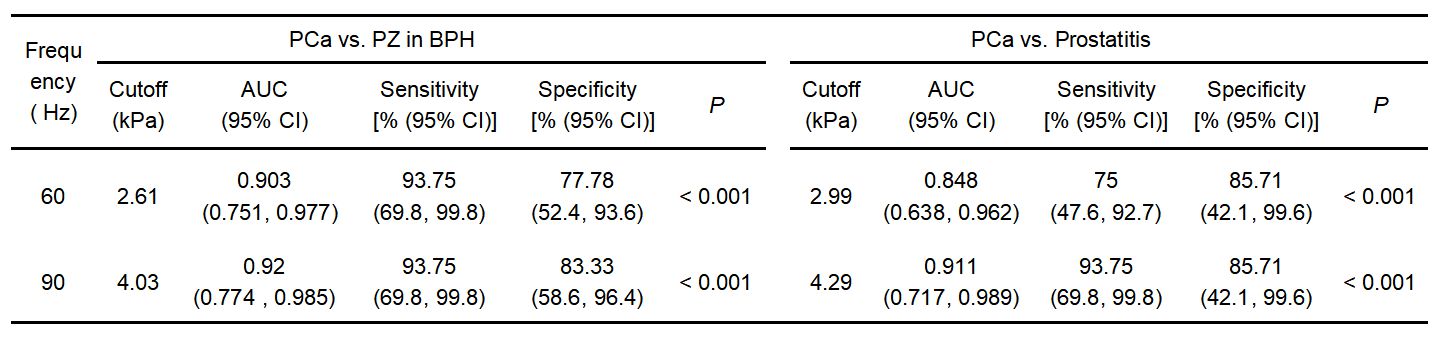
A summary of patient characteristics is shown in Table 1. The tissue stiffness was significantly different between PCa, prostatitis, PZ in BPH and CZ in BPH at 60 Hz and 90 Hz (P<0.001 for each frequency) (Figure 1, Table 2). PCa stiffness was significantly higher at 60 and 90 Hz than that of PZ in BPH (P < 0.001 and P < 0.002, respectively) and prostatitis (P = 0.002 and P = 0.001, respectively). There was no significant difference found between PCa and CG in BPH at 60 Hz and 90 Hz (all P > 0.05). PCa stiffness at 60 Hz and 90 Hz were significantly correlated with tumor volume (r = 0.656, P = 0.006 and r = 0.606, P = 0.013, respectively). However, there was no correlation between the stiffness value of PCa and PSA (all P > 0.05), age (all P > 0.05) or Gleason score (all P > 0.05). Table 3 demonstrates the results of the ROC analyses of the stiffness for differentiating PCa from prostatitis and PZ in BPH. The stiffness at 90 Hz tended to show higher diagnostic efficacy than 60-Hz stiffness, though without statistical significance: AUC = 0.911 vs. 0.848 (P = 0.669) and AUC = 0.920 vs. 0.903 (P = 0.111), for differentiating PCa from prostatitis and PZ in BPH, respectively.Discussion
Our preliminary study results show that transpelvic 3D MRE using a pelvic wall driver could be successfully performed in the prostate at 60 Hz and 90 Hz and that PCa had a higher stiffness than PZ in BPH and prostatitis. Similar results have been reported that PCa is stiffer than the surrounding benign tissue in PZ and when PCa was with lymph node metastasis5-8. Several pathological factors may contribute to the increased stiffness of PCa, including destruction of the glandular architecture, high cellularity, increased microvascularization and increased collagen deposition9-11. This study showed that trans-pelvic MRE, at vibration frequencies of 60 and 90 Hz, can be as a potential method to discriminate clinically significant PCa from benign prostatic diseases, the higher diagnostic performance was observed at 90 Hz.Conclusion
In conclusion, transpelvic 60- and 90-Hz 3D MRE using a pelvic wall driver was successfully performed in the prostate. The tissue stiiffness by MRE may be a potential quantitative biomarker to evaluate prostate diseases.Acknowledgements
The authors state that this study has received funding by National Natural Science Foundation of China grant 81271562 (JW) and Science and Technology Program of Guangzhou, China 201704020016 (JW).References
1. Turkbey B, Brown A M, Sankineni S, et al. Multiparametric prostate magnetic resonance imaging in the evaluation of prostate cancer. CA Cancer J Clin,2016,66(4):326-336.
2. Sahebjavaher R S, Nir G, Honarvar M, et al. MR elastography of prostate cancer: quantitative comparison with histopathology and repeatability of methods. NMR Biomed,2015,28(1):124-139.
3. Wang J, Zhang T, Glaser K J, et al. Clinical Evaluation of a Simple Approach for Improving Shear Wave Illumination in Magnetic Resonance Elastography of the Prostate. In: Proceedings of the 25th Annual Meeting of ISMRM, Hawaii, 2017, Number:5786.
4. Zhang T, Wang J, Glaser K J, et al. Magnetic Resonance Elastography of the Prostate: Impact of Driver Size on Image Quality. In: Proceedings of the 25th Annual Meeting of ISMRM, Hawaii,2017, Number:5930.
5. Li S, Chen M, Wang W, et al. A feasibility study of MR elastography in the diagnosis of prostate cancer at 3.0T. Acta Radiol,2011,52(3):354-358.
6. Rouviere O, Melodelima C, Hoang D A, et al. Stiffness of benign and malignant prostate tissue measured by shear-wave elastography: a preliminary study. Eur Radiol,2017,27(5):1858-1866.
7. Wang J, Glaser KJ et al. MR elastography of the prostate with a mode conversion endourethral driver feasibility at 3.0 T. In: Proceedings of the 24th Annual Meeting of ISMRM, Singapore, 2016, Number:2760.
8. Wang J, Zhang T, Deng Y, et al. Preliminary Investigation of MR Elastography to Predict Lymph Node Metastasis in Prostate Cancer. In: Proceedings of the 26th Annual Meeting of ISMRM, Paris, 2018, Number:7600.
9. Barr R G, Cosgrove D, Brock M, et al. WFUMB guidelines and recommendations on the clinical use of ultrasound elastography: Part 5. Prostate. Ultrasound in Medicine & Biology,2017,43(1):27-48.
10. Good D W, Stewart G D, Hammer S, et al. Elasticity as a biomarker for prostate cancer: a systematic review. BJU International,2014,113(4):523-534.
11. Bigler S A, Deering R E, Brawer M K. Comparison of microscopic vascularity in benign and malignant prostate tissue. Hum Pathol,1993,24(2):220-226.
Figures