0974
Real-time catheter tracking for cardiac MR-Thermometry during RF-ablation1IHU-LIRYC, Pessac, France, 2Univ. Bordeaux, Centre de recherche Cardio-Thoracique de Bordeaux, Bordeaux, France, 3INSERM U1045, Bordeaux, France, 4Siemens Healthcare, Saint-Denis, France, 5Imricor, Brunsville, MN, United States, 6Siemens Healthcare, Erlangen, Germany, 7Bordeaux University Hospital (CHU), Pessac, France
Synopsis
Introduction
Cardiac catheterization and interventional procedures inside MRI are emerging fields of research since the development of MR-compatible devices and dedicated monitoring softwares1,2. MR-thermometry during cardiac radiofrequency ablations (RFA) has been identified as a key monitoring tool to monitor lesion formation using thermal dose calculation3. Although MR-thermometry in the heart has been validated by several groups, it still suffers from cumbersome planning steps relative to respiratory motion compensation. So far, two approaches have been proposed in the literature. Firstly, a method relying on coronal or sagittal slices (main direction of motion) 4 to observe only in-plane motion, assuming that out-of-plane displacements are negligible. Secondly, a more elaborated method utilizing an echo-navigator to track the position of the liver and correct the slice position accordingly 3. Both methods correct for in-plane motion and susceptibility artifact corrections. The downside of both aforementioned methods is the necessity to position manually the stack-of-slices on the catheter tip. In addition, strong assumptions are made about the motion of the targeted cardiac region, relative to the respiratory motion. In this study, we have investigated the feasibility of using catheter tracking during RFA to correct locally slice positions to compensate myocardium motion. Quality of the catheter positions was assessed in vivo. Temperatures images were computed and correspondence with a non-contrasted 3D T1-weighted5 sequences was performed.Methods
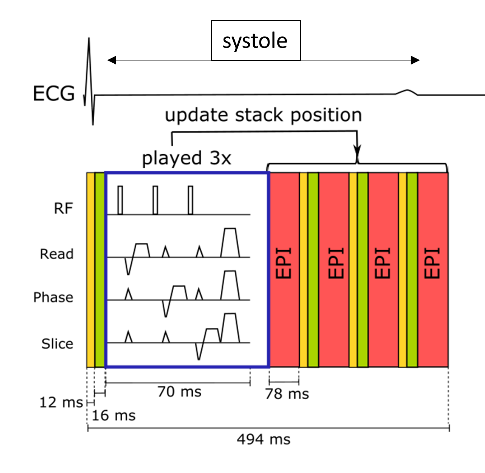
Two MR-compatible catheters (Imricor, USA) equipped with 2 tracking coils were used. One was inserted in the right ventricle for pacing. Another was inserted in in the left ventricle (LV) for the ablation. RFA were performed using a clinical RF generator (Abbott, USA). Localization and targeting of the ablation locations were performed using a tracking only sequence. Catheter navigation was rendered in 3D on a dedicated prototype software (Monte Carlo, Siemens, Germany). For catheter tracking during MR-thermometry, we have implemented an EPI single-shot gradient echo sequence integrating a 3D tracking module. The following sequence parameters were used: FOV = 187x187 mm², TR/TE/FA = 123 ms/23 ms/40 °, voxel size = 1.4x1.4x3 mm3, partial Fourier 6/8, with a bandwidth of 1355 Hz per pixel. GRAPPA 2 was used. The sequence was triggered in systole and three tracking modules were performed before imaging slices (see Figure 1). A temporal filter was utilized to compute the 3D spatial positions of the two tracking coils located at the tip of the catheter. The initial stack-of-slices position was set in short axis and its position was modified after the first tracking. Slice orientations were conserved. MR-thermometry was computed using pipeline detailed in 6.Results
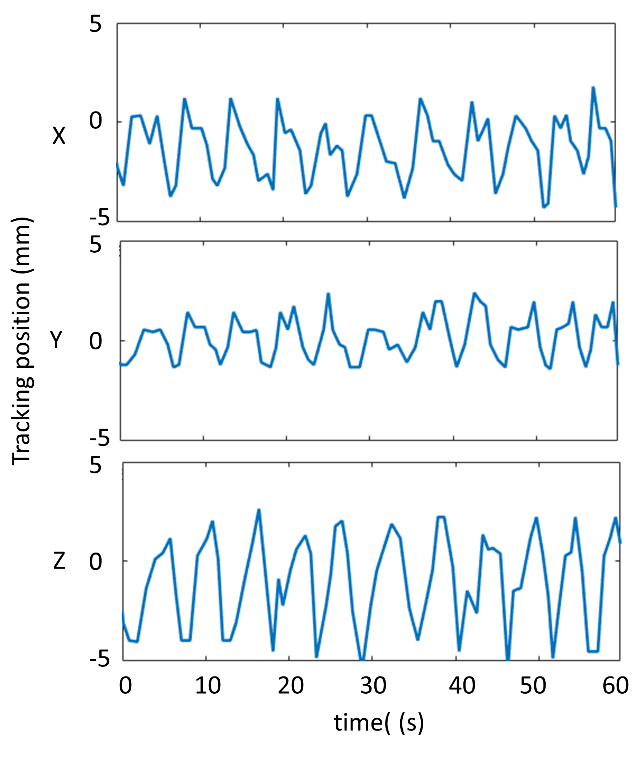
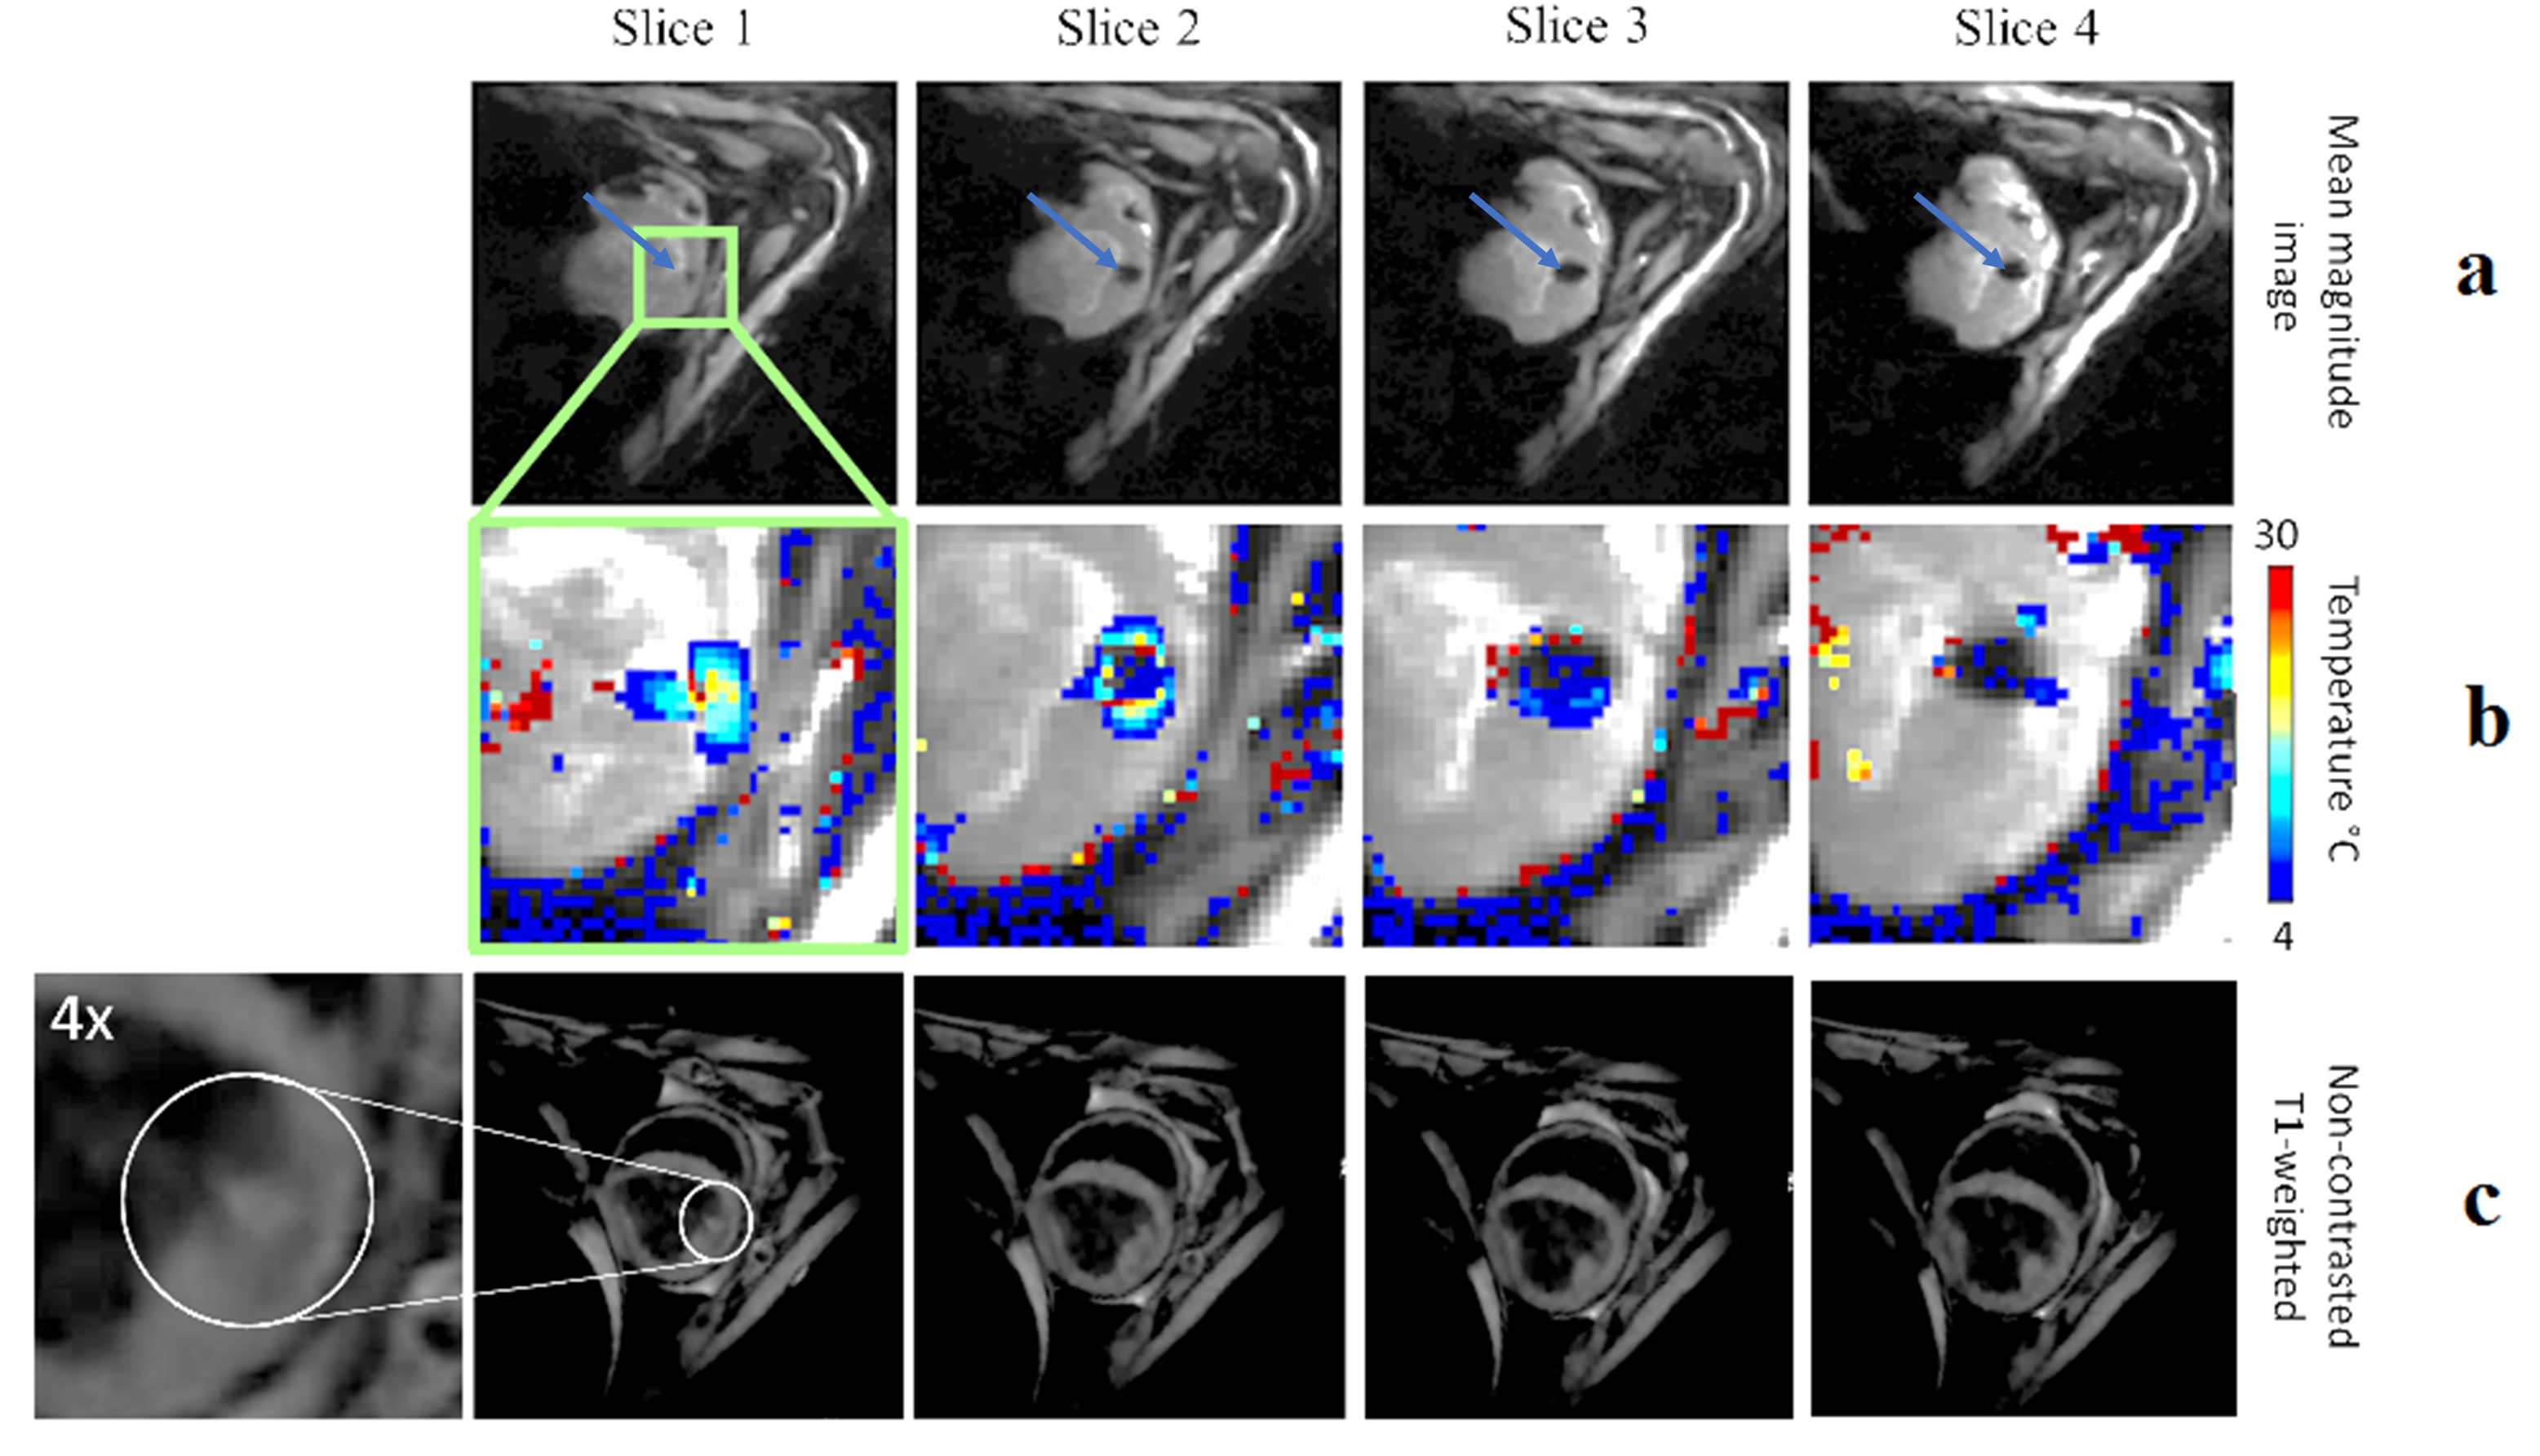
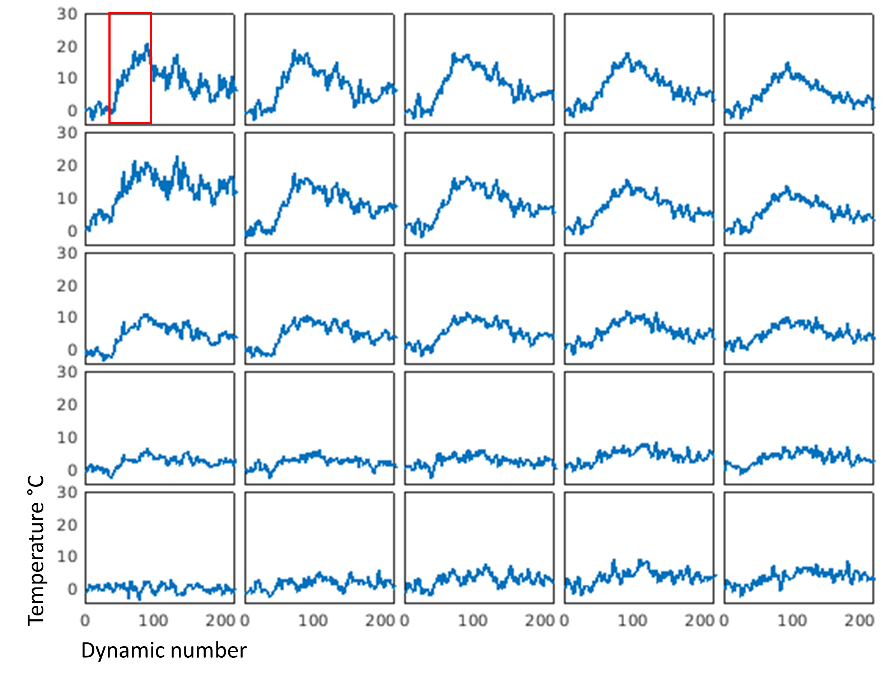
In total we have monitored N = 10 ablations in different regions of the LV in 3 animals. Figure 1 shows representative tip catheter positions along time when catheter was in good contact with the myocardium. Periodic displacement of the catheter tip was observed on X, Y and Z-axis. As expected, Z-axis displayed the greatest displacement amplitudes measured at 6.2±1.2 mm corresponding to the main direction of the respiratory motion (head-feet direction). In addition, displacement periods correlated well with the respiration rate set on the ventilator (12 cycles per minute). Figure 3 shows representative results of an ablation of 50 s duration at 30W. Figure 3a displays mean EPI magnitude images, after image registration, over 220 acquisition frames. Catheter tip is always at the image center (see arrow in Figure 3), facilitating temperature visualization. Figure 3b displays temperature images overlaid to magnitude images (3a) in a zoomed region at the vicinity of the catheter tip. The temperature increase was visible on three slices with a maximum of 23°C at the end of RF-energy delivery. Figure 3c shows the corresponding slices acquired with a 3D non-contrasted T1-weighted sequence for lesion assessment. Slice one displays a small hyper contrast (see white circle) which is in agreement with the temperature increase in slice #1. Note that the sequence was triggered in diastole. Figure 4 shows temperature evolution over time in a region of 5 by 5 pixels at the catheter tip.Discussions and conclusions
This study shows that monitoring MR-thermometry during
cardiac ablations with automatic slice position update on the catheter tip is
feasible, with encouraging inital results. As compared to
the literature, the proposed method compensates local displacements along the
respiratory cycle using in situ micro coils signals. Further studies will have to assess the benefits of the proposed method in terms of temperature
mapping as compared to the literature. Comparison between thermal dose and
lesion extent is also envisioned.Acknowledgements
This work received financial support from the French National Investments for the Future Programs: ANR-10-IAHU-04 (IHU Liryc), Laboratory of Excellence ANR-10-LABX-57 (TRAIL)References
1. Bhagirath, P. et al. Interventional Cardiac Magnetic Resonance Imaging in Electrophysiology Advances Toward Clinical Translation. Circ. Arrhythm. Electrophysiol. 8, 203–211 (2015).
2. Chubb, H. et al. Cardiac Electrophysiology Under MRI Guidance: an Emerging Technology. Arrhythmia Electrophysiol. Rev. 6, 85–93 (2017).
3. Toupin, S. et al. Feasibility of real-time MR thermal dose mapping for predicting radiofrequency ablation outcome in the myocardium in vivo. J. Cardiovasc. Magn. Reson. 19, (2017).
4. Senneville, D. et al. Feasibility of fast MR‐thermometry during cardiac radiofrequency ablation. NMR Biomed. 25, 556–562 (2012).
5. Guttman, M. A. et al. Non-contrast-enhanced T 1 -weighted MRI of myocardial radiofrequency ablation lesions: Non-Contrast-Enhanced MRI of RF Ablation Lesions. Magn. Reson. Med. (2017).
6. Ozenne, V. et al. Improved cardiac magnetic resonance thermometry and dosimetry for monitoring lesion formation during catheter ablation. Magn. Reson. Med. 77, 673–683 (2017).
Figures