0973
Deep Learning Based Needle Localization on Real-Time MR Images of Patients Acquired During MR-guided Percutaneous Interventions1Siemens Healthcare, Erlangen, Germany, 2TU Dortmund, Dortmund, Germany, 3ICube UMR7357, University of Strasbourg, CNRS, FMTS, Strasbourg, France, 4Imagerie Interventionnelle, Hôpitaux Universitaires de Strasbourg, Strasbourg, France
Synopsis
Automatic localization of needles in real-time images can facilitate MR-guided percutaneous interventions. It enables automatic slice repositioning and targeting support and, thus, allows for faster workflows. Systematic acquisition of training data for deep learning tasks in the context of interventional MRI can be difficult due to the fact, that treatment quality must not be impaired. Therefore, we investigated whether images of porcine animal experiments can be used to train deep learning algorithms for needle artifact segmentation in human datasets. Results show that transfer is feasible at 1.5T. Additional fine tuning using small amounts of human data further reduces the error.
Introduction
MR-guided needle interventions require a process of localizing the needle. Automatic localization enables fast slice repositioning and can increase quality of treatment. Previously proposed approaches include active tracking1, optical markers2-4 or classical image processing algorithms5-7. Recently, the utilization of deep learning (DL) algorithms for needle artifact segmentation showed promising results8,9. Acquiring large datasets with high variability to improve the performance of DL algorithms might be easier in animal studies, since treatment quality must not be compromised for patients. Therefore, we investigated the transferability of an algorithm trained on porcine data to human data, acquired at 1.5T.Methods
A non-product U-Net segmentation algorithm10 was trained on a dataset of 7651 images from multiple porcine animal experiments for segmentation of in-plane needle artifacts1. The trained algorithm was tested on a dataset of 453 human images retrospectively, acquired during 7 interventions, to investigate the transferability from animal to human data. Voxel sizes of the animal images were 1.6x1.6x10mm3 and 2.3x2.3x10mm3, while the voxel sizes of the human images were 1.6x1.6x4mm3 and 1.8x1.8x4mm3. All images were acquired with a bSSFP sequence at 1.5T (BEAT-IRTTT on MAGNETOM Espree/Aera, Siemens Healthcare, Erlangen, Germany). Furthermore, the human dataset was used to fine-tune the algorithm with a smaller learning rate in a 7-fold cross-validation scheme. Augmentation (rotation, translation, flipping, adding noise, and clipped zooming) was applied randomly during the entire training process, to prevent the model from overfitting. F1 score and number of detected contours were calculated for evaluating segmentation results. Orientation and end-points of the needle artifact were extracted as the long axis of an ellipse, fitted to the binarized segmentation mask. The noise, introduced by manually annotating the dataset, was estimated by evaluating inter-observer standard deviation of annotations from five interventional MR experts.Results
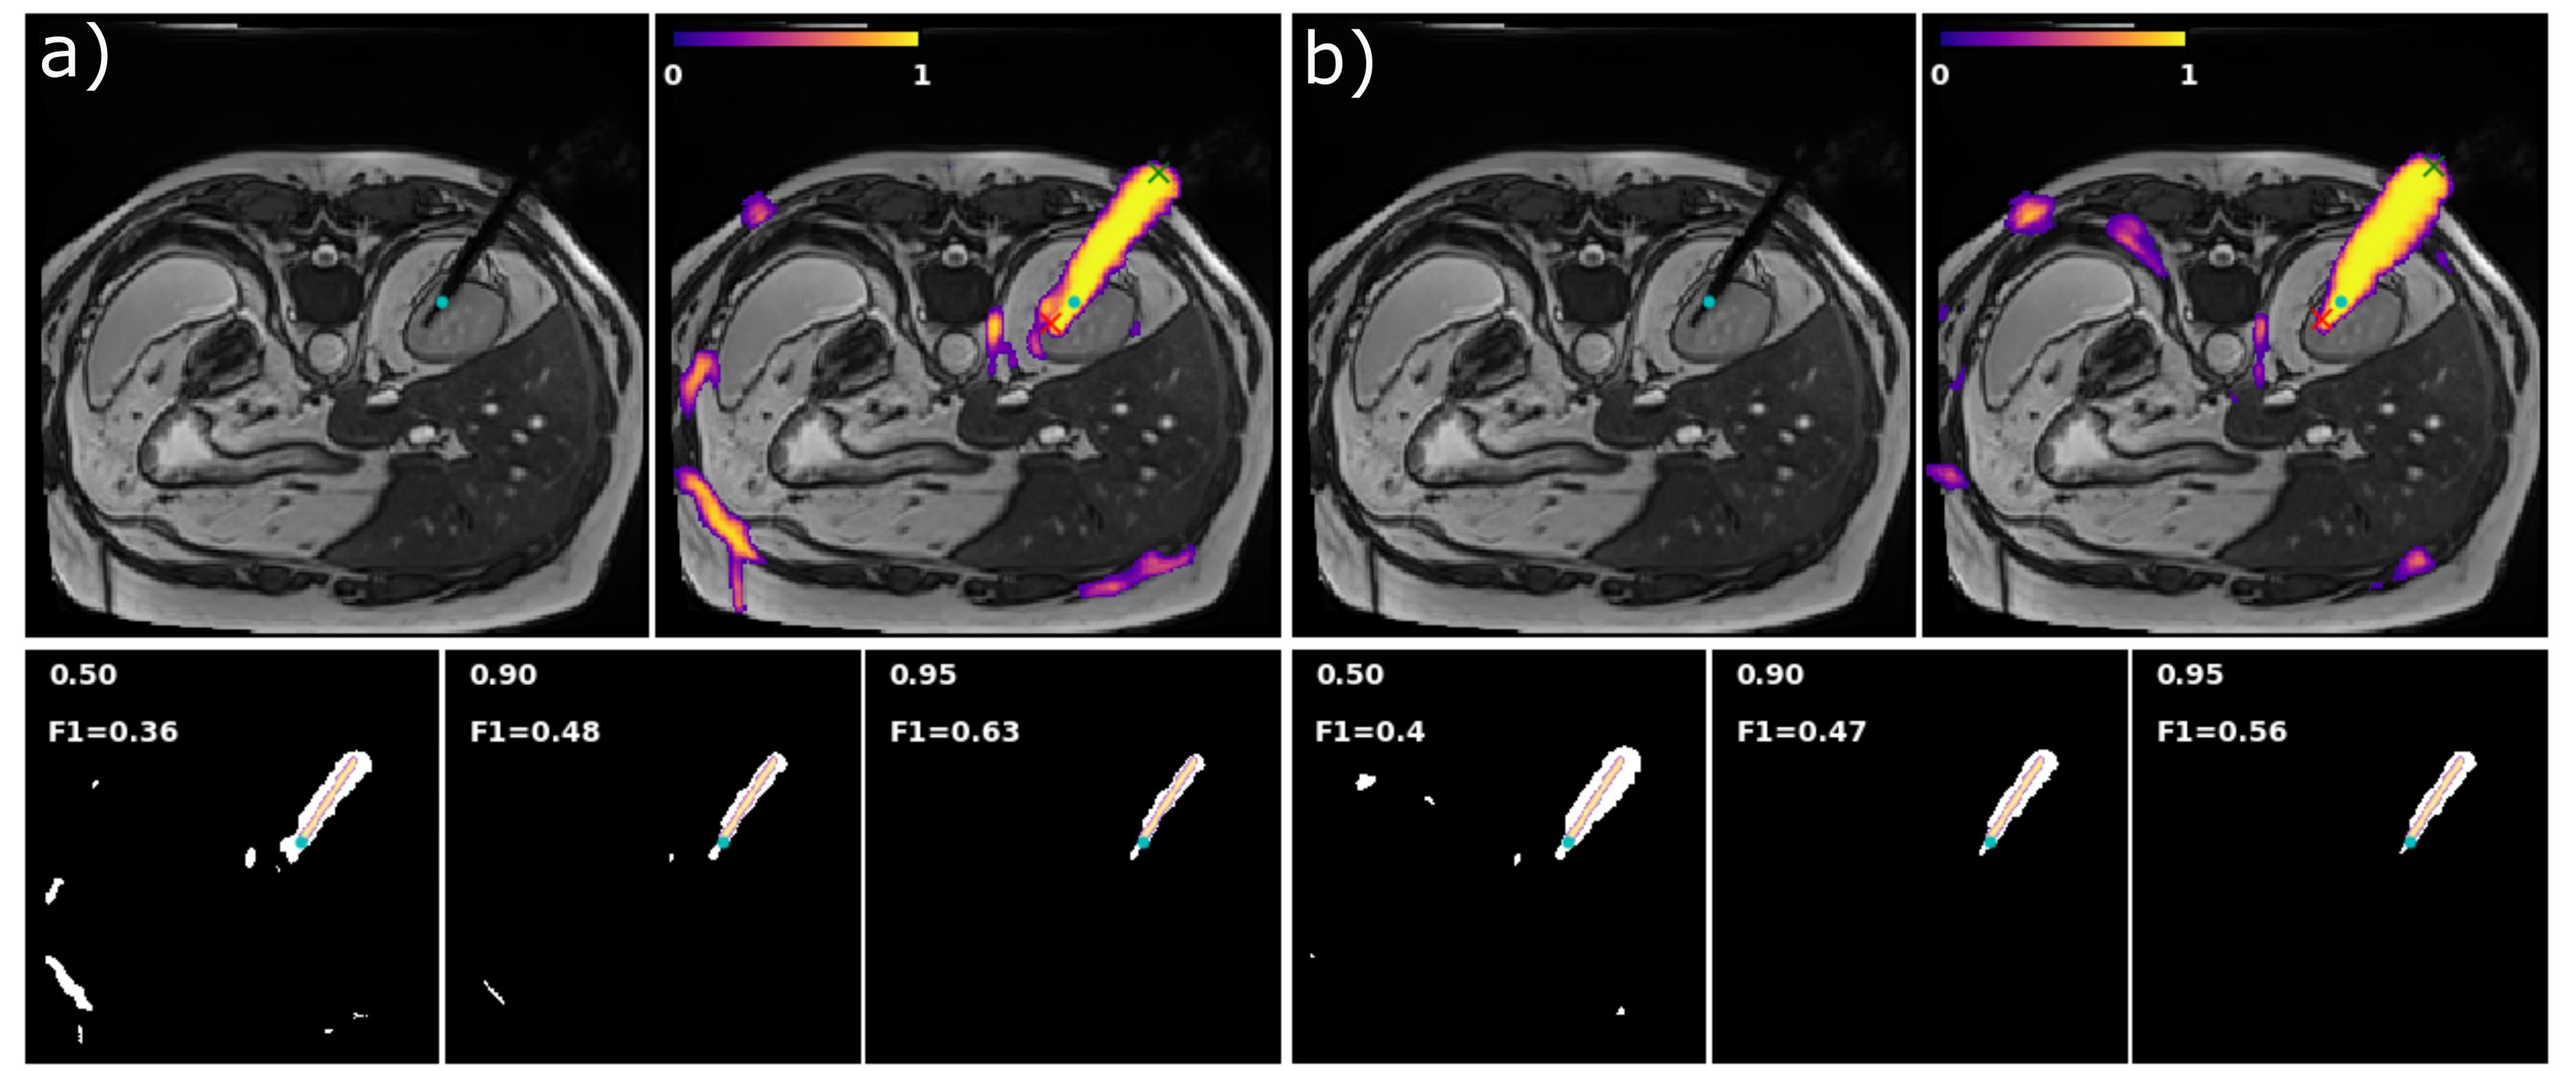
Trained on the
animal data, the algorithm showed already the capability of detecting needle
artifacts in human data, although 8 of 17 series contain images with incomplete
artifact segmentation. Fine tuning on the human data removed those incomplete
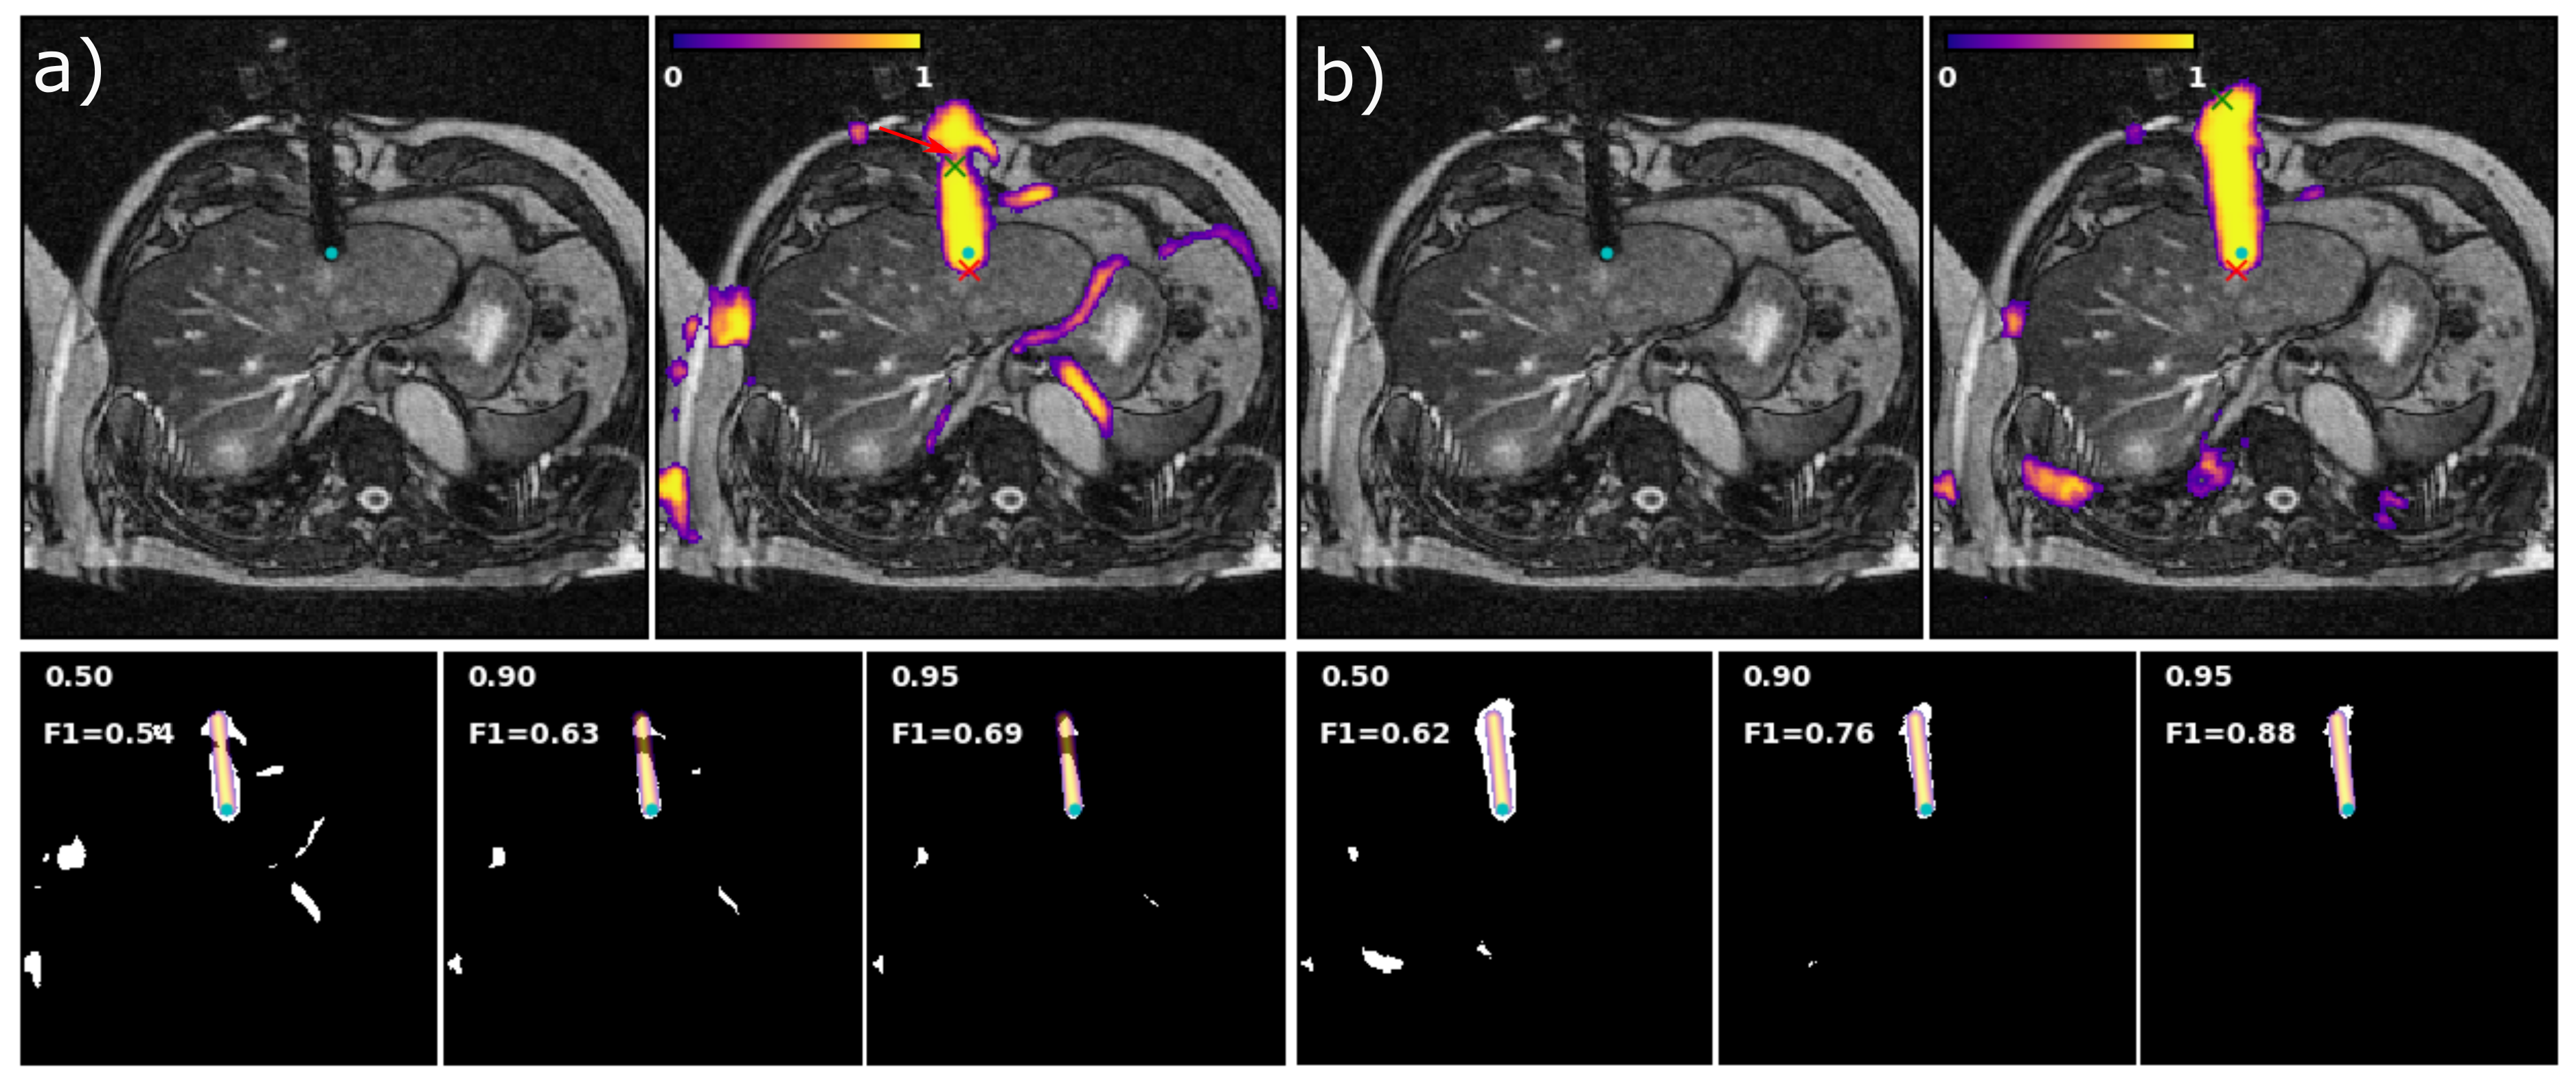
segmentations. Fig. 1 and 2 show representative images, the inferred probability
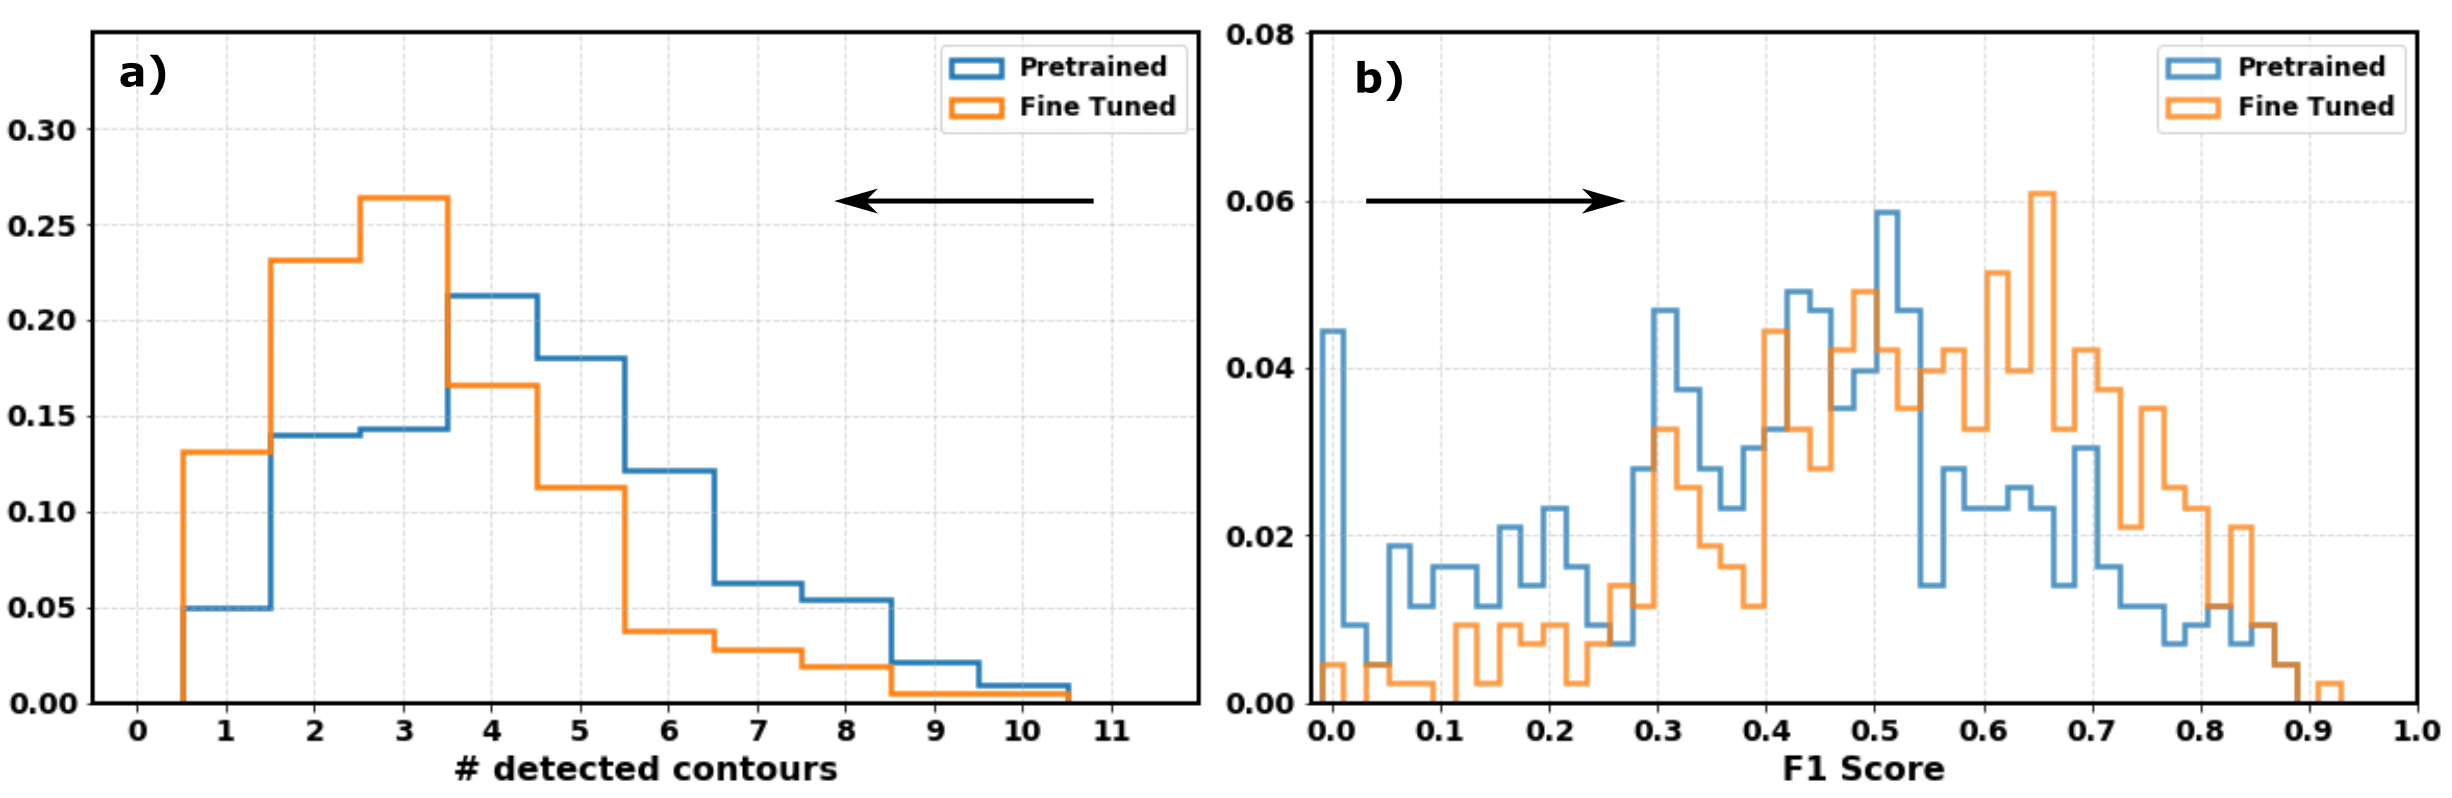
map and the binarized mask for three thresholds. Comparison before and after
fine-tuning showed that the fine-tuning reduced the number of complete misses
and improved F1 score (Fig. 3) of the segmentation as well as the shape of
positively classified areas (Fig. 4). Fig. 1 shows an inserted biopsy gun,
where the extended stylet was correctly detected as part of the needle
artifact. The manual annotations did not include the stylet though. Therefore,
the error of the needle tip position increased after fine tuning.
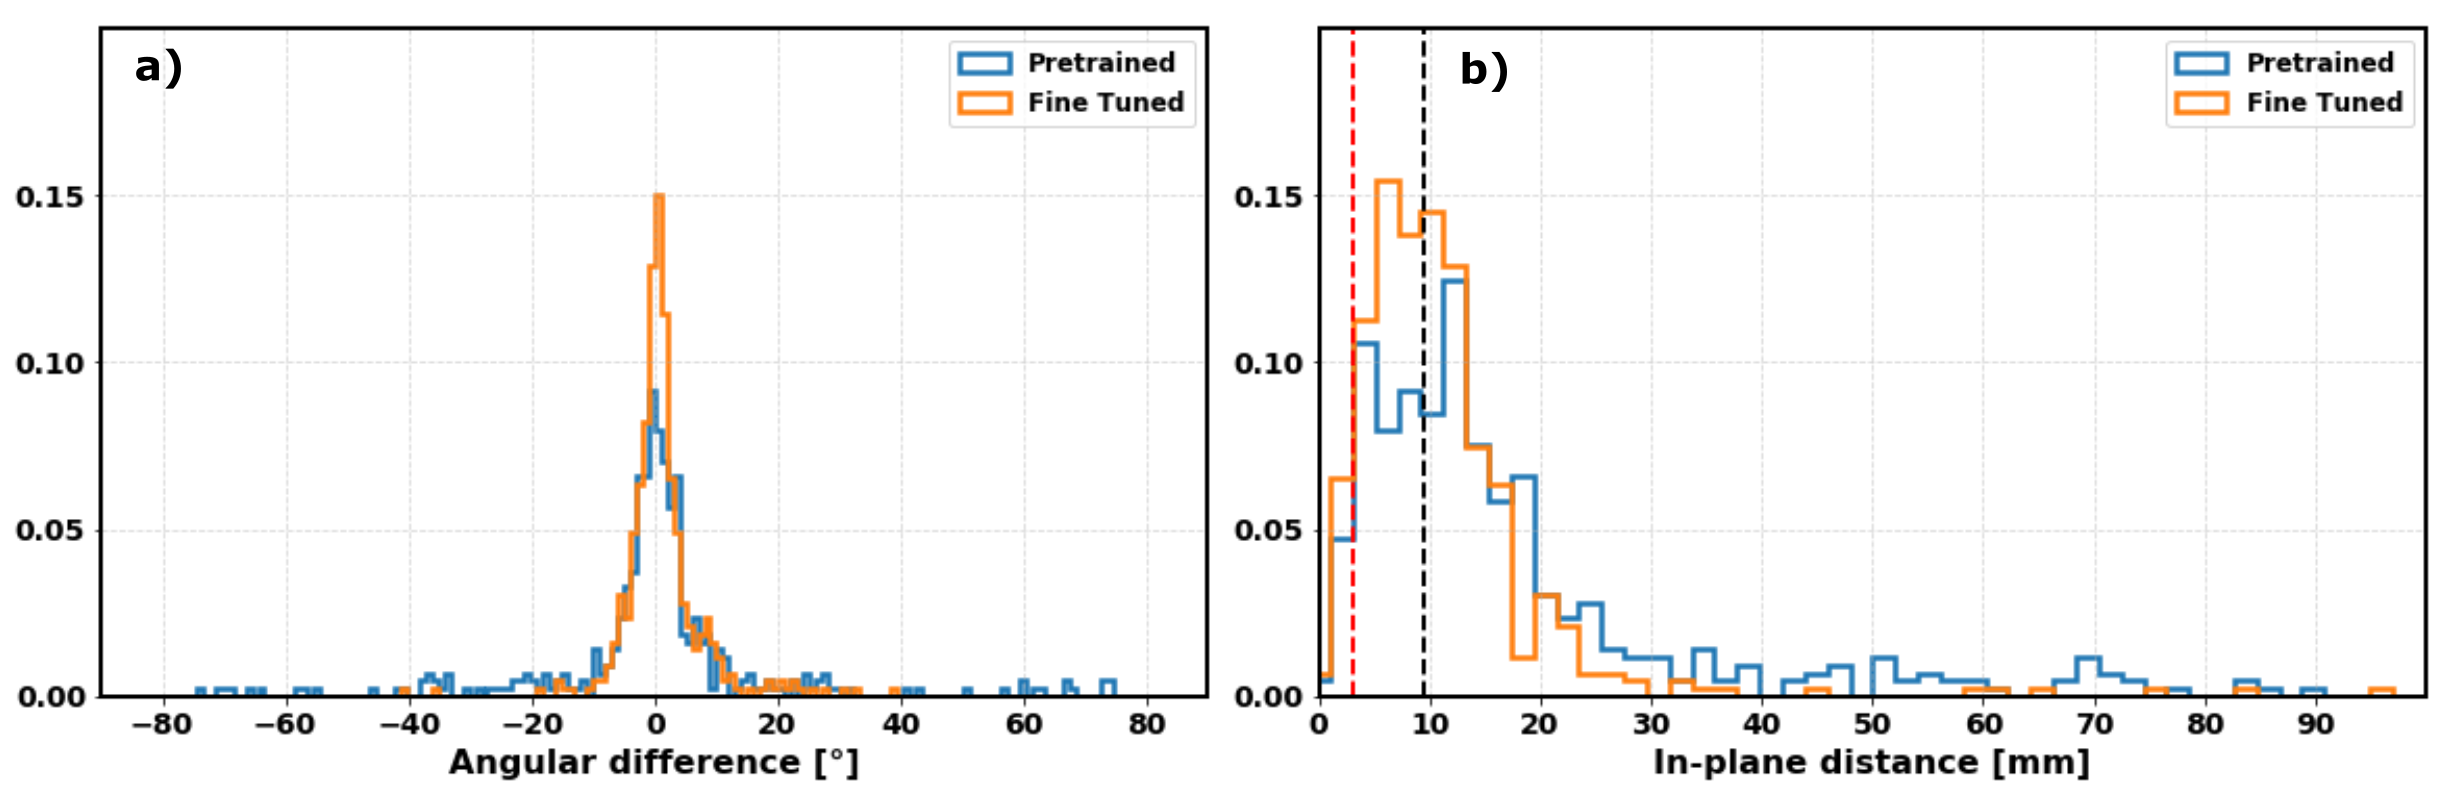
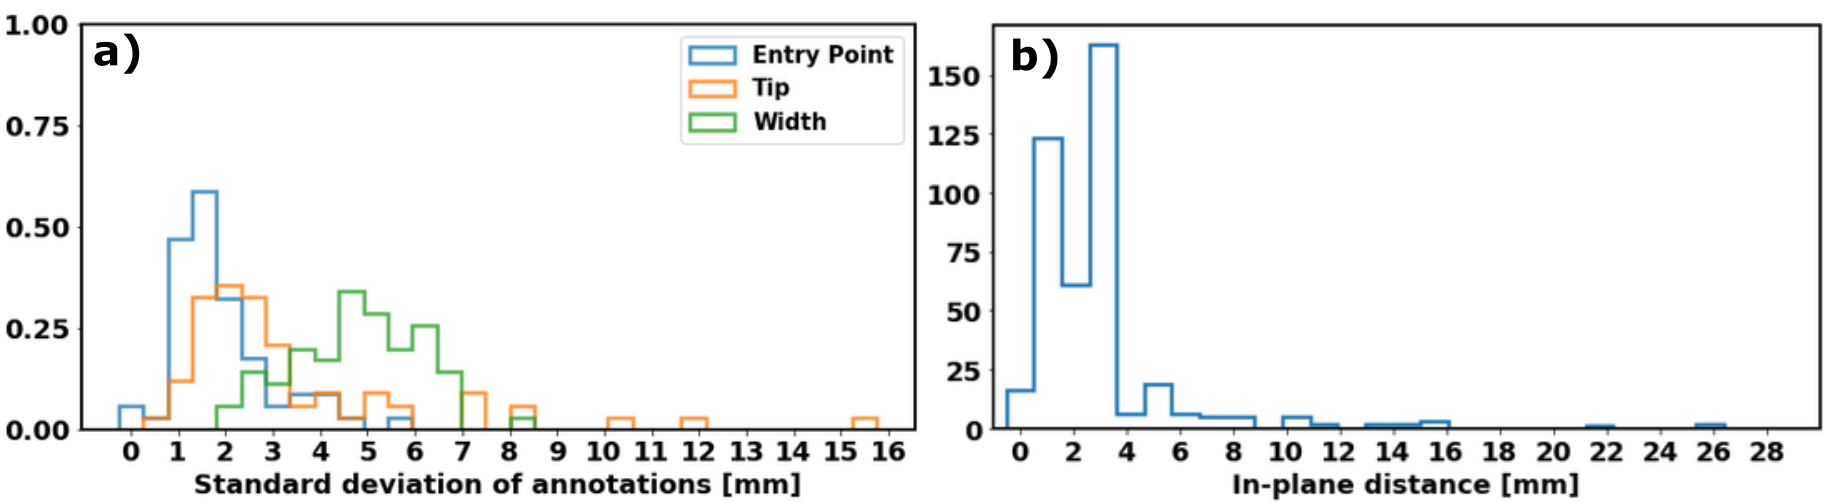
Distributions of
angular deviations and in-plane distance for the tip position between extracted
needle position and annotation is shown in Fig. 4. As a soft lower boundary for
accuracy of the extracted tip position, the distribution of standard deviations
was calculated from the five annotations per image (Fig 5). The ellipse fit algorithm
was applied to all label masks, which resulted in a systematic error of 2-4mm
for the tip position due to the algorithm extracting an artifact’s border pixel
in contrast to the slightly inwards placed annotation.Discussion
Testing the algorithm trained on porcine images, on human interventional images showed already promising results on most of the images. A larger and more variable porcine image dataset could probably improve the performance on human data as well. The performance after fine tuning on a limited number of human data was sufficient to extract the needle orientation, as the distribution of angular deviation between inference and annotation was concentrated close to zero. The algorithm detected extended stylets of fired biopsy guns which were not manually labeled. Therefore, the corresponding images showed an additional distance between annotated and inferred tip positions of up to 20mm. Additional reasons for tip localization errors of several millimeters were the systematic error due to the extraction algorithm and variability in manual labeling.Conclusion
It is feasible to pre-train a deep learning algorithm for needle localization on a large amount of porcine data, to overcome limitations due to small human training datasets. Inference of the tip position might be improved by training a deep learning algorithm for regression. Our findings indicate that acquiring large amounts of training data with objective ground truth labels can be done in animal experiments. In conclusion, with well-labeled large training datasets DL-based needle localization algorithms can robustly detect position and orientation of needles and, thus, enable speed-up of clinical MR-guided needle intervention workflows.Acknowledgements
The authors thank Dr. Rainer Schneider, Dirk Franger and Ralf Uhlig for annotating data to evaluate the inter-observer variability.References
1. Zimmermann, H. , Müller, S. , Gutmann, B. , Bardenheuer, H. , Melzer, A. , Umathum, R. , Nitz, W. , Semmler, W. and Bock, M., Targeted‐HASTE imaging with automated device tracking for MR‐guided needle interventions in closed‐bore MR systems. Magn. Reson. Med. 2006; 56: 481-488. DOI:10.1002/mrm.20983
2.Kägebein U, Godenschweger F, Armstrong BSR, Rose G, Wacker FK, Speck O, Hensen B. Percutaneous MR-guided interventions using an optical Moiré Phase tracking system: Initial results. PLoS ONE 2018; 13(10): e0205394 DOI:10.1371/journal.pone.0205394
3. Park Y, Elayaperumal S, Daniel B, Ryu S C, Shin M, Savall J, Black R J, Moslehi B, Cutkosky M R. Real-Time Estimation of 3-D Needle Shape and Deflection for MRI-Guided Interventions. IEEE/ASME Transactions on Mechatronics Dec. 2010; 15(6):906-915. DOI:10.1109/TMECH.2010.2080360
4. Busse H, Garnov N, Thörmer G, Zajonz D, Gründer W, Kahn T and Moche M (2010), Flexible add‐on solution for MR image‐guided interventions in a closed‐bore scanner environment. Magn. Reson. Med., 64: 922-928. DOI:10.1002/mrm.22464
5. Rothgang E, Gilson W D, Wacker F, Hornegger J, Lorenz C H and Weiss C R (2013), Rapid freehand MR‐guided percutaneous needle interventions: An image‐based approach to improve workflow and feasibility. J. Magn. Reson. Imaging, 37: 1202-1212. DOI:10.1002/jmri.23894
6. de Oliveira A, Rauschenberg J, Beyersdorff D, Semmler W and Bock M (2008), Automatic passive tracking of an endorectal prostate biopsy device using phase‐only cross‐correlation. Magn. Reson. Med., 59: 1043-1050. DOI:10.1002/mrm.21430
7. Campbell-Washburn A E, Rogers T, Xue H, Hansen M S, Lederman R J and Faranesh A Z. Dual echo positive contrast bSSFP for real-time visualization of passive devices during magnetic resonance guided cardiovascular catheterization. J. Cardiovascular Magn. Reson. 2014; 88(16). DOI:10.1186/s12968-014-0088-7
8. Weine J, Rothgang E, Wacker F, Weiss C R, Maier F. Passive Needle Tracking with Deep Convolutional Neural Nets for MR-Guided Percutaneous Interventions. Proceedings of 12th Interventional MRI Symposium Oct 2018. 12:53.
9. Mehrtash A, Ghafoorian M, Pernelle G, Ziaei A, Heslinga FG, Tuncali K, Fedorov A, Kikinis R, Tempany CM, Wells WM, Abolmaesumi P, Kapur T. Automatic Needle Segmentation and Localization in MRI with 3D Convolutional Neural Networks: Application to MRI-targeted Prostate Biopsy. IEEE Transactions on Medical Imaging, 2018; DOI:10.1109/TMI.2018.2876796
10. Ronneberger O, Fischer P, Brox T. U-Net: Convolutional Networks for Biomedical Image Segmentation. MICCAI 2015. Lecture Notes in Computer Science 2015; 9351. Springer, Cham. DOI: 10.1007/978-3-319-24574-4_28
Figures