0965
Ex vivo Correlations of MRI Parametrics and Histological Measures in Parkinson’s Disease Midbrain1Neurosurgery, The Pennsylvania State University - College of Medicine, Hershey, PA, United States, 2Radiology, The Pennsylvania State University - College of Medicine, Hershey, PA, United States, 3Pathology, The Pennsylvania State University - College of Medicine, Hershey, PA, United States, 4Neurology, The Pennsylvania State University - College of Medicine, Hershey, PA, United States
Synopsis
Parkinson’s disease is neurodegenerative disease characterized by the loss of dopaminergic neurons in the substantia nigra resulting in a range of motor deficits. There is uncertainty in how MRI metrics relate to disease pathology, especially in regard to cellular changes, iron, and the presence of neuromelanin. This work aims to analyzing MRI parametrics on ex vivo PD midbrains to determine how image contrast, relaxation, and susceptibility changes are related to cellularity and integrity in this brain region. Changes in MRI parametrics were found in the substantia nigra of PD subjects in relation to histological markers.
Introduction
Parkinson’s disease is a neurodegenerative disease characterized by the loss of dopaminergic neurons in the substantia nigra resulting in a range of motor deficits and eventual neuropsychiatric disturbance. The disease is the second most common neurodegenerative disorder affecting ~ seven million people worldwide. Research has shown that iron is an important biomarker in the pathogenesis of PD and other neurodegenerative diseases. The substantia nigra has an abundance of iron as it is required for dopamine synthesis and is sequestered by neuromelanin in dopaminergic cells. However, the accumulation of iron is associated with an increase in reactive oxygen species (ROS) resulting in neuroinflammation. Previous work has used MRI to detect high levels ferric iron (Fe3+) in brain regions of PD subjects 1. There is some uncertainty in how MRI metrics relate to disease pathology, especially in regard to cellular changes and the presence of neuromelanin 2. This work aims to analyze MRI parametrics on ex vivo PD midbrains to determine how image contrast, relaxation, and susceptibility changes are related to cellularity and integrity in this brain region.Methods
Post-mortem midbrain tissue from eight Parkinson’s patients (80.6 ± 2.4, 7M, 1F) and one control patient (72, M) were harvested during final autopsy following all institutional guidelines. Tissue was fully fixed in formalin for 48h and rinsed for 48 hours in phosphate buffered saline. Tissue samples were embedded in dental alginate and placed in a Bruker Medspec 7.0T system. Multi-echo 3D gradient-echo and spin-echo sequences were taken overnight at a final resolution of 166 µm3 isotropic. Parametric R2 and R2* relaxation maps were generated along with quantitative susceptibility maps. Tissue samples where then embedded in paraffin and slices were obtained at 6 µm and 30 µm thicknesses. Six-micron sections were bleached for neuromelanin and were immunohistochemically stained for dopamine positive neurons (tyrosine hydroxylase, TH) and microglia cells (IBA-1). Thirty-micron sections were stained with a Perl’s Prussian blue stain for iron quantification. Parametric MRI maps and histological stains were non-linearly transformed into a common space for comparative analysis. Cells counts, percent area, and cellular morphology was assessed in the substantia nigra, red nucleus and the periaqueductal gray as a control using Fiji (imageJ). Densitometry blueness for iron quantification and neuromelanin positive count and percent area were undertaken with the Perl’s stained sections.Results
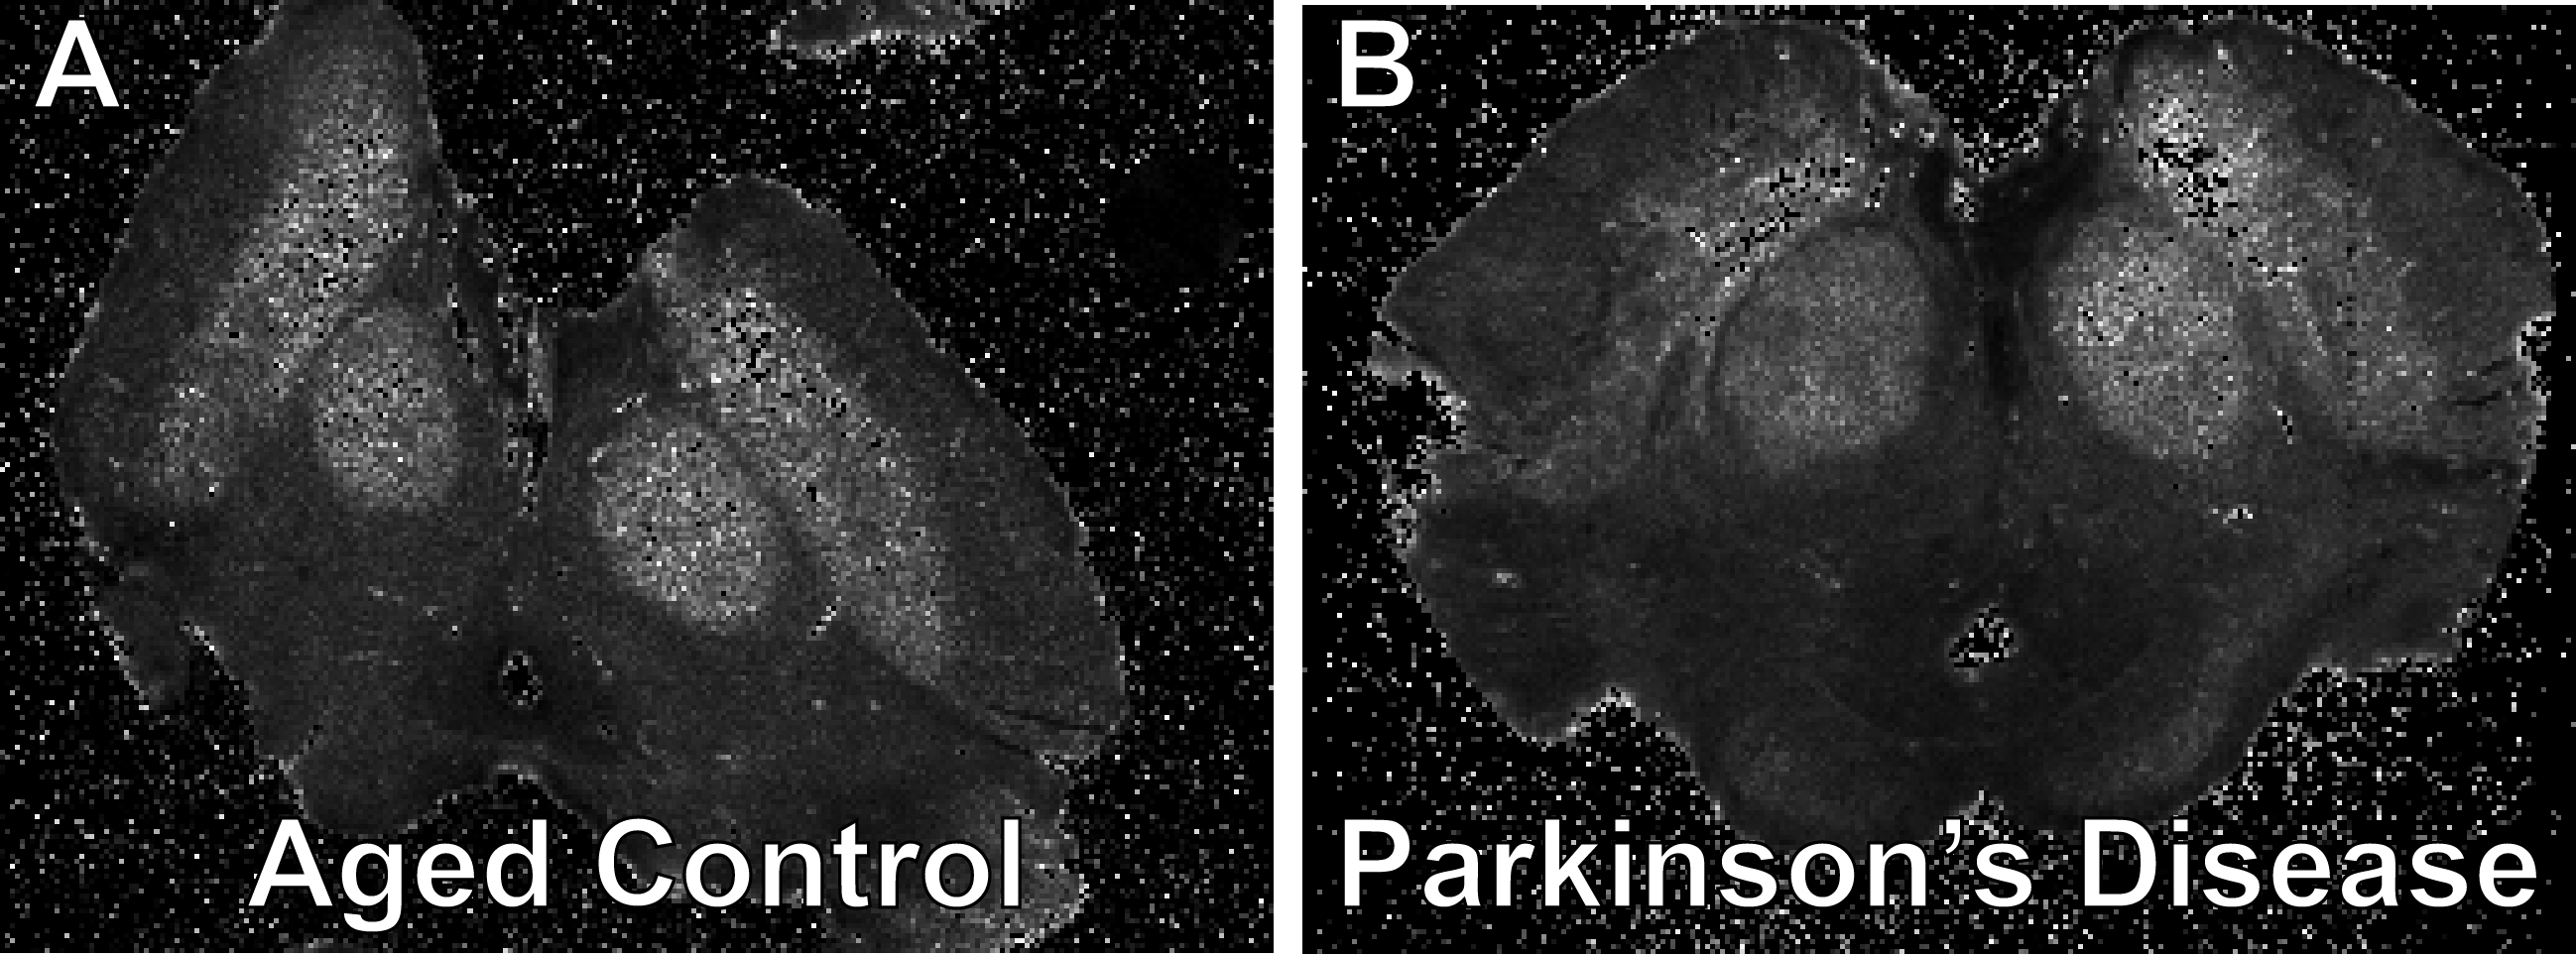
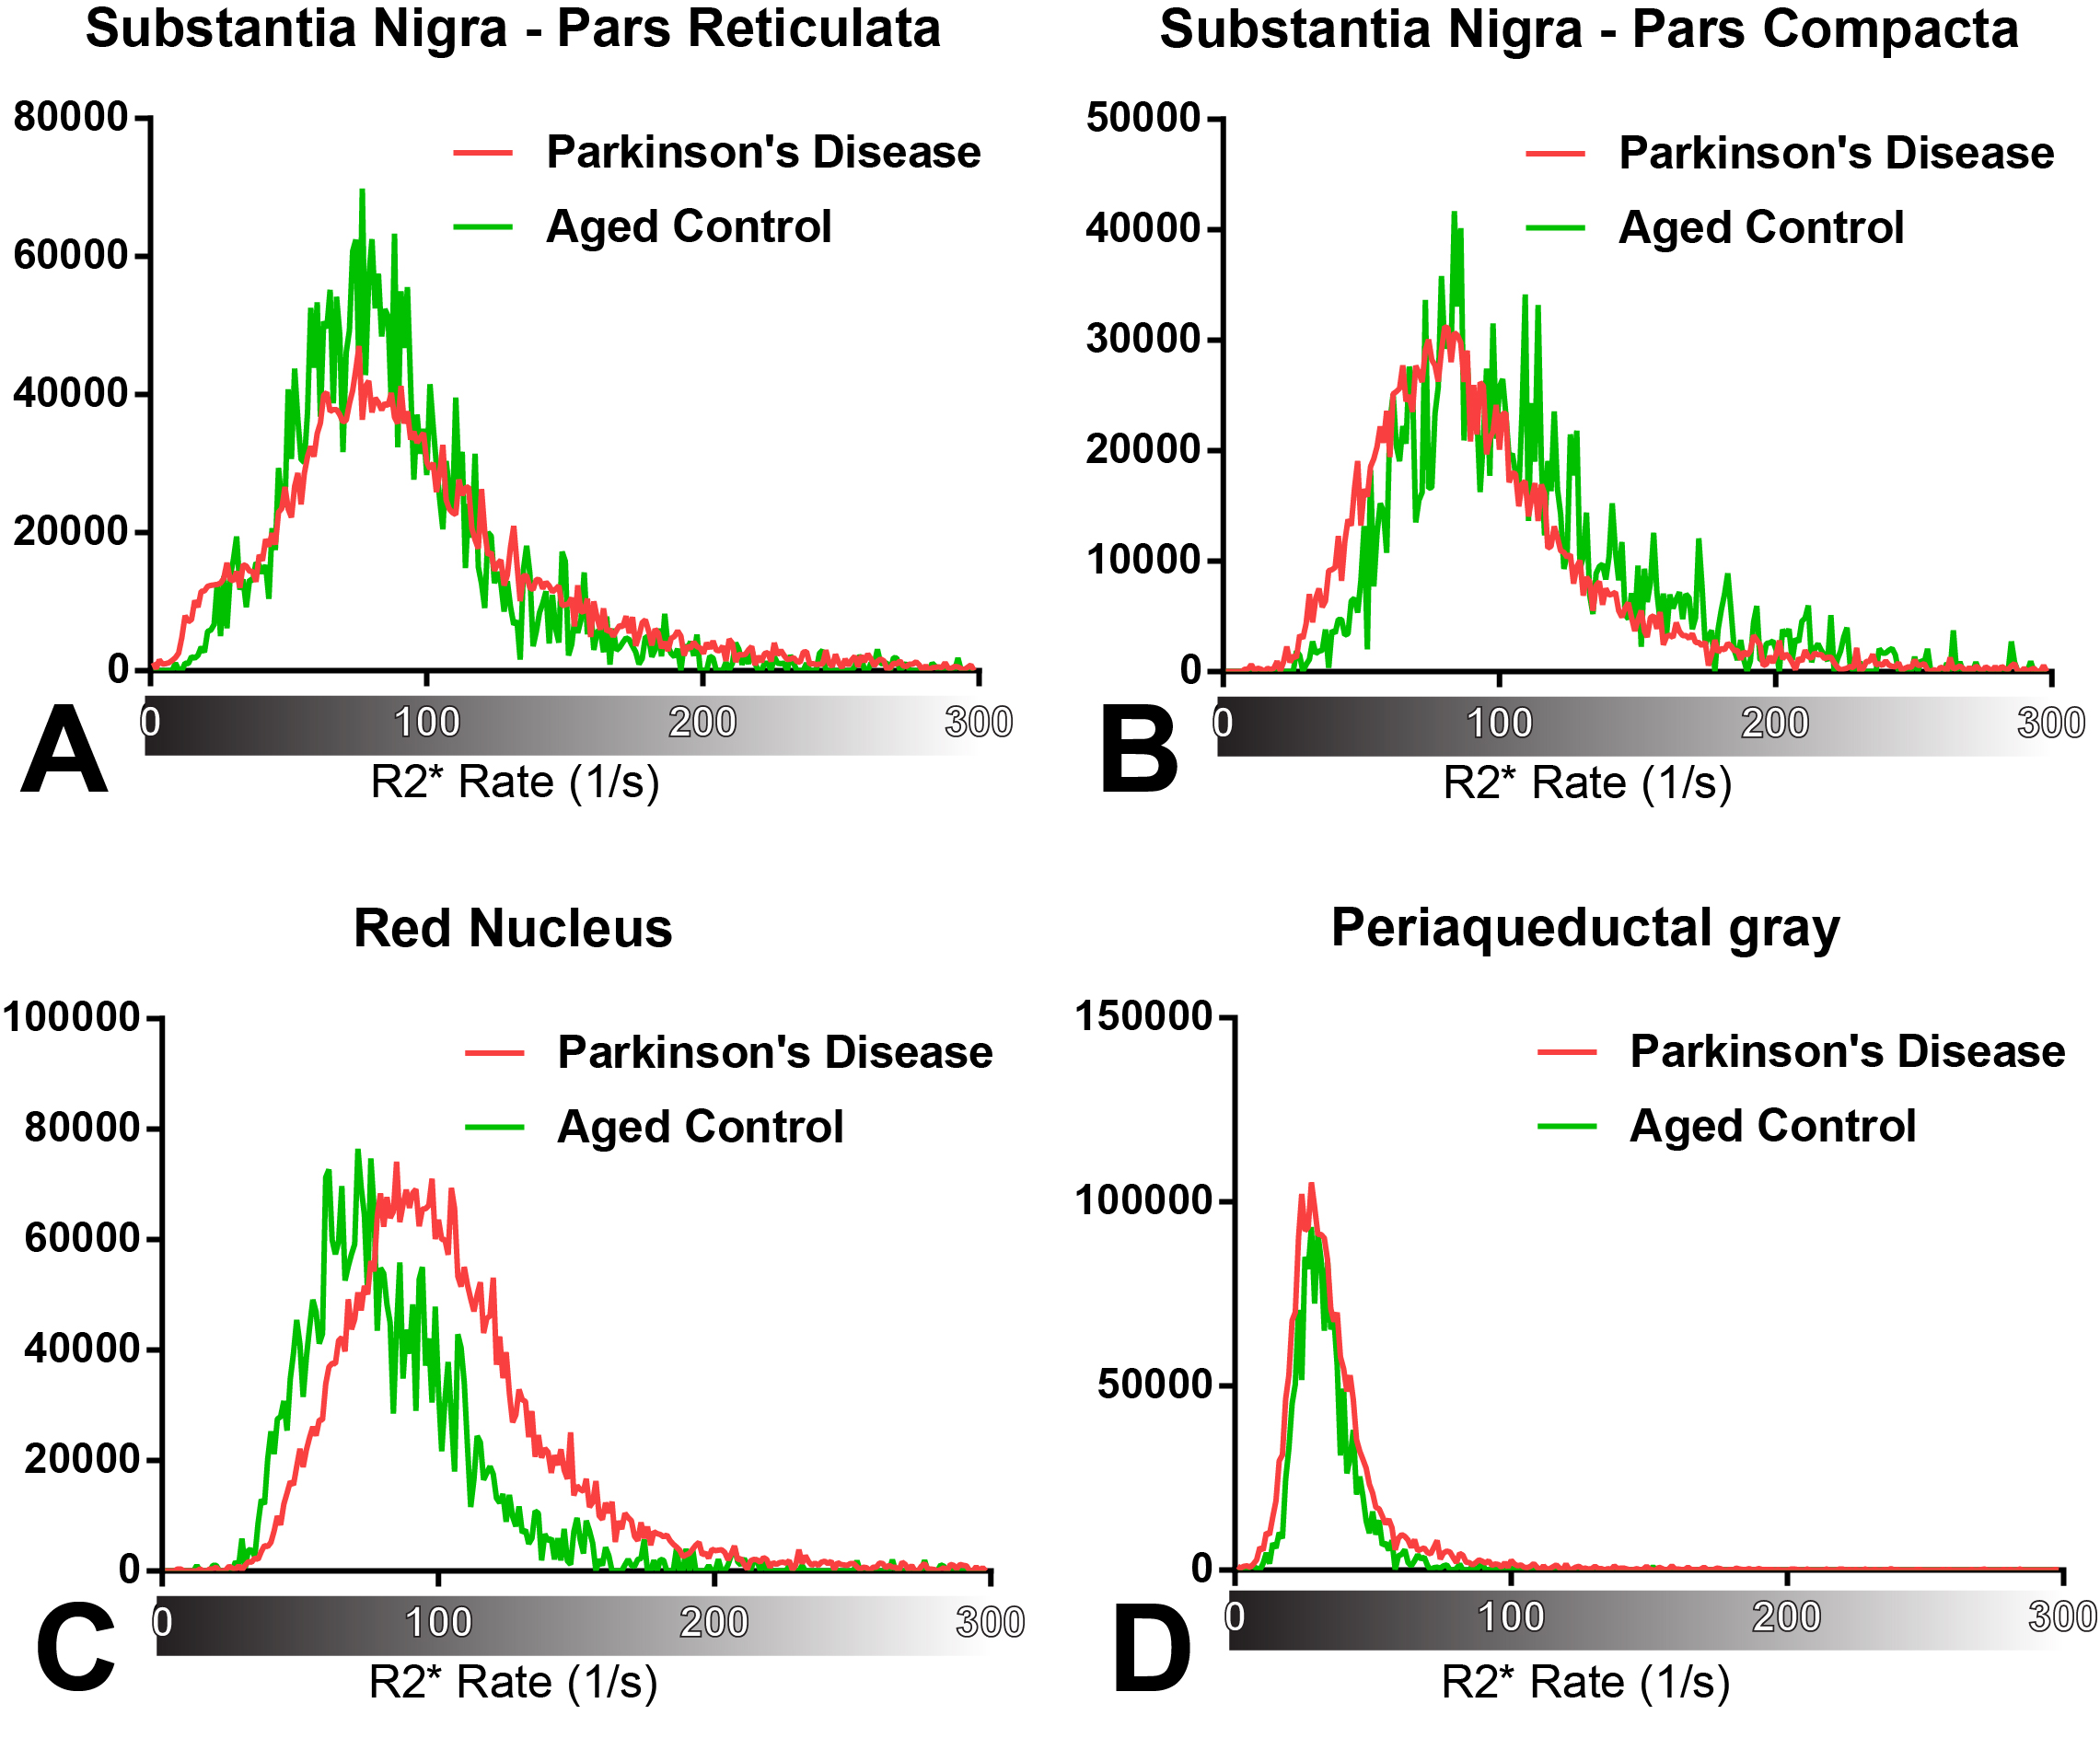
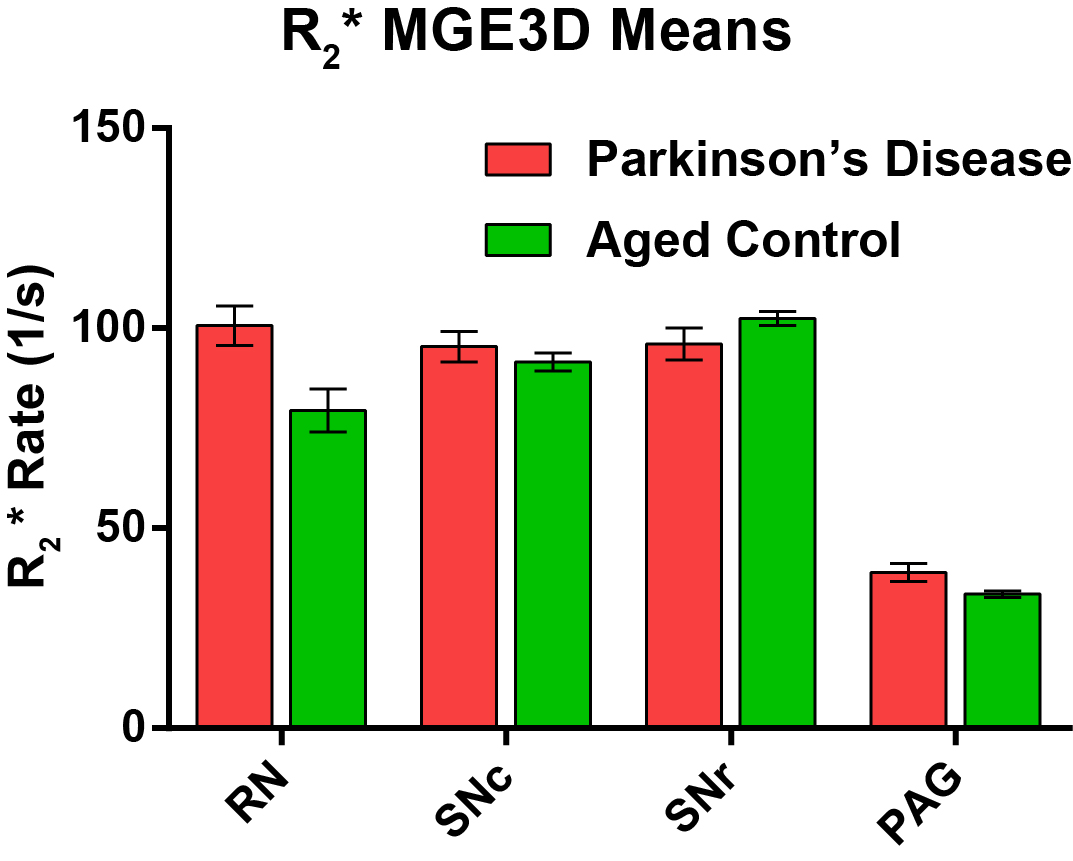
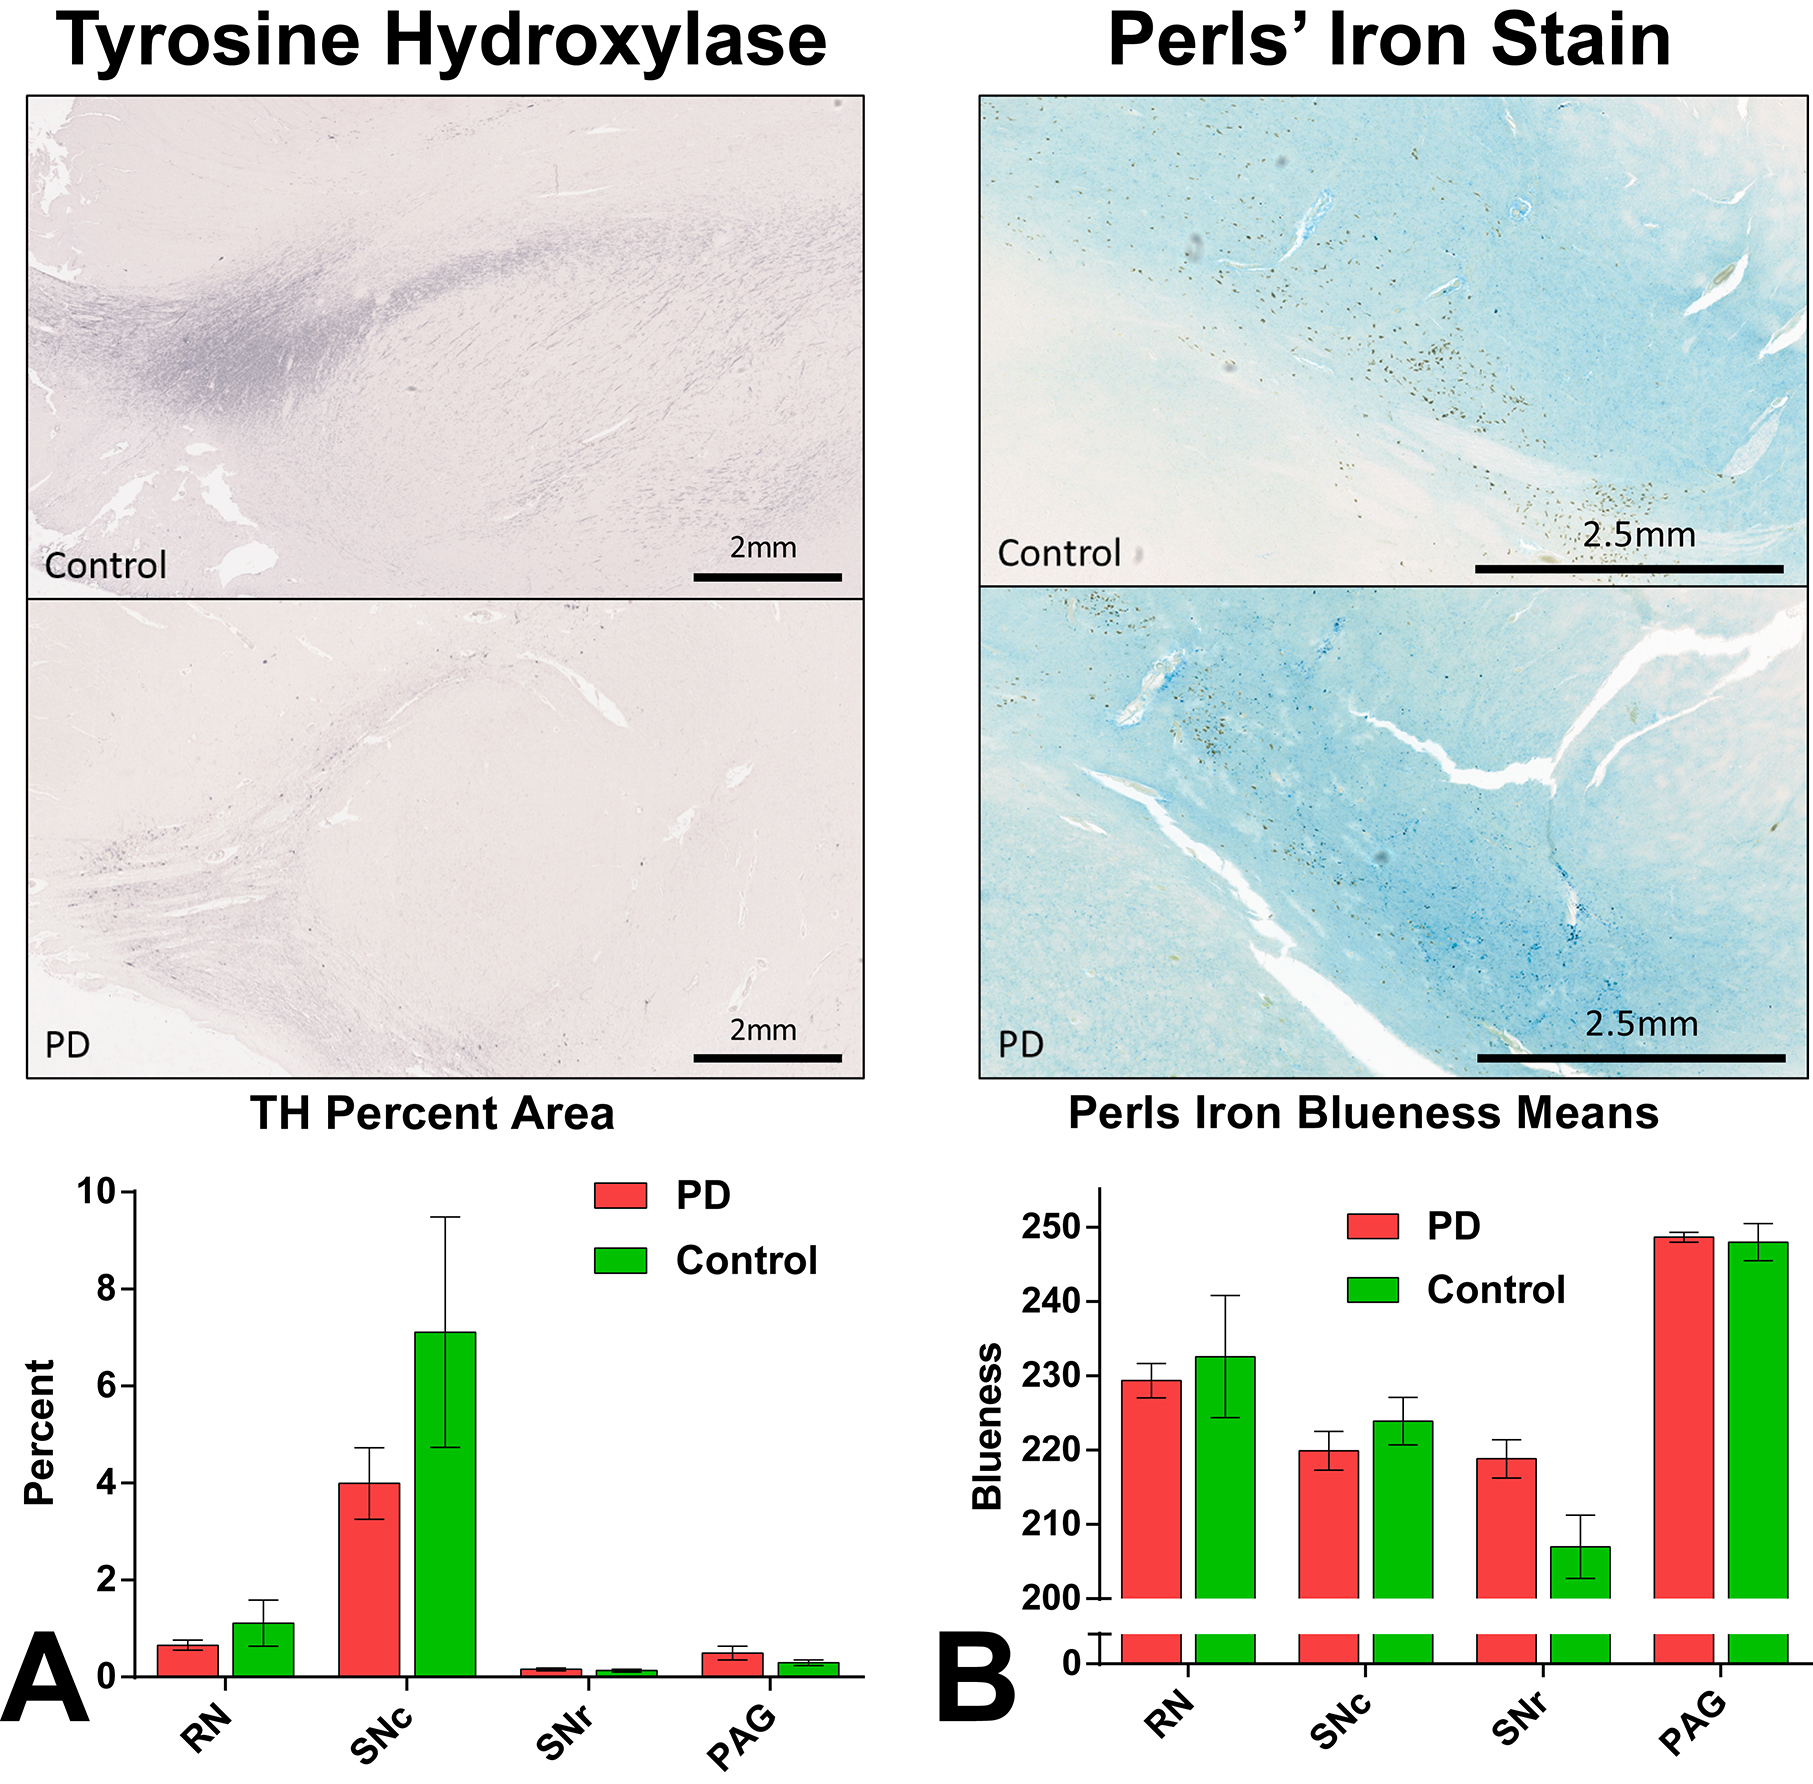
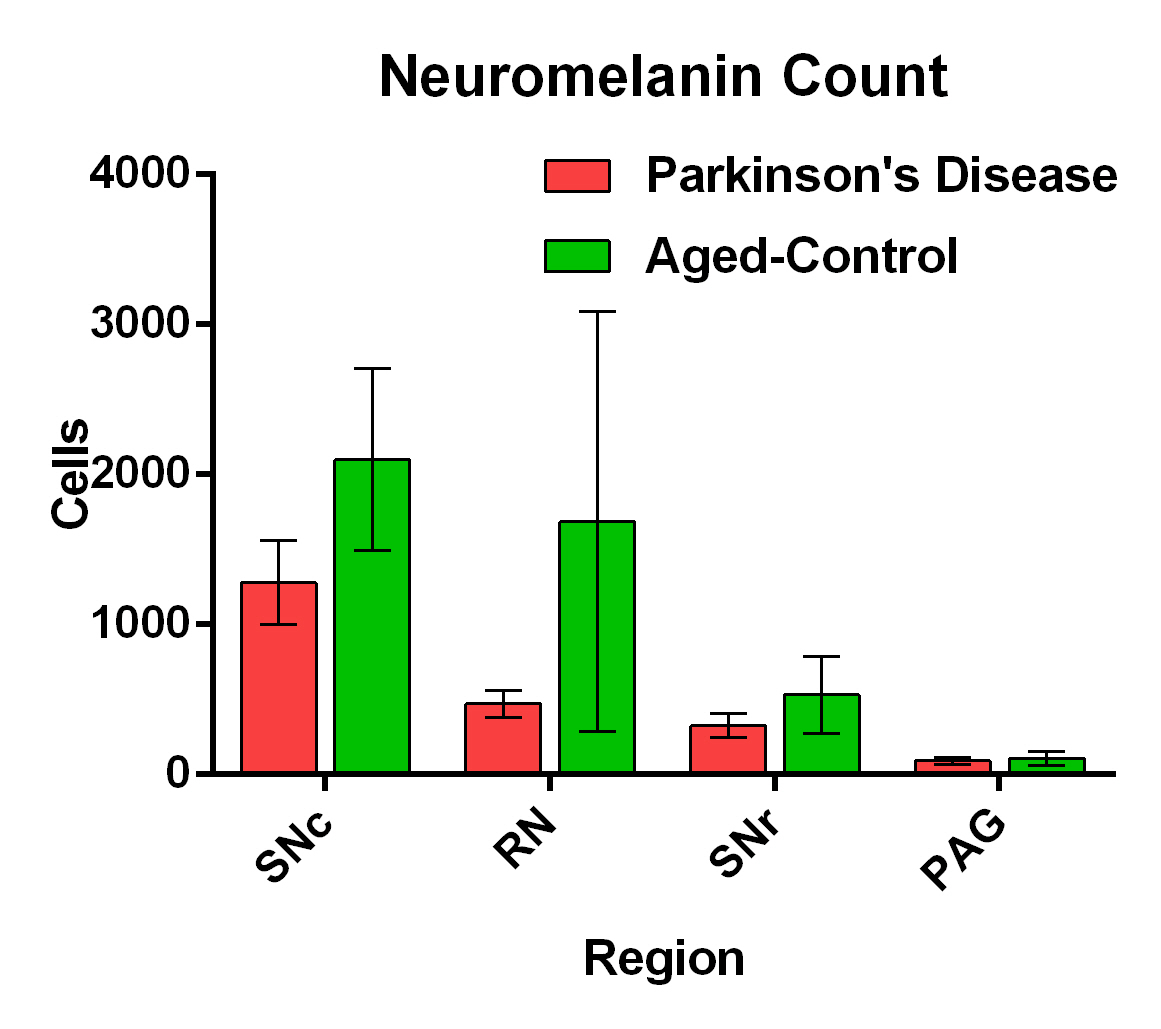
Parametric MRI R2* maps demonstrated an increase in relaxation rate compared to control subjects as well as an asymmetry in relaxation within Parkinson’s tissue (Fig. 1). Histograms of R2* rate demonstrated a skewing in Parkinson’s tissue towards a higher relaxation rate within the red nucleus with a subtle skewing in the SN pars compacta (Fig. 2). Relaxation rate means were significantly higher in the PD red nucleus and trended in the pars compacta (Fig. 3). PD subjects showed a decrease in tyrosine hydroxylase staining in the pars compacta (Fig. 4a) and an increase in iron staining within the pars reticulata. A decrease in neuromelanin deposition was found in the pars compacta and red nucleus of PD subjects (Fig. 5).Discussion/ Conclusion
This work demonstrates that there are quantifiable MRI and histological metrics which may be correlated in PD patients. PD subjects showed a decrease in neuromelanin-containing neurons and a decrease in tyrosine hydroxylase, both of which are characteristic of Parkinsonian conditions. PD subjects also showed an increase in iron-loading in the SNc and RN, which could explain dopaminergic cell death in PD. The increase in relaxation rate appears attributable to iron content , however future quantitative susceptibility mapping correlation will aid in understanding the role of iron and neuromelanin on image contrast. As we continue to study the role of iron in PD, possible diagnostic techniques may be elucidated using MRI.Acknowledgements
No acknowledgement found.References
1. Du G, Liu T, Lewis MM, et al. Quantitative susceptibility mapping of the midbrain in Parkinson's disease. Mov Disord. Mar 2016;31(3):317-324.
2. Nixon AM, Meadowcroft MD, Neely EB, et al. HFE Genotype Restricts the Response to Paraquat in a Mouse Model of Neurotoxicity. J Neurochem. Jan 8 2018.
Figures