0962
Distinctive structural connectivity between cognitively impaired and nonimpaired active professional fighters1Imaging Research, Cleveland Clinic Lou Ruvo Center for Brain Health, Las Vegas, NV, United States, 2University of California, San Diego, San Diego, CA, United States, 3Cleveland Clinic Lou Ruvo Center for Brain Health, Las Vegas, NV, United States
Synopsis
Using neuropsychological scores from the Professional Fighters Brain Health Study (PFBHS), this study first identified 70 cognitively impaired active professional
Introduction
Both active and retired professional athletes with repeated head trauma are more likely to suffer from cognitive decline and loss of executive and attention functions when compared to age-matched healthy controls1. Studies with diffusion-weighted magnetic resonance imaging (dMRI) in active fighters have shown changes in the scalar diffusion-derived metrics such as fractional anisotropy (FA) and mean diffusivity (MD) in the temporal and occipital white matter (WM) tracts and splenium of corpus callosum2–4. Our previous analyses5 with binarized structural connectivity revealed an increase in short-range connectivity pattern that may be responsible for cognitive decline due to repeated head trauma. However, whether weighted structural connectivity where the structural connectivity strength may be modulated by changes in FA also exhibits a similar pattern is not known. Hence, in this study, we employed graph-theoretical approaches on weighted structural connectivity to understand whether there is a structural connectivity pattern shift between cognitively impaired and nonimpaired active professional fighters using a dMRI dataset from the Professional Fighters Brain Health Study (PFBHS)6.Methods
Subjects: A total of 252 active professional fighters (18 females (F)) were recruited at our centre. Each subject went through a battery of neuropsychological assessment tests to measure psychomotor speed (PSY) and processing speed (P). The fighters were classified as cognitively impaired if the standardized PSY and P scores were 1.5 standard deviations below the mean7. Data Acquisition: Single-shot-EPI sequence was used to acquire dMRIs with 71 diffusion directions and b-value of 1000s/mm2; TR/TE/Resolution=7000ms/91ms/2.5mm3 on all subjects with a 3T Siemens Verio scanner with a 32 channel head coil. Only 69 impaired fighters (3F, age=29.77±6.22 years, years of education (YOE)=13.17±2.16 years) had acceptable dMRI data. 70 nonimpaired fighters (7F, age=29.2±6.5 years, YOE=13.66±1.68 years) were then selected randomly from the remaining cohort of active fighters but matched for all demographics. Standard processing steps were used to fit diffusion tensors after eddy current distortion correction in FSL. Network construction: AAL atlas8 was used to generate 90 AAL nodes of the network. MNI152 template was normalized to each subject’s native diffusion space and the resultant transformation matrix was applied to the AAL atlas to get the nodes in subject’s native space. Whole brain tractography was performed using diffusion toolkit (http://www.trackvis.org/dtk/)9. Fibers smaller than 10mm10 or having FA<0.2 were removed from any further analysis. Each internode connection (edge) was weighted by the product of the number of fibres and average FA of the fibres connecting the two nodes. Graph-theoretical measures: Various global and local graph-theoretical measures were computed using GRETNA11 within each group. Various sparsity thresholds (5-40%, step=1%) were used to identify the minimum sparsity at which the network is fully connected. A rich-club analysis was also performed to understand whether the structural connectivity pattern has preferentially organized to form distinctive network hubs in both groups. Statistical analysis: Network-based statistic (NBS)12 was used to statistically quantify differences in the weighted structural connectivity pattern between the groups. A linear regression (using PALM13 in FSL) between graph-theoretical properties and neuropsychological scores was performed to further understand the neuroanatomical correlates of the neuropsychological scores. All statistical comparisons were corrected for family-wise error at p<0.05.Results
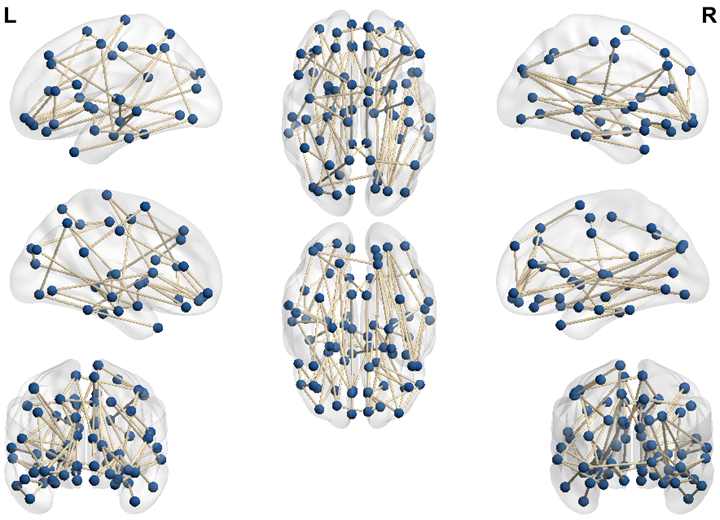
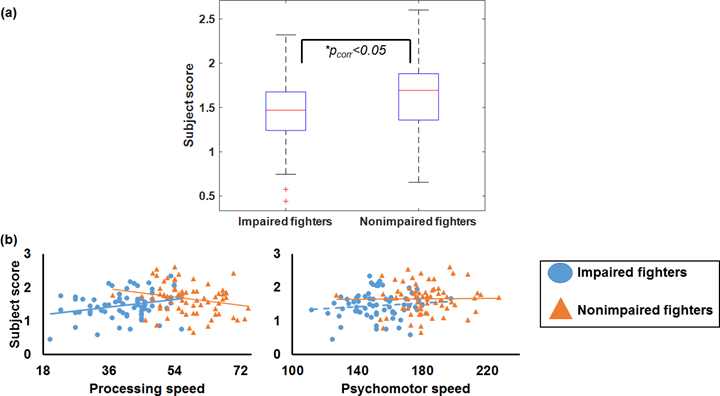
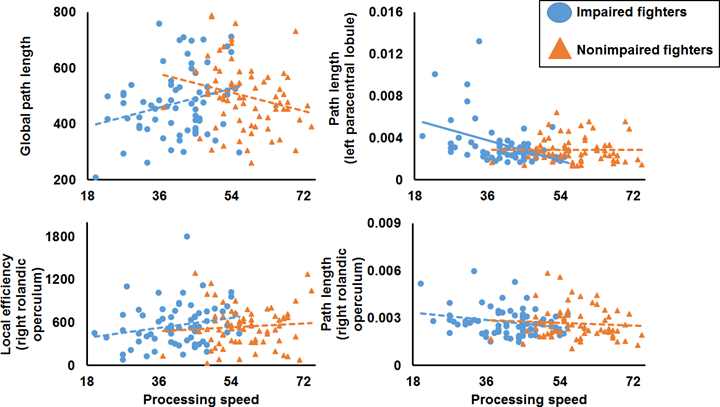
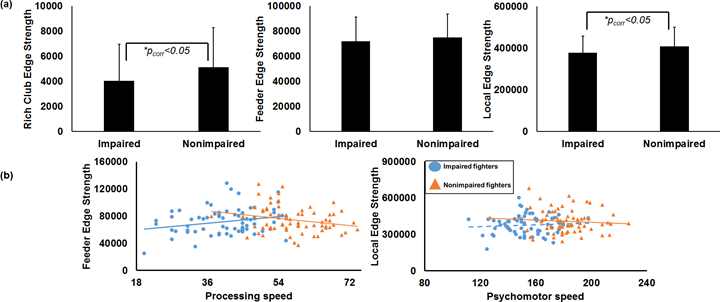
NBS revealed that impaired fighters have a disrupted structural connectivity pattern, as shown previously, but the pattern reversed with weighted connectivity as nonimpaired fighters had a stronger cortico-cortical connectivity as compared to nonimpaired fighters (Fig.1). Further, the overall structural connectivity score was lower in impaired fighters which was also correlated differentially with the neuropsychological score (Fig.2). Significant difference in the association of global path length with processing speed was found between the groups (Fig.3). In addition, efficiency and path length was also differentially associated between the groups (Fig.3). Both groups exhibited the presence of rich-club organization. However, a significantly lower rich club edge strength and local edge strength was found for cognitively impaired fighters (Fig.4). In addition, there was a significantly different slope of association with feeder edge strength and local edge strength with the neuropsychological scores (Fig.4).Discussion and Conclusion
Our study showed that there is a disrupted structural connectivity pattern between cognitively impaired and nonimpaired fighters, as reported previously5. However, the pattern of connectivity pattern reversed with weighted connectivity matrix. This finding suggests that even though there is an increase in short-range connectivity patterns in cognitively impaired fighters with binarized strength, the weights of the connectivity plays a “compensatory” role, and possibly reverses those short-range patterns observed in cognitively impaired fighters. In addition, there is an overall lower structural connectivity strength in cognitively impaired fighters suggesting that repeated head trauma induces a global brain shift in fighters experiencing cognitive decline.Acknowledgements
This work was supported by an Institutional Development Award (IDeA) from the National Institute of General Medical Sciences of the National Institutes of Health under grant number 5P20GM109025, and private grant funds from the Lincy Foundation, the Peter and Angela Dal Pezzo funds, and the young scientist award.References
1 McKee AC, Stern RA, Nowinski CJ, Stein TD, Alvarez VE, Daneshvar DH et al. The spectrum of disease in chronic traumatic encephalopathy. Brain 2013; 136: 43–64.
2 Montenigro PH, Bernick C, Cantu RC. Clinical features of repetitive traumatic brain injury and chronic traumatic encephalopathy. Brain Pathol 2015; 25: 304–317.
3 Hulkower MB, Poliak DB, Rosenbaum SB, Zimmerman ME, Lipton ML. A decade of DTI in traumatic brain injury: 10 years and 100 articles later. AJNR Am J Neuroradiol 2013; 34: 2064–2074.
4 Wintermark M, Sanelli PC, Anzai Y, Tsiouris AJ, Whitlow CT. Imaging evidence and recommendations for traumatic brain injury: advanced neuro- and neurovascular imaging techniques. AJNR Am J Neuroradiol 2015; 36: E1–E11.
5 Mishra V, Sreenivasan K, Yang Z, Zhuang X, Banks S, Cordes D et al. Exploring diffusion derived connectivity patterns between cognitively impaired and nonimpaired active professional fighters. In: ISMRM. 2018.
6 Bernick C, Banks S, Phillips M, Lowe M, Shin W, Obuchowski N et al. Professional fighters brain health study: Rationale and methods. Am J Epidemiol 2013; 178: 280–286.
7 Schinka JA, Loewenstein DA, Raj A, Schoenberg MR, Banko JL, Potter H et al. Defining mild cognitive impairment: impact of varying decision criteria on neuropsychological diagnostic frequencies and correlates. Am. J. Geriatr. Psychiatry. 2010; 18: 684–91.
8 Tzourio-Mazoyer N, Landeau B, Papathanassiou D, Crivello F, Etard O, Delcroix N et al. Automated anatomical labeling of activations in SPM using a macroscopic anatomical parcellation of the MNI MRI single-subject brain. Neuroimage 2002; 15: 273–289.
9 Wang R, Wedeen VJ. TrackVis.org. In: Proc Intl Soc Mag Reson Med. 2007, p 3720.
10 Cheng H, Wang Y, Sheng J, Sporns O, Kronenberger WG, Mathews VP et al. Optimization of seed density in DTI tractography for structural networks. J Neurosci Methods 2012; 203: 264–272.
11 Wang J, Wang X, Xia M, Liao X, Evans A, He Y. GRETNA: a graph theoretical network analysis toolbox for imaging connectomics. Front Hum Neurosci 2015; 9: 386.
12 Zalesky A, Fornito A, Bullmore ET. Network-based statistic: identifying differences in brain networks. Neuroimage 2010; 53: 1197–1207.
13 Winkler AM, Ridgway GR, Webster MA, Smith SM, Nichols TE. Permutation inference for the general linear model. Neuroimage 2014; 92: 381–397.
Figures