0959
White matter changes in the perforant path in patients with amyotrophic lateral sclerosis1Department of Anatomy, Donders Institute for Brain, Cognition and Behaviour, Radboud University Medical Center, Nijmegen, Netherlands, 2Wellcome Centre for Integrative Neuroimaging, FMRIB, University of Oxford, Oxford, United Kingdom, 33Nuffield Department of Clinical Neurosciences, University of Oxford, Oxford, United Kingdom
Synopsis
Patients with amyotrophic lateral sclerosis (ALS) and frontotemporal dementia (FTD) share clinical overlap in terms of cognitive decline and are both characterised by the deposition of pathological TDP-43 inclusions in the brain. Here, we hypothesize that white matter degeneration of the perforant path in the hippocampus is a key feature of ALS patients developing FTD-like symptoms. Using diffusion MRI, polarized light imaging (PLI) and immunohistochemical (IHC) analysis we analysed white matter in the perforant path. dMRI and PLI measures suggest white matter degeneration in this pathway; however, densitometric analysis of IHC did not support this interpretation.
Introduction
Amyotrophic lateral sclerosis (ALS) is a severe, progressive and incurable motor neuron disease and sometimes co-occurs with frontotemporal dementia (FTD). Both diseases are characterised by the aggregation of 43 kDa TAR DNA binding protein (TDP-43). Spreading of TDP-43 inclusions in ALS towards brain-regions that connect via Papez circuit is a hallmark for FTD-development1. The perforant path (PP) in the hippocampus is part of Papez circuit and we hypothesize that white matter degeneration along the PP is a marker for development of FTD in ALS patients. Grey matter degeneration was previously found close to the PP area of ALS patients with memory deficits2.
In-vivo MRI of the PP is challenging due its small size. Furthermore, the microscopic correlates of MRI signals are ill defined. We therefore conducted diffusion MRI (dMRI) in ex-vivo specimens of the hippocampus from ALS patients followed by microscopic examination with polarized light imaging (PLI) and several immunohistochemistry (IHC) stains to better interpret the dMRI microstructure estimates. PLI is sensitive to myelin density and fibre orientation and was previously applied to evaluate dMRI3.
Methods
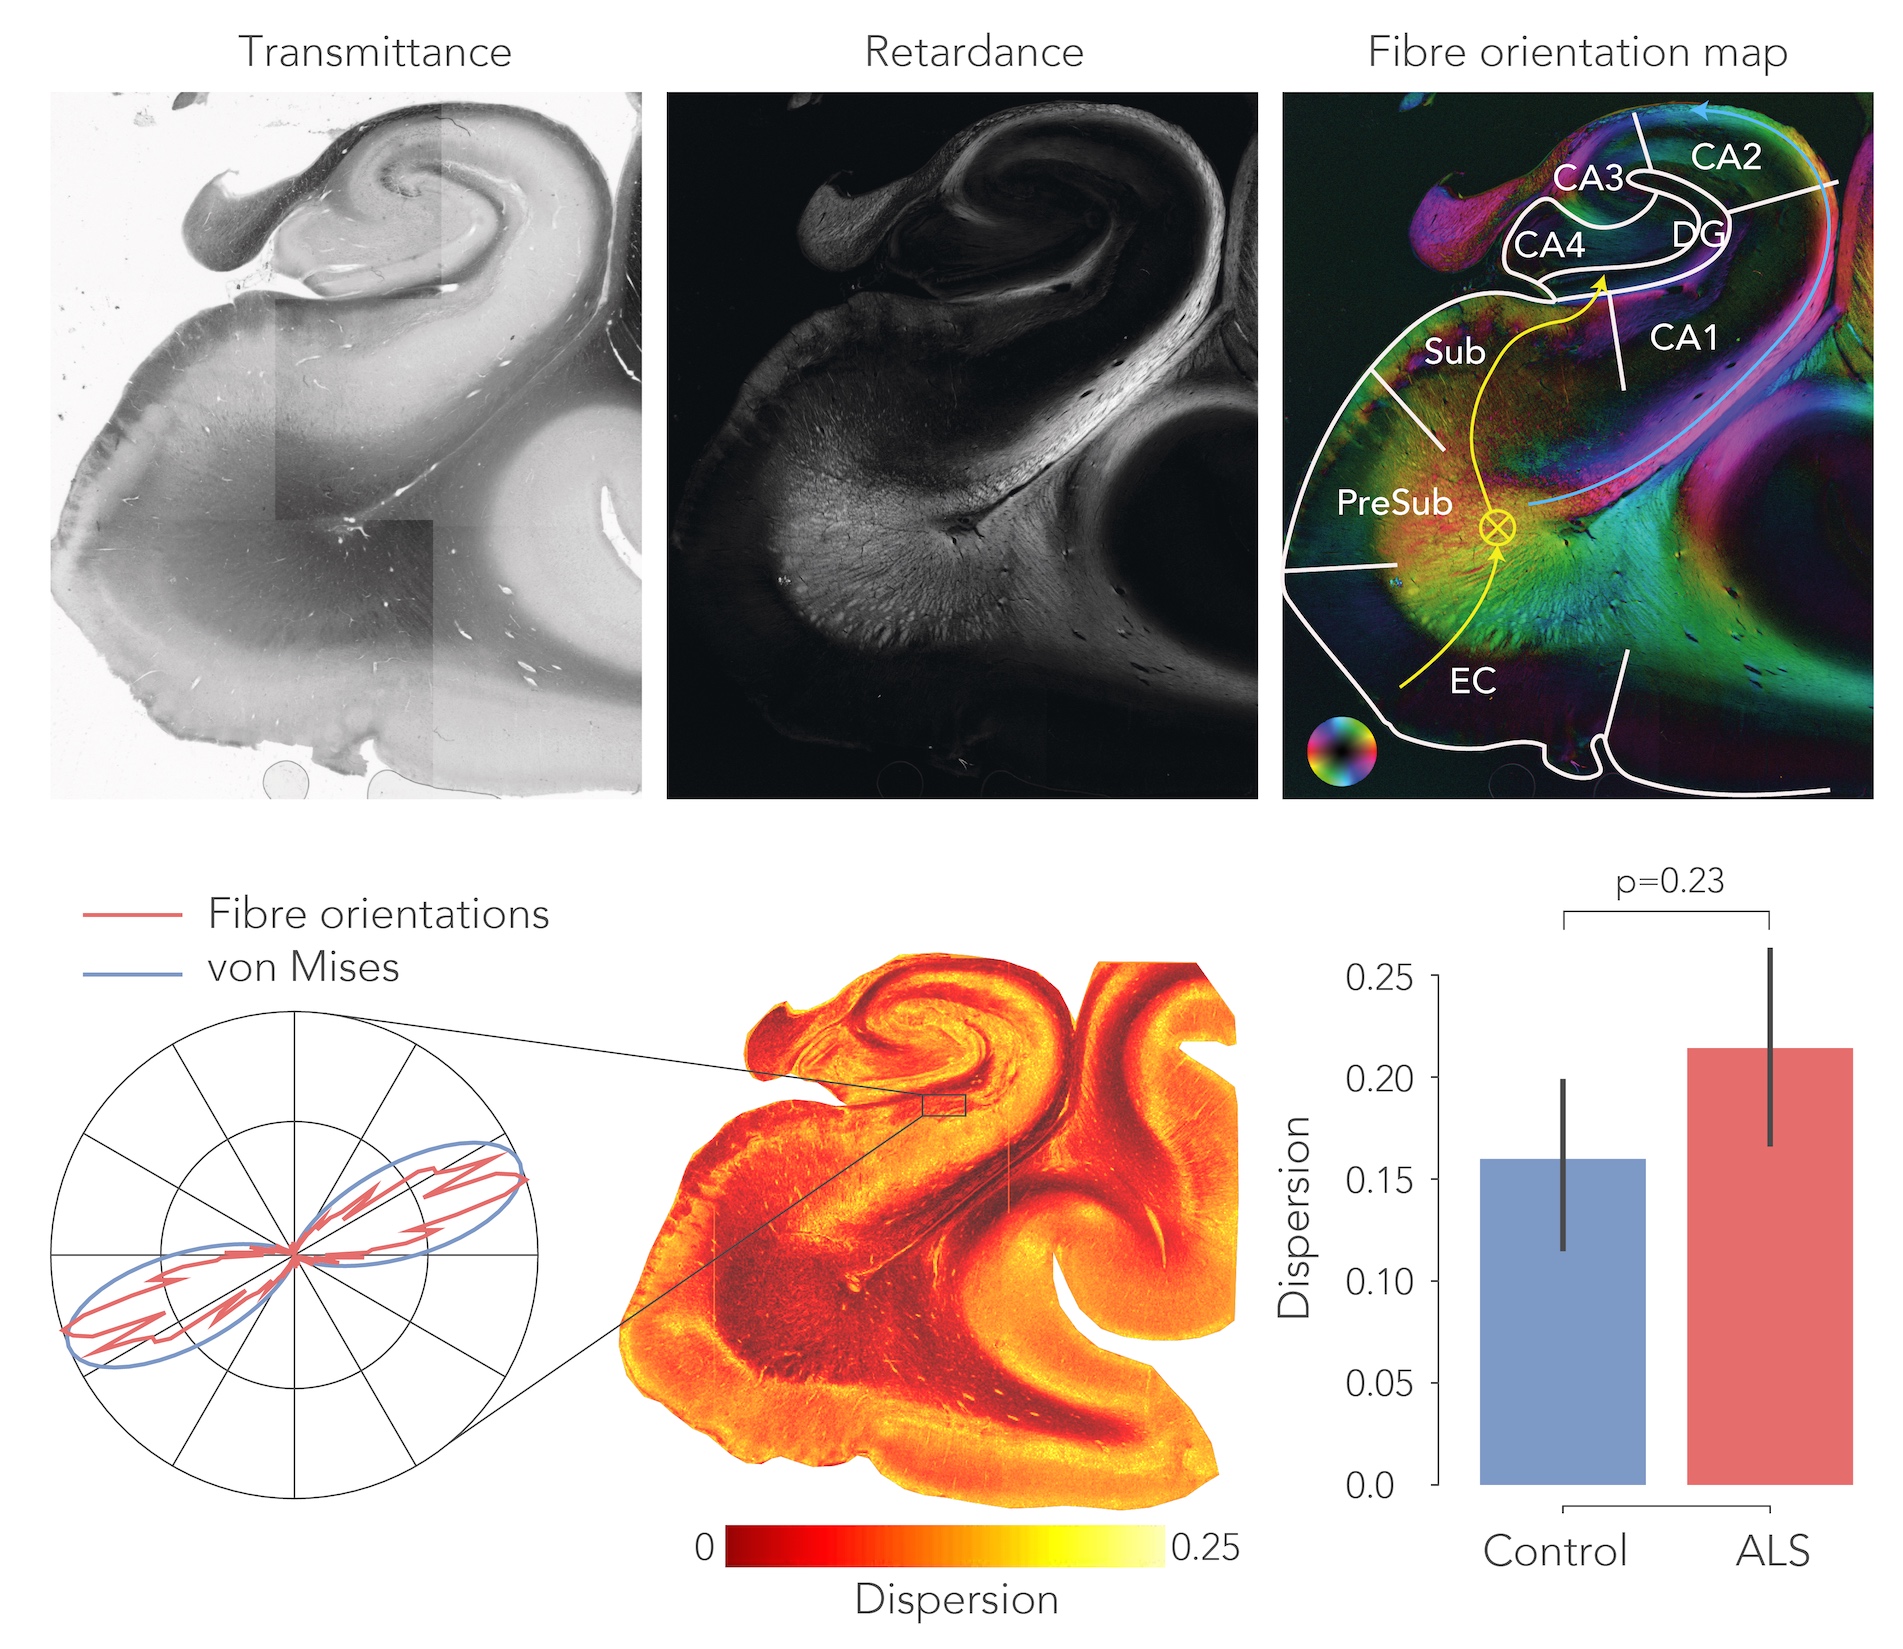
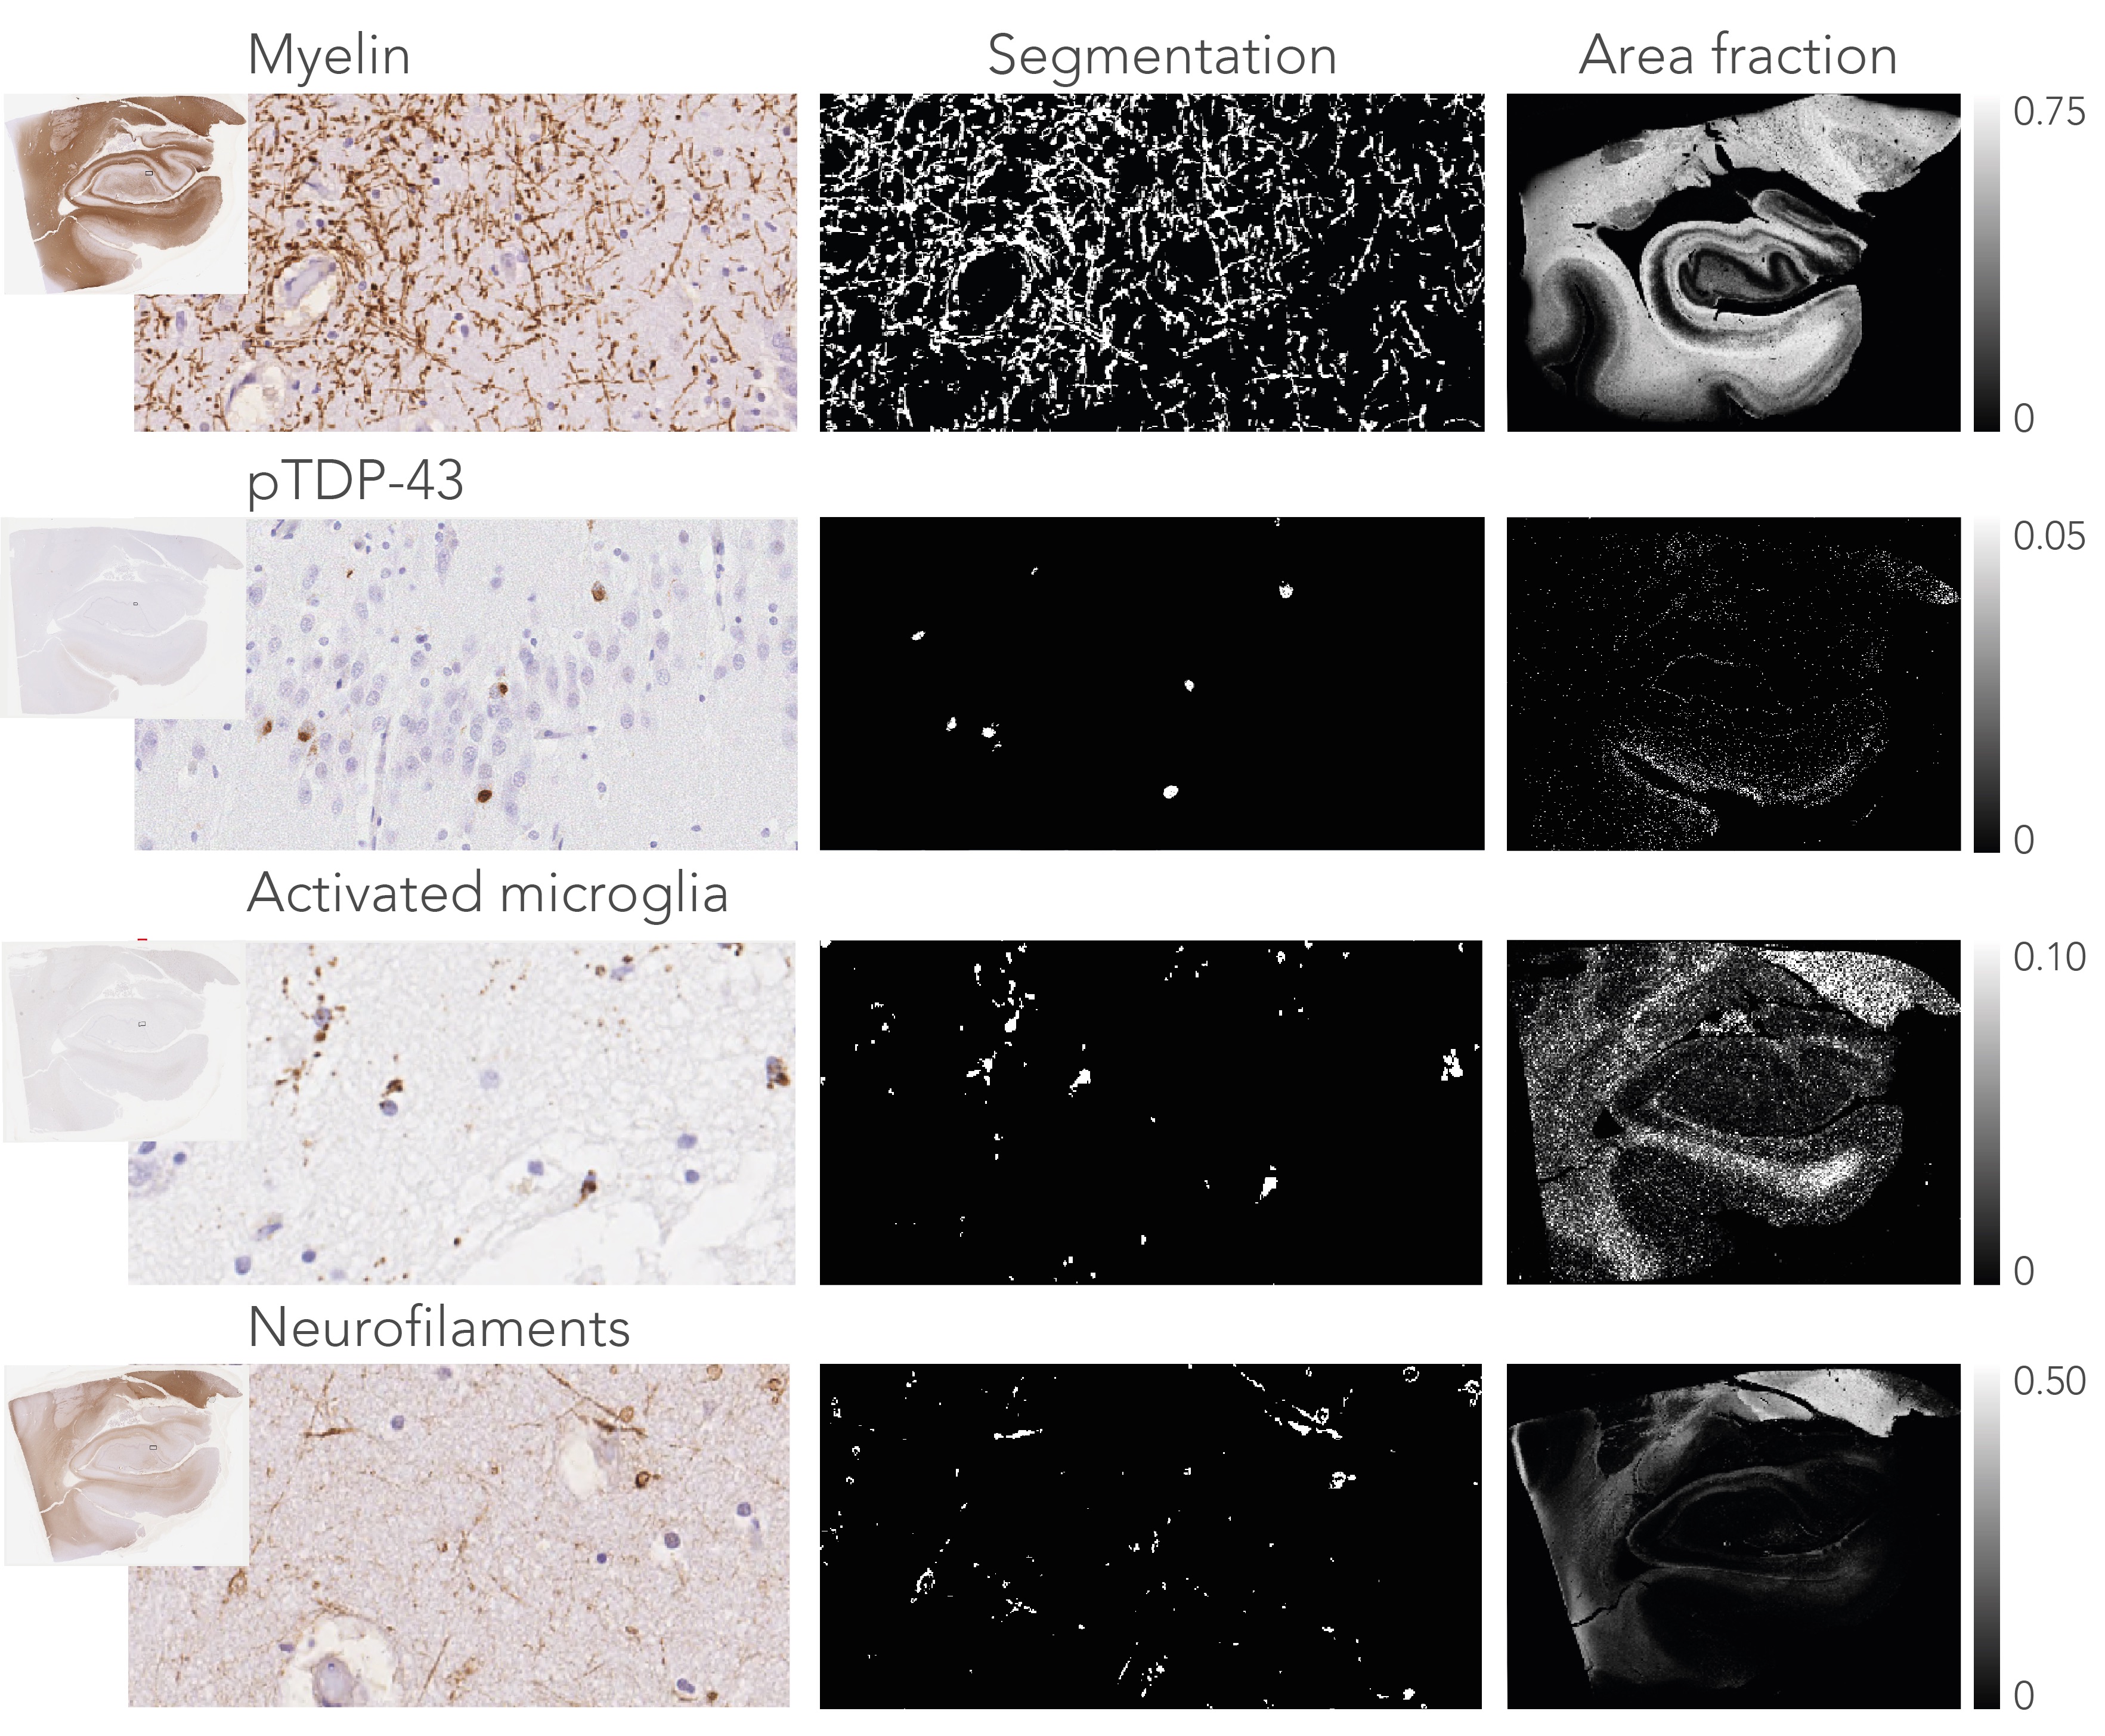
Post-mortem hippocampus specimens from ALS patients (n=13) and controls (n=5) were formalin fixed and scanned on a 11.7T Bruker pre-clinical MRI system using a Bruker birdcage coil. A spin-echo EPI dMRI sequence was employed to obtain diffusion weighted images at 0.4x0.4x0.4 mm resolution. 64 directions were acquired at b=4000 s/mm2, in addition to two non-diffusion weighted images. Additional parameters include: TR=13.75 s, TE= 30.1 ms, Δ=12.5 ms and δ=4.0 ms. An anatomical reference scan was acquired using a T1-weighted FLASH sequence at a resolution of 0.1x0.1x0.1 mm (TR=25 ms, TE=3.4 ms, flip angle=10ᵒ). Following MRI, the hippocampi were bisected, and the two halves were separately processed for PLI and IHC. PLI: The specimens were frozen and sectioned at 100μm. Images were acquired on a polarising microscope and processed4 to obtain PLI parameter maps (Figure 1). IHC: These specimens were embedded in paraffin and sectioned at 6μm. The sections were stained for myelin (proteo-lipid-protein; PLP), phosphorylated neurofilaments (SMI-312), activated microglia (CD68) and phosphorylated TDP-43 (pTDP-43).
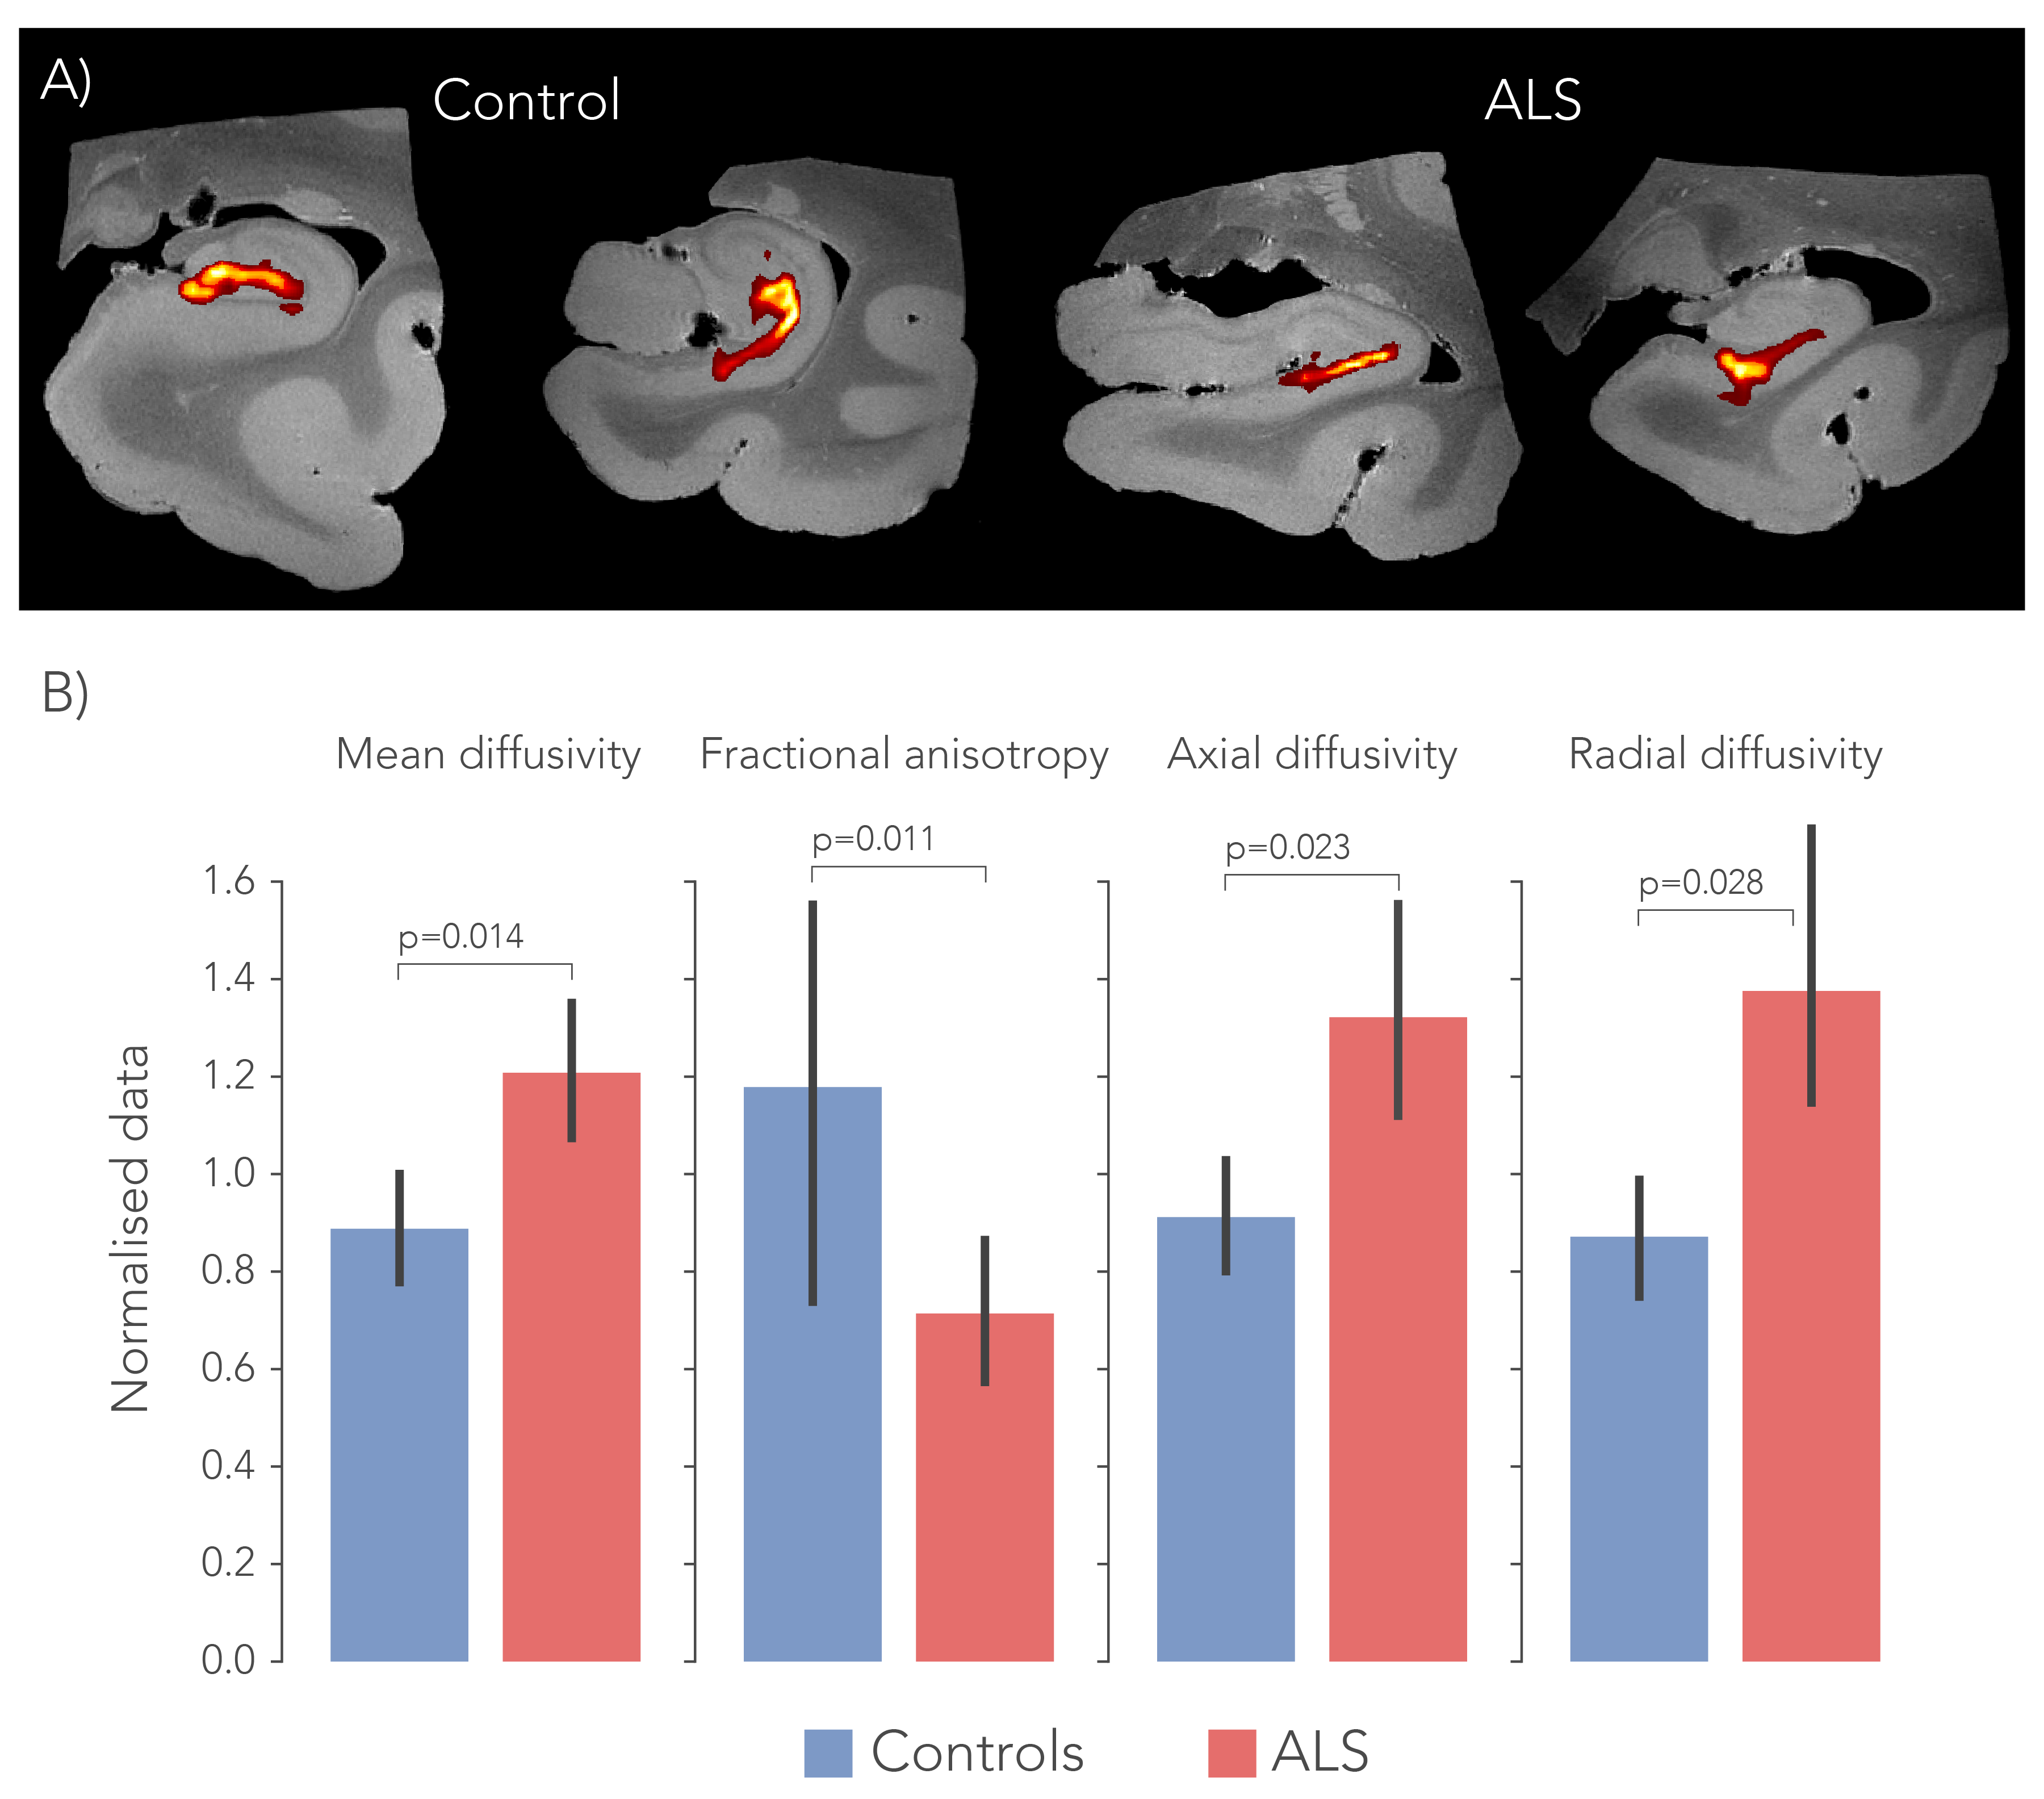
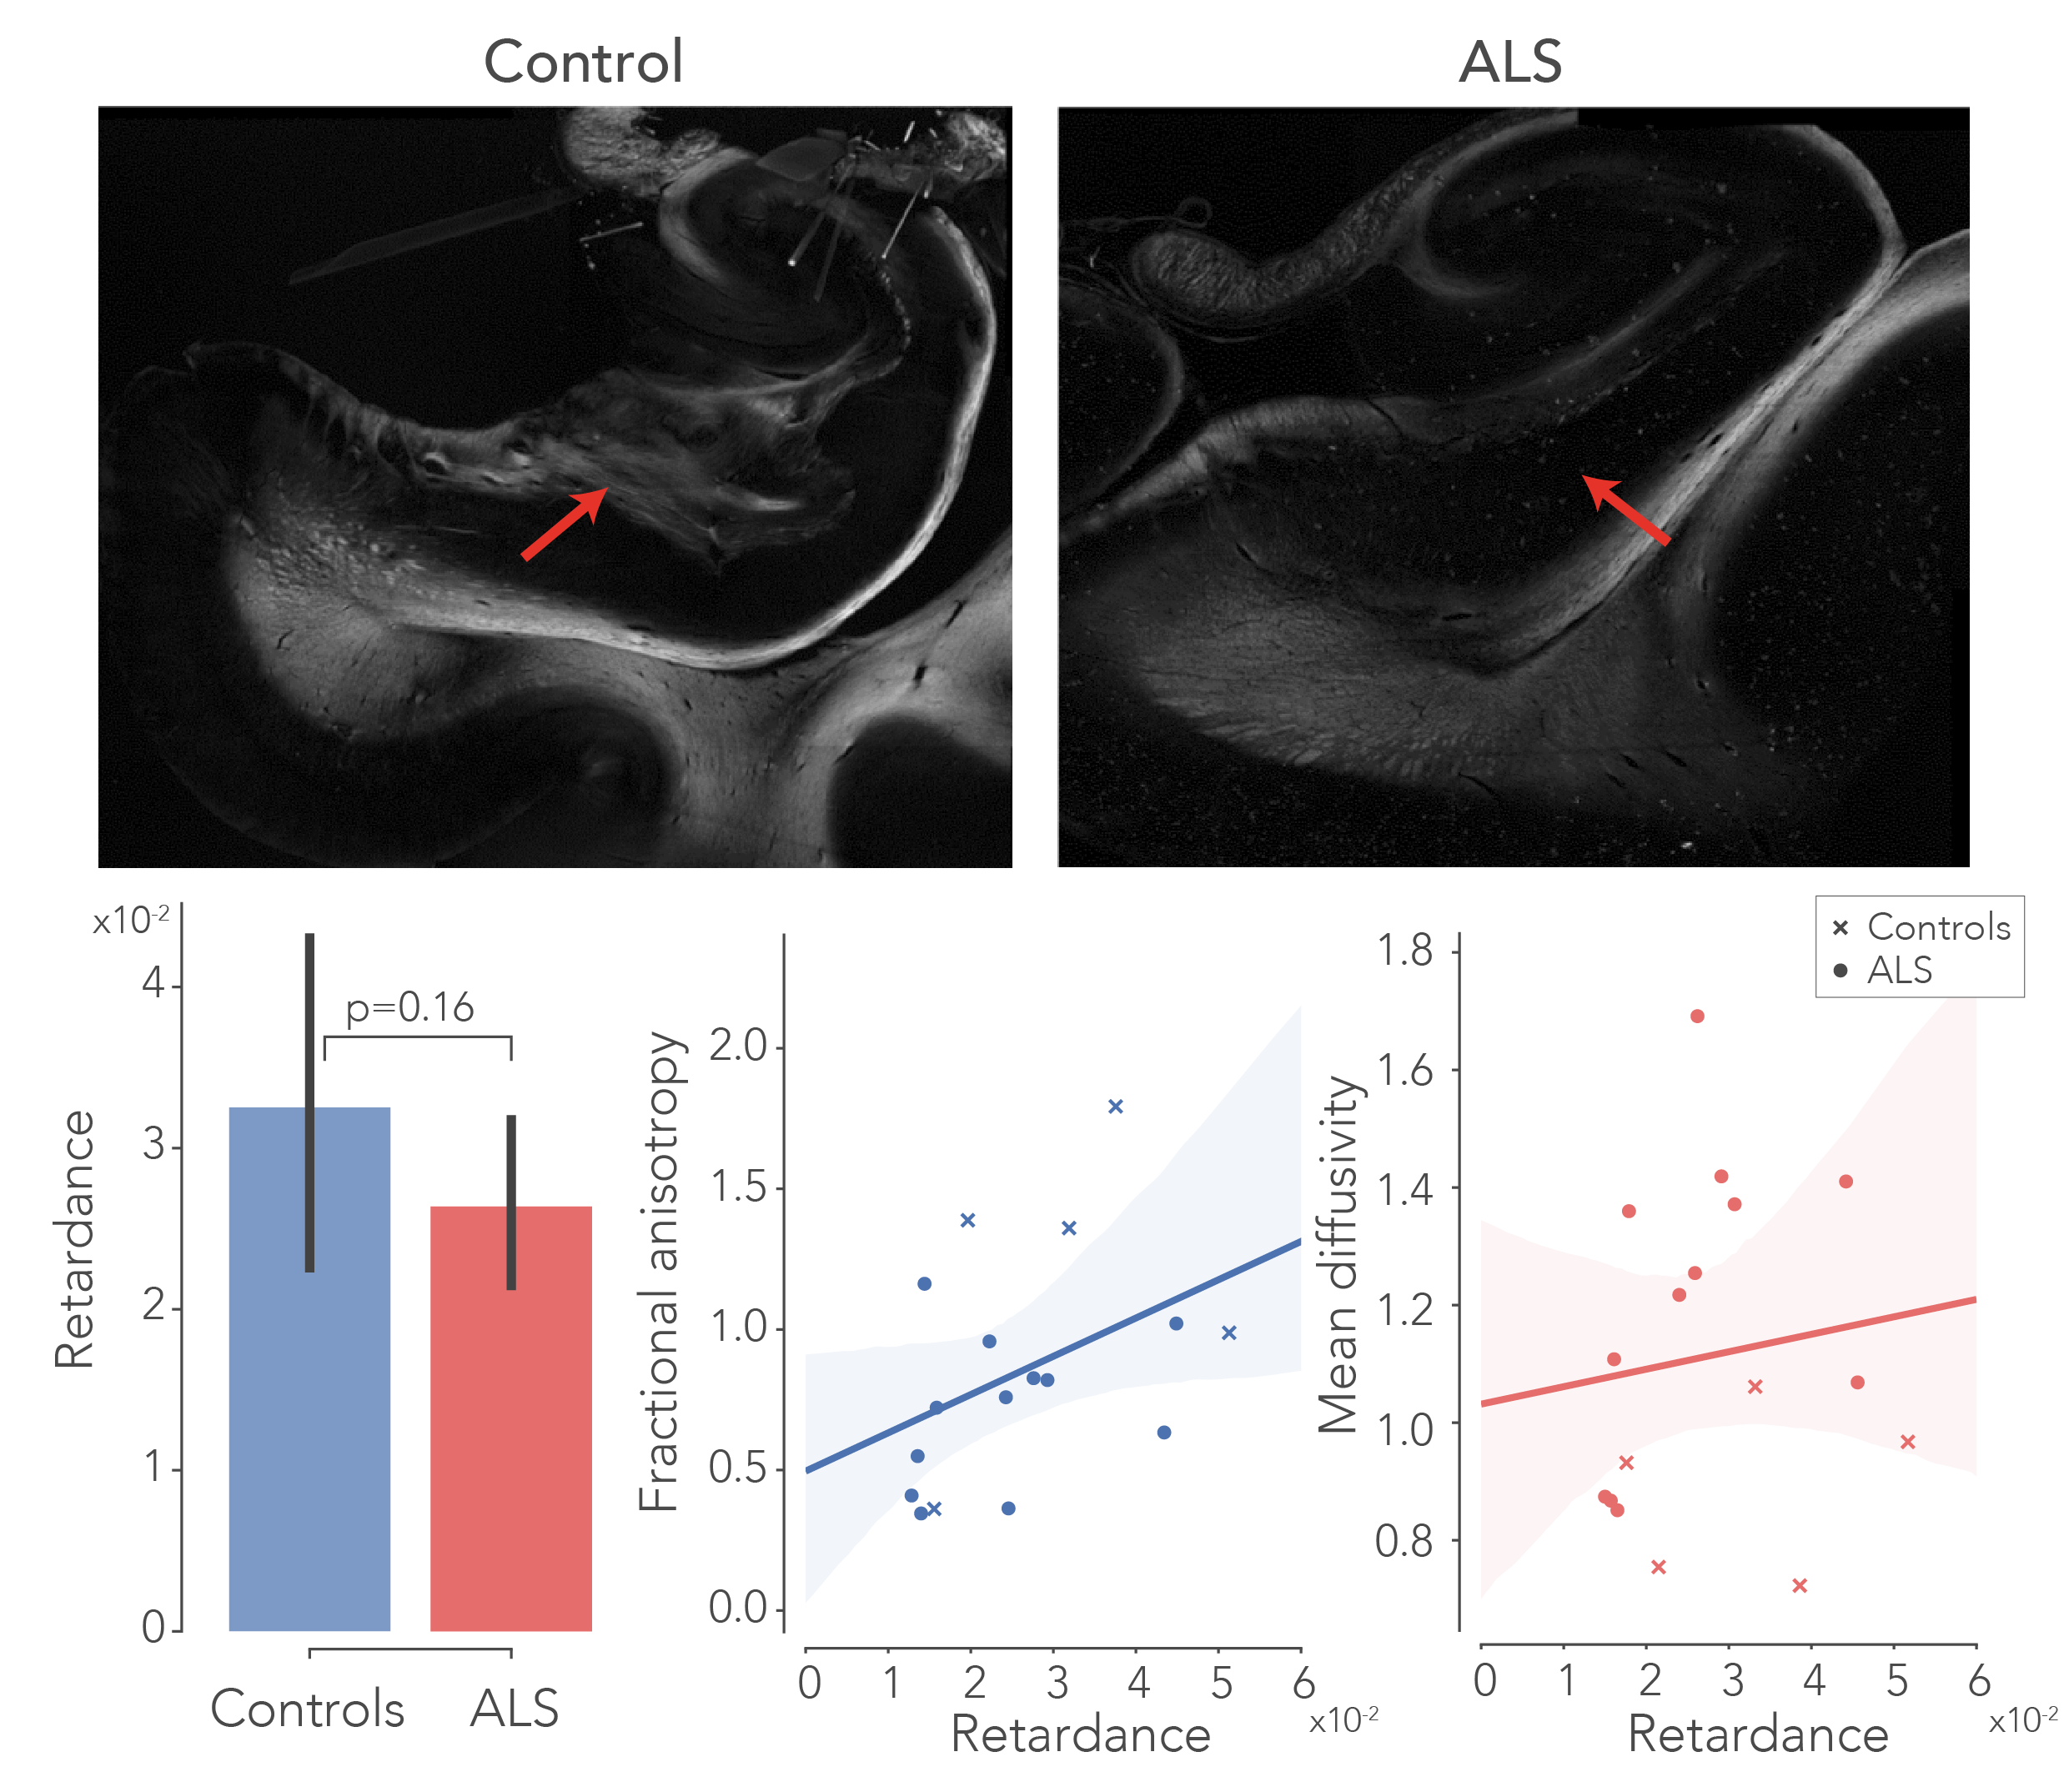
To delineate the PP, dMRI tractography5 was carried out from the subiculum to the dentate gyrus. Diffusion tensor estimates (axial, AD; radial, RD; and mean diffusivity, MD and fractional anisotropy, FA) were extracted from the PP and evaluated between groups. Likewise, fibre dispersion and retardance were derived from PLI data as markers of local fibre coherence and myelin density, respectively. dMRI and PLI data were registered together using custom software6. IHC staining intensity was quantified using an area fraction after colour-segmenting the images (Figure 4).
Results
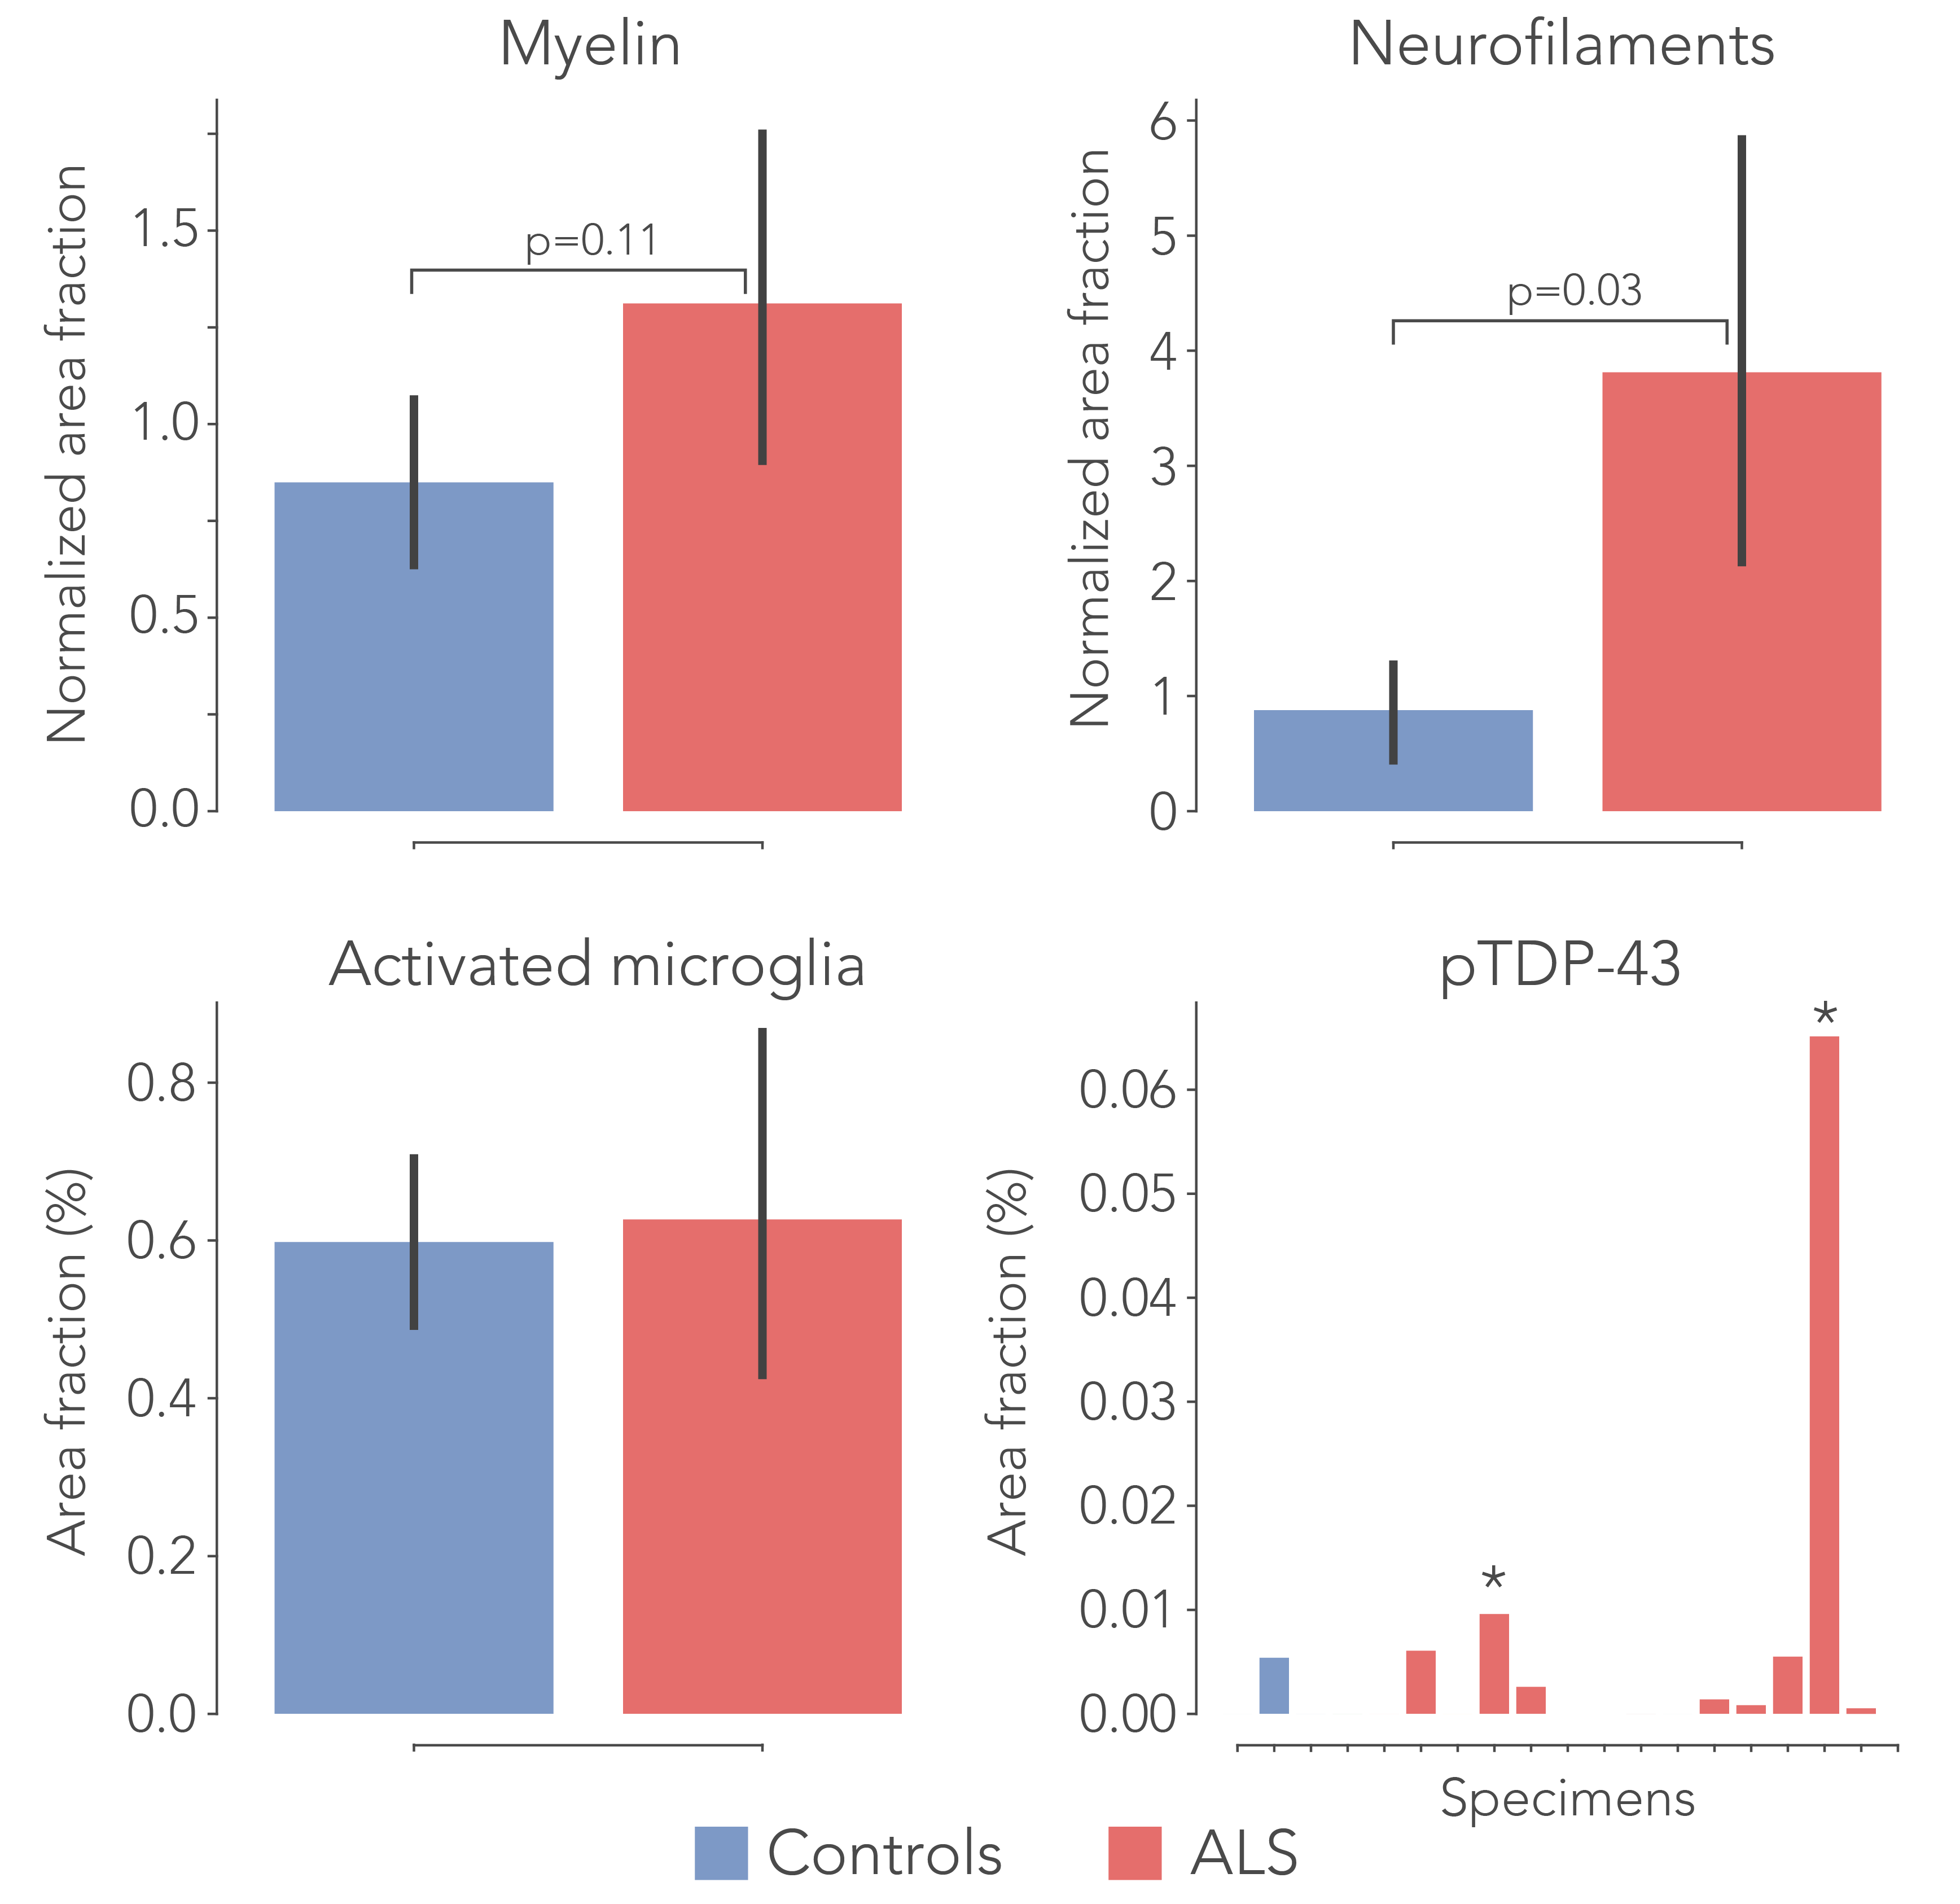
After normalization with a control region (i.e., entorhinal cortex) in each sample, all diffusivity metrics showed significant differences between ALS and controls, in particular MD increased and FA decreased, suggesting white matter degeneration (Figure 1). PLI supported these findings, with increased fibre dispersion (Figure 2) and lowered myelination (as reflected in retardance) (Figure 3) in ALS. However, these differences were not statistically significant (one-sided T-test). IHC showed contradicting results; levels of myelin and neurofilaments were increased in ALS. Furthermore, no elevated levels of neuroinflammation (CD68) were found in ALS compared to controls and only two out of thirteen ALS cases demonstrated severe TDP-43 pathology in the hippocampus (Figure 5), a definitive marker of FTD.Discussion
The dMRI and PLI results suggest white matter degeneration in the perforant path in ALS patients. Having lowered FA and increased MD indicates a loss of coherence of fibres in addition to less diffusion restriction caused by either increased extra-cellular space or axonal/myelin loss. While the PP is generally bigger than the imaging resolution employed here, partial volume effects as a result of atrophy may drive some of these effects. PLI was in accordance with dMRI and appears to be a useful addition to study pathological tissue. These results substantiate the hypothesis that ALS forms a disease spectrum with FTD. While no clinical records from the ALS patients were available, disrupted connectivity in the PP may provide evidence for cognitive deficits found in ALS patients. However, IHC results were conflicting, as increased levels of myelin and neurofilaments were measured. Possibly this is caused by tissue processing differences between controls and patients (fixation time/post-mortem interval), that may have affected the IHC antibody labelling. Future research should focus on correlating the degree of clinically observed cognitive decline to the amount of white matter atrophy in the PP. The use of more advanced diffusion models7 may also boost specificity of the underlying tissue changes.Acknowledgements
We would like to acknowledge “Stichting Alzheimer Nederland” for their funding support. Furthermore, we would like to acknowledge P.J.W.C. Dederen for instructing in the cutting of the sections for PLI and Dr. M. Wiessman for his excellent support with the MRI protocols. Also, thanks to C. Grabitz and J. de Ruyter van Steveninck for their lab work. Finally, we acknowledge the Oxford brain bank as well as the body Donor program from the department of Anatomy, Radboud UMC Nijmegen for providing the post-mortem specimens.References
1. Brettschneider, J. et al. Sequential distribution of pTDP-43 pathology in behavioral variant frontotemporal dementia (bvFTD). Acta Neuropathol.127,423–439 (2014).
2. Takeda, T., Uchihara, T., Mochizuki, Y., Mizutani, T. & Iwata, M. Memory deficits in amyotrophic lateral sclerosis patients with dementia and degeneration of the perforant pathway. A clinicopathological study. J. Neurol. Sci. 260, 225–230 (2007).
3. Mollink, J. et al. Evaluating fibre orientation dispersion in white matter: Comparison of diffusion MRI, histology and polarized light imaging. Neuroimage 157,561–574 (2017).
4. Axer, M. et al. A novel approach to the human connectome: ultra-high resolution mapping of fiber tracts in the brain. Neuroimage 54,1091–101 (2011).
5. Behrens, T. E. J., Berg, H. J., Jbabdi, S., Rushworth, M. F. S. & Woolrich, M. W. Probabilistic diffusion tractography with multiple fibre orientations: What can we gain? Neuroimage 34,144–55 (2007).
6. Huszar, I. et al. Pipeline for registering histological sections to MRI volumes. in International Society for Magnetic Resonance in Medicine(2018).
7. Zhang, H., Schneider, T., Wheeler-Kingshott, C. A. & Alexander, D. C. NODDI: practical in vivo neurite orientation dispersion and density imaging of the human brain. Neuroimage 61,1000–16 (2012).
Figures