0957
Braak model investigation in Parkinson disease using multimodal MRI biomarkers1CENIR, ICM, Paris, France, 2Neuroradiology, APHP, Pitie Salpêtrière, Paris, France, 3Sorbonne Universite, Univ Paris 06, UMR S 1127, CNRS UMR 7225, ICM, Paris, France, 4ICM team Movement Investigation and Therapeutics, ICM, Paris, France, 5Clinique des mouvements anormaux, Département des Maladies du Système Nerveux, Hôpital Pitié-Salpêtrière, PARIS, France
Synopsis
The aim of this study was to test using multimodal MRI biomarkers if the pattern of neurodegeneration in the brain of patients with Parkinson disease (PD) fits the model of disease progression proposed by Braak and al. (2003). Partial Least Squares Path-Modeling of multi-modal imaging data was in-line with the Braak pathology model confirming the gradual lesions in PD brain. While substantia nigra damage was observed in all PD patients, Braak’s model of disease progression was better followed by PD patients with idiopathic rapid eye movement sleep behavior disorders (RBD) than without RBD as demonstrated by model goodness of fit.
INTRODUCTION
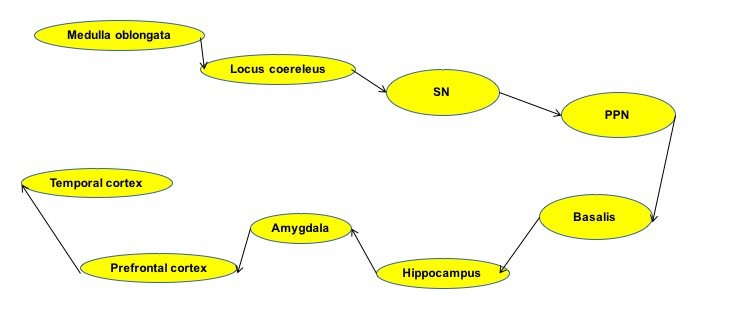
Parkinson’s disease (PD) is a progressive neurodegenerative illness characterized by extensive damage to dopaminergic neurons in the substantia nigra (SN) pars compacta1. The nigral damage is also accompanied by extensive extranigral pathology2. Braak et al.3 proposed a staging model, based on neuropathology, which suggested that damage extended progressively in 6 stages from the medulla oblongata to the midbrain and then to cortical structures. This model has been challenged4. There is also a clinical heterogeneity of the disease with some patients presenting more severe forms of the disease, while in others the damage would be more focused on the SN5. For instance, PD patients presenting rapid eye movement sleep behavior disorder (RBD) present a more severe form of PD. The aim of this study was to test using multimodal MRI biomarkers if the pattern of neurodegeneration in the brain of patients with Parkinson disease (PD) fits the model of disease progression proposed by Braak and al3.METHODS
Subjects: 54 patients with PD (age: 60.7±8.8 years, disease duration: 8.8±3.5 years, 34 patients with PD-RBD) were compared with 25 healthy volunteers (HV, age: 60.8±8.2 years).
MRI data acquisition: MRI acquisition was performed using a 3 Tesla TRIO TIM system (Siemens, Erlangen, Germany) using a 12-channel receive-only head coil. The protocol included 3D T1-weighted (T1-w) images, 3D T2-weighted (T2-w) images, DTI with the following parameters: TR/TE/flip angle =14000 ms/101ms/90°, voxel size=1.7*1.7*1.7mm3, b-value=1500s/mm2, 60 diffusion gradients directions) and neuromelanin-sensitive (NM) images were acquired using 2D axial turbo spin-echo T1-w images (TR/TE/flip angle: 900ms/15ms/180°, voxel size: 0.4*0.4*3mm3).
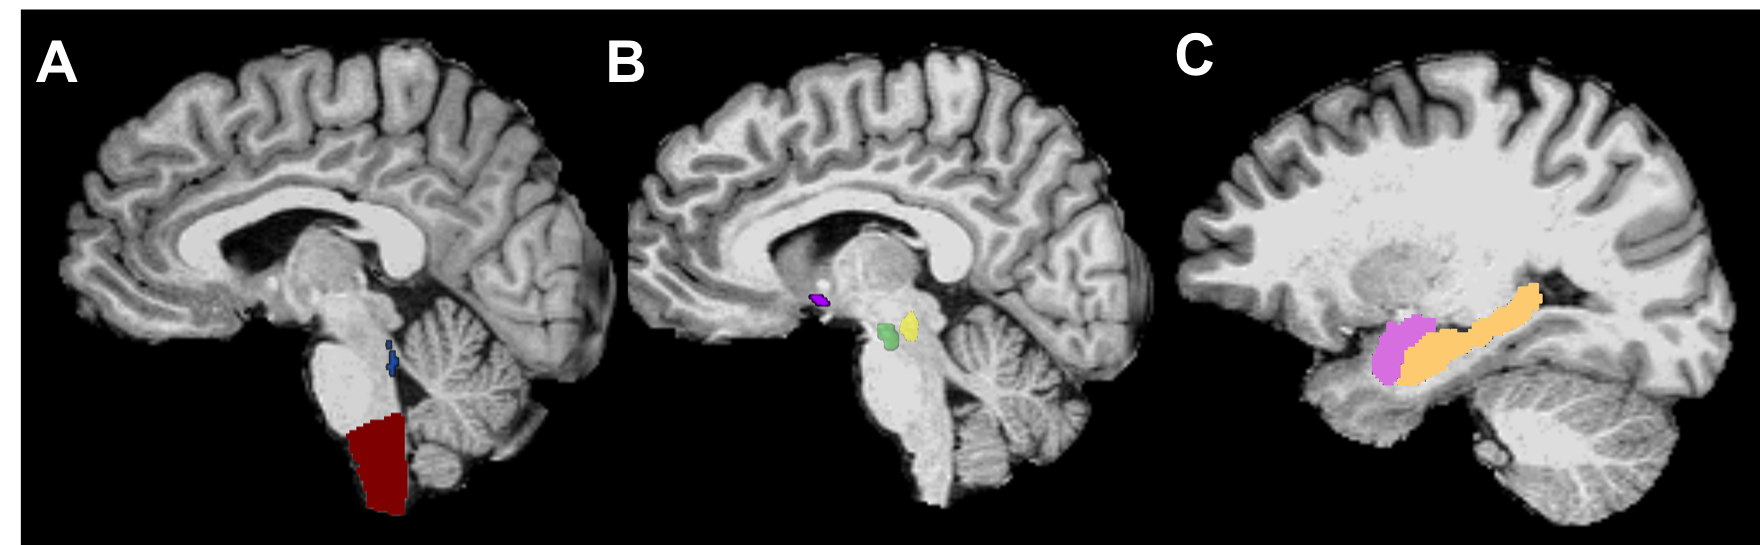
Image analysis: Image processing and analysis were performed using in-house software written in MATLAB. ROI were segmented automatically in cortical and subcortical regions using FreeSurfer (http://freesurfer.net/, MGH, Boston, MA, USA) software. ROIs were drawn manually in the SN using NM images, and in the basalis using T1-w and T2-w images. The locus coeruleus (LC), and PPN were segmented semi-automatically with in-house software6-7. Volume, signal, mean diffusivity (MD), axial diffusivity (AD) and radial diffusivity (RD) were calculated in the ROIs.
Statistical analysis: Partial Least Squares Path-Modeling (PLS-PM) was used to build and test an analytical path model based on Braak staging. PLS-PM is an approach to Structural Equation Modeling (SEM) to estimate a network of causal relationships between blocks of variables. PLS-PM is a two steps iterative algorithm: (1) a measurement model relating the observed variables or Manifest variables (MVs) to their Latent Variables (2) a structural model relating LVs to other LVs. As a result, a set of path coefficients indicating the strength and direction of the links between LVs and factor loadings indicating the contribution of each MV to its associated LV were obtained.
The overall quality of the model was assessed using Goodness of fit coefficient (Gof). We used neuroimaging biomarkers (MVs) and associate group of related variables associated with each ROI (LVs) as follows: (1) an anatomical model was built and MVs and LVs were determined based on prior anatomical knowledge (Figure 1); (2) a hierarchical path between LVs was defined based on Braak staging (Figure 2) (3); PLS-PM was run through iterative approximation until convergence, estimating the path coefficients between LV’s and factor loadings between LVs and their corresponding MV’s; (4) goodness of fit coefficient was estimated.
RESULTS
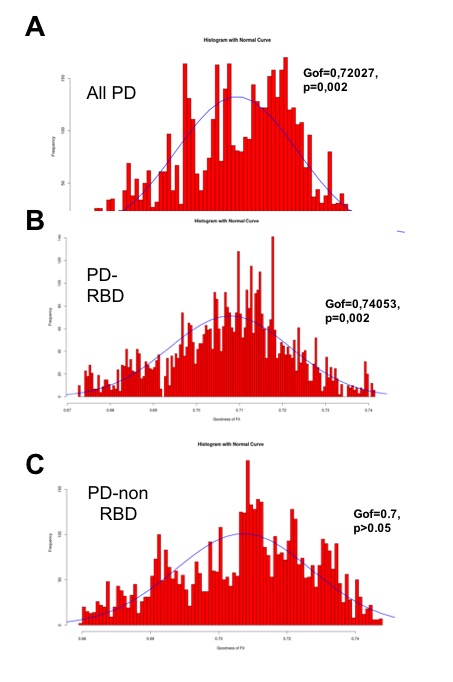
Patients with PD showed increased MD, AD and LD in the medulla oblongata (p=0.007, p=0.01, p=0.03, respectively), PPN (p=0.04), basalis (p<0.001), hippocampus (p=0.01, p=0.003, p=0.01, respectively), amygdala (p=0.001, p=0.003, p<0.001, respectively), prefrontal cortex (p=0.01) and no modifications in temporal cortex (p>0.05). There was a significant decrease in LC-NM signal (p=0.003) and SN-NM volume (p<0.001). PLS-PM was run first on all patients, then PD-RBD vs no RBD. The goodness of fit was significant for all patient groups (Gof=0.72, p=0.002, Figure 3A). The PD-RBD group showed the highest goodness of fit (Gof=0.74, p=0.002, Figure 3B) while Gof in PD without RBD was not significant (0.7, p>0.05, Figure 3C).DISCUSSION
PLS-PM multi-modal imaging-based model was in line with the Braak pathology model confirming the gradual lesions in PD brain. While SN damage was observed in all PD patients, we observed that the Braak model better explained the lesion pattern in PD patients with RBD group (best Gof) than without RBD (non-significant Gof), suggesting that the pattern of extranigral damage described by Braak better applies to PD patients with RBD than without RBD.CONCLUSION
Using multimodal MRI biomarkers, we found that the pattern of neurodegeneration in PD patients fits Braak’s model of disease progression in PD patients with RBD (who probably have greater extent of damage in the brainstem) more than in patients without RBD.Acknowledgements
ANR nucleipark, DHOS-Inserm, France Parkinson, Ecole des Neurosciences de Paris – ENP, the Investissements d'Avenir ANR-10-IAIHU-06 and ANR-11-INBS-0006, and the Fondation Thérèse and René Planiol pour l’étude du Cerveau.References
1. Damier P., Hirsch EC, Agid Y et al. Brain 1999;122:1437–48
2. Jellinger K. 1991;14:153–97
3. Braak H., Del Tredici K, Rüb U et al. Neurobiol Aging 2003;24:197–211
4. Burke RE, Dauer WT, Vonsattel JP. AnnNeurol 2008 : Nov;64(5):485-91
5. Fereshtehnejad, Zeighami Y, Dagher A. Brain 2017 : 140(7):1959-1976
6. Bardinet E, Bhattacharjee M, Dormont D et al., A three-dimensional histological atlas of the human basal ganglia. II. Atlas deformation strategy and evaluation in deep brain stimulation for Parkinson disease. J Neurosurg. 2009; 110(2):208-19
7. García-Lorenzo D, Longo-Dos Santos C, Ewenczyk C, et al. The coeruleus/subcoeruleus complex in rapid eye movement sleep behaviour disorders in Parkinson’s disease. Brain J Neurol. 2013;136:2120–2129
Figures