0956
Unique Structural Backbone Topological Organization in Early Stage Parkinson’s Disease1Imaging Research, Cleveland Clinic Lou Ruvo Center for Brain Health, Las Vegas, NV, United States, 2Cleveland Clinic Lou Ruvo Center for Brain Health, Las Vegas, NV, United States, 3Feinstein Institute for Medical Research, Northwell Research, Manhasset, NY, United States, 4Barrow Neurological Institute, Phoenix, AZ, United States
Synopsis
This study shows the presence of a distinctive anatomical backbone network in early Parkinson’s Disease (PD) involving cortical and subcortical regions that are known to be involved in various stages of PD, including early PD. Impaired network segregation and rich-club measures were further found within this backbone network in PD which were associated with disease duration. We hope that by identifying a set of core abnormalities in PD structural connectivity, this will permit improved ability to understand structural-network related disease progression and also to understand changes in these core structural connectivity measures with disease-modifying therapies as they emerge.
Introduction
Network-based approaches represent attractive methods to investigate changes in the topographical cortico-striatal-subcortical connectivity of early-stage Parkinson’s Disease (PD)1–4. However, diffusion MRI (dMRI) based measures suffer from significant anatomical variability5,6, making these approaches less reproducible. Hence, to investigate structural pathologic commonalities and differences across patients in early PD by minimizing anatomical variability, we constructed an anatomical structural backbone connectome and compared this with the structural backbone of healthy controls (HC). We hypothesized that there will be a disease-specific shift in the structural backbone of early PD, and this shift will be associated with disease duration.Methods
Subjects: dMRI data from 41 (13 female) healthy controls (age: 60.84±10.92 years, years of education (YOE): 15.68±3.19) and 70 (26 female) early PD-subjects (age: 60.85±10.09 years, YOE: 15.31±2.95, total MDS-UPDRS: 18.24±7.31; disease duration: 11.68±13.38 months) were derived from the Parkinson Progression Markers Initiative (PPMI) database for this study. Imaging parameters are described in detail at http://www.ppmi-info.org/7. Only data from 3T Siemens scanners with the first visit were used to ensure uniformity of diffusion data. Network construction: Two different atlases, AAL (mainly cortical)8, and ATAG (subcortical)9 in MNI space, were used to generate 102 nodes (90 AAL-nodes and 12 ATAG-nodes) of the network. MNI152 template was normalized to each subject’s native diffusion space and the resultant transformation matrix was applied to both the atlases to get the nodes in subject’s native space. Whole brain tractography was performed using diffusion toolkit (http://www.trackvis.org/dtk/)10. Only those fiber-tracts that had ends in both nodes were retained. Fibers smaller than 10mm11 and FA<0.2 were removed from any further analysis. Each internode connection (edge) was weighted by the product of the number of fibers and average FA of the fibers connecting the two nodes. Backbone network: Nonparametric sign test, Bonferroni corrected p<0.05, was performed within each group. Edges that had a significantly greater chance to be present in each subject within each group were retained and characterized as a structural backbone-network of the group6. This group-specific backbone was then applied to every participant in each group to extract subject-specific backbone connectivity. Graph-theoretical measures: Various global and local network measures were computed using GRETNA12 and in-house MATLAB scripts to understand the differences in the structural organization of the backbone in the two groups. A rich-club analysis was also performed to understand whether the structural backbone networks have preferentially organized to form distinctive network hubs in both groups. Statistical analysis: Network-based statistic (NBS)13 was used to compare structural network disorganization between groups. PALM14 in FSL was used to perform nonparametric statistical analyses to understand whether global and local network properties and their association with clinical variables were different between the groups. All statistical comparisons were considered significant at family-wise error corrected rate of p<0.05.Results
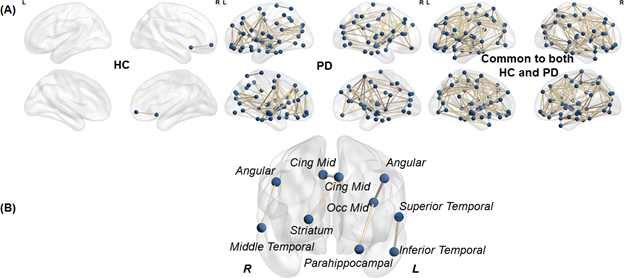
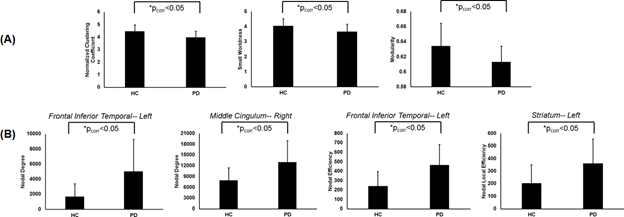
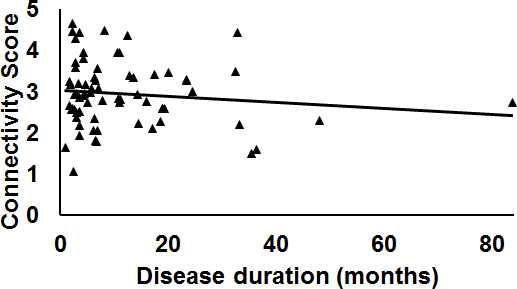
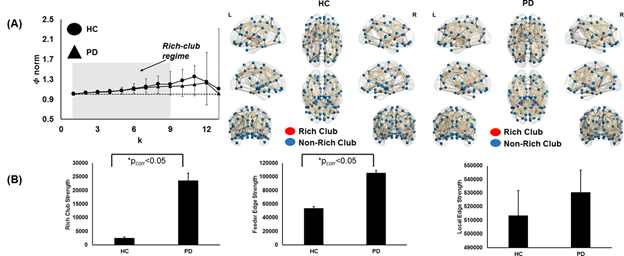
As shown in Fig.1a there was 70.54% of overlap in the structural connectivity backbone of HC and PD. Further, while only 1 connection between insula and middle frontal gyrus in the right hemisphere was exclusively present in the backbone of HC, there were 179 structural connections that were present exclusively in the structural backbone of PD. NBS revealed six paths involving angular gyrus, middle temporal gyrus, middle cingulum, middle occipital gyrus, striatum, parahippocampal, superior temporal gyrus, and inferior temporal gyrus that were statistically stronger in PD as compared to HC (Fig.1b). Impaired network segregation was observed in the structural backbone of PD (lower clustering coefficient and modularity) leading to an impaired small-worldness in PD (Fig.2a). A paradoxical increase in nodal degree and efficiency was observed in the network properties of PD backbone (Fig.2b). The overall structural connectivity generated from the backbone in PD was negatively associated with disease duration (Fig.3). PD participants exhibited a shift in the rich-club organization of the backbone (Fig.4) with higher rich-club and feeder edge strengths in PD.Discussion and Conclusion
Without any a-priori assumptions, our study shows a distinctive backbone network in early PD involving cortical and subcortical regions that are known to be involved in various stages of PD, including early PD. This was consistent regardless of the choice of edge-weights15 used in generating the connectivity matrix. The topological measures derived from this anatomical backbone revealed a loss in network segregation, but a paradoxical increase in graph-theoretical properties in certain PD-implicated brain regions suggesting a possible compensatory mechanism during early stages of the disease. We hope that by identifying a set of core abnormalities in PD structural connectivity, this will permit improved ability to understand structural-network related disease progression and also to understand changes in these core structural connectivity with disease-modifying therapies as they emerge.Acknowledgements
This work was supported by an Institutional Development Award (IDeA) from the National Institute of General Medical Sciences of the National Institutes of Health under grant number 5P20GM109025, and private grant funds from the Elaine P. Wynn and Family Foundation, the Peter and Angela Dal Pezzo funds, and the young scientist award.References
1 Tinaz S, Lauro PM, Ghosh P, Lungu C, Horovitz SG. Changes in functional organization and white matter integrity in the connectome in Parkinson’s disease. NeuroImage Clin 2017; 13: 395–404.
2 Lopes R, Delmaire C, Defebvre L, Moonen AJ, Duits AA, Hofman P et al. Cognitive phenotypes in parkinson’s disease differ in terms of brain-network organization and connectivity. Hum Brain Mapp 2017; 38: 1604–1621.
3 Wen M-C, Heng HSE, Hsu J-L, Xu Z, Liew GM, Au WL et al. Structural connectome alterations in prodromal and de novo Parkinson’s disease patients. Parkinsonism Relat Disord 2017; 45: 21–27. 4 Wen M-C, Xu Z, Lu Z, Chan LL, Tan EK, Tan LCS. Microstructural network alterations of olfactory dysfunction in newly diagnosed Parkinson’s disease. Sci Rep 2017;
7: 12559. 5 Thompson PM, Schwartz C, Lin RT, Khan AA, Toga AW. Three-dimensional statistical analysis of sulcal variability in the human brain. J Neurosci 1996; 16: 4261–4274.
6 Gong G, He Y, Concha L, Lebel C, Gross DW, Evans AC et al. Mapping Anatomical Connectivity Patterns of Human Cerebral Cortex Using In Vivo Diffusion Tensor Imaging Tractography. Cereb. Cortex (New York, NY). 2009; 19: 524–536.
7 The Parkinson Progression Marker Initiative (PPMI). Prog Neurobiol 2011; 95: 629–635.
8 Tzourio-Mazoyer N, Landeau B, Papathanassiou D, Crivello F, Etard O, Delcroix N et al. Automated anatomical labeling of activations in SPM using a macroscopic anatomical parcellation of the MNI MRI single-subject brain. Neuroimage 2002; 15: 273–289.
9 Keuken MC, Bazin P-L, Crown L, Hootsmans J, Laufer A, Muller-Axt C et al. Quantifying inter-individual anatomical variability in the subcortex using 7 T structural MRI. Neuroimage 2014; 94: 40–46.
10 Wang R, Wedeen VJ. TrackVis.org. In: Proc Intl Soc Mag Reson Med. 2007, p 3720.
11 Cheng H, Wang Y, Sheng J, Sporns O, Kronenberger WG, Mathews VP et al. Optimization of seed density in DTI tractography for structural networks. J Neurosci Methods 2012; 203: 264–272.
12 Wang J, Wang X, Xia M, Liao X, Evans A, He Y. GRETNA: a graph theoretical network analysis toolbox for imaging connectomics. Front Hum Neurosci 2015; 9: 386.
13 Zalesky A, Fornito A, Bullmore ET. Network-based statistic: identifying differences in brain networks. Neuroimage 2010; 53: 1197–1207.
14 Winkler AM, Ridgway GR, Webster MA, Smith SM, Nichols TE. Permutation inference for the general linear model. Neuroimage 2014; 92: 381–397.
15 Mishra V, Sreenivasan K, Bird C, Cordes D, RR W. Early Parkinson’s disease is distinguished by a structural network backbone identified through graph theoretical approaches of diffusion MRI. In: International Association of Parkinsonism and Related Disorders. 2018.
Figures