0953
Whole-slice mapping of GABA and GABA+ at 7T via adiabatic MEGA-editing, real-time instability correction, and concentric circle readoutPhilipp Moser1, Lukas Hingerl1, Bernhard Strasser2, Michal Považan3, Gilbert Hangel1, Ovidiu C. Andronesi2, Andre van der Kouwe2, Stephan Gruber1, Siegfried Trattnig1,4, and Wolfgang Bogner1
1High Field MR Centre, Department of Biomedical Imaging and Image-guided Therapy, Medical University of Vienna, Vienna, Austria, 2Athinoula A. Martinos Center for Biomedical Imaging, Department of Radiology, Massachusetts General Hospital, Harvard Medical School, Boston, MA, United States, 3Russell H. Morgan Department of Radiology and Radiological Science, The Johns Hopkins University School of Medicine, Baltimore, MD, United States, 4Christian Doppler Laboratory for Clinical Molecular MRI, Vienna, Austria
Synopsis
In vivo detection of γ-aminobutyric acid (GABA) and glutamate (Glu), both major neurotransmitters in the human brain, benefits from the higher sensitivity at ultra-high field (7T) compared to lower field strengths. However, strong B0/B1+ inhomogeneities and chemical shift displacement errors as well as subject motion and frequency drifts can significantly impair the experiment. An adiabatic MEGA-editing scheme was developed and incorporated into a real-time corrected B1+-insensitive MRSI sequence, which enabled whole-slice metabolic imaging of neurotransmitters in the human brain with unprecedented high-resolution at 7T and allowed a comprehensive assessment of regional GABA levels without co-edited macromolecule contamination.
Introduction
The inhibitory γ-aminobutyric acid (GABA) and the excitatory glutamate (Glu) are the two major neurotransmitters in the human brain. Both are essential for normal physiological and mental functionality [1] and altered levels of GABA have been associated with numerous neurological and neuropsychiatric disorders [2]. MR spectroscopy offers the only non-invasive technique for measuring in vivo GABA and Glu levels. MEGA-editing is the most popular method for detecting GABA and, to date, studies have mainly been conducted in single voxels within the brain, with cortical regions being prominent regions of interest [3]. MRSI reports are still uncommon [4,5], and all of them share the same limitations, namely, large voxel sizes, which hamper the assessment of anatomically resolved GABA levels, and also restricted rectangular target volumes to overcome extracranial lipid artifacts, which is problematic for studies of cortical regions. We propose a MEGA-edited acquisition scheme that exploits the advantages of edited-MRSI at 7T, while tackling challenges that arise with ultra-high-field. Adiabatic slice selection and MM-suppressed MEGA-editing, combined with fast non-Cartesian readout and real-time motion and B0 corrections ensure stability against both volunteer-related and typical ultra-high-field artifacts.Methods
Phantom and in vivo measurements (n=5) were performed on a Siemens Magnetom 7T whole-body MR scanner using a 32-channel receive coil. Spatial localization was achieved by a B1+- and CSDE-insensitive 1D-semiLASER sequence [6] employing a 900us slice-selective SINC excitation pulse and one pair of adiabatic GOIA pulses (W16,4 modulation, 8ms duration, 10kHz bandwidth) refocusing a 16mm slice (Fig.1a). Hamming density-weighted, concentric ring trajectories [7] were used for data sampling thereby optimizing the SNR per unit time and mitigating extracranial lipid artifacts by improving the point-spread-function. The FOV of 220x220mm² was subdivided into 32x32 voxels. MRSI data were obtained with 2778Hz spectral bandwidth, 2 averages, 2-step phase cycling, TE/TR 69/2800ms, and TA 24:12min. To account for strong B0 and B1+ inhomogeneities at 7T across the slice, we introduce an adiabatic MEGA-editing scheme where conventional frequency-selective Gaussian editing pulses are replaced by broadband asymmetric hyperbolic secant pulses (combination of one-half of a 32-ms-long HS-1 pulse and the other half of an 8-ms-long HS-4, see Fig.1b). The narrow transition band and flattop were 162Hz and 534Hz, respectively. MM-suppressed GABA-editing was achieved by a global inversion-preparation that nulled co-edited MM signals at 2.99ppm using a 100‐ms‐long, 40th‐order WURST pulse. Real-time motion and scanner instability correction was performed via 3D echo planar imaging navigators (vNav) combined with selective reacquisition of corrupted data (i.e., >0.4mm translation or >0.4° rotation) [6]. Differences in metabolite concentrations between GM and WM were assessed via correlation analysis between metabolic ratio maps and GM/WM tissue composition.Results
Fig.2a illustrates the simulated and measured inversion profiles for the adiabatic HS pulse and a conventional (FWHM=120Hz) Gaussian pulse. Simulations of the 4CH2-GABA 3.01ppm resonance in Fig.2b showed high editing stability using the asymmetric HS editing pulse, with less than 1.8% integrated GABA signal amplitude variation, even in the presence of a ±30% B1+ offset. Fitted spectra (DIFF and EDIT-OFF) from different brain regions are shown in Fig.3, including voxels with typically good spectral quality and voxels where fitting is challenging due to baseline distortions and B0 inhomogeneities (frontal lobe). Applying IR reduced the mean SNR calculated over all volunteers and all voxels by about 50% from 241.1±99.0 to 119.6±47.1 (p<0.005). The mean GABA CRLBs increased from 4.2±2.8 to 8.0±2.3 when applying IR (p<0.005), while for Glx the CRLBs increased from 3.2±2.2 to 3.6±2.6 (p=0.015). Fig.4 depicts metabolic ratio maps (i.e., GABA/tNAA, GABA+/tNAA, GlxDIFF/tNAA, and tCr/tNAA) of one volunteer, as well as the pure GABA maps (with IR-ON) obtained for all five volunteers. The linear regression result of GABA/tNAA and Glx/tNAA versus the GM fraction is provided in Fig.5a. GM/WM ratios calculated from linear regression over all volunteers for all metabolic maps are listed in Fig.5b. GABA/tNAA showed a 2.15-fold increase in GM/WM contrast when applying IR, while Glx/tNAA experienced a slight contrast reduction of about 17%.Discussion/Conclusion
An adiabatic MEGA-editing scheme was developed and incorporated into a B1+-insensitive MRSI sequence to account for the severe B0 and B1+ variations frequently encountered in whole-slice MRSI at ultra-high field. Integrating time-efficient, concentric ring encoding, and real-time motion and scanner instability correction makes our approach promising for whole-slice metabolic imaging of neurotransmitters (but also antioxidants, and onco-metabolites) in the human brain. Metabolic maps showed distinct anatomical contrast and were used to calculate metabolite abundance differences in GM and WM. Without IR, GABA+/tNAA showed only little GM/WM contrast, but this contrast increased 2.15-fold when IR (i.e., GABA/tNAA) was enabled. We attribute this to an elevated abundance of MM2.99ppm in WM compared to GM, which is in accordance with previous reports [8].Acknowledgements
This study received support from the Austrian Science Fund (FWF): KLI 718, KLI 646, P 30701 and J 4124; the FFG Bridge Early Stage Grant #846505.References
[1] Agarwal et al., 2012, Am. J. Neuroradiol. 33, 595–602; [2] Cawley et al., 2015, Brain 138, 2584–95; [3] Brennan et al., 2017, Psychiatry Res. Neuroimaging 269, 9–16; [4] Bogner et al., 2014. Neuroimage 103, 290–302; [5] Jensen et al., 2005, NMR Biomed. 18, 570–576; [6] Moser et al., ISMRM 2018, No. 1287; [7] Hingerl et al., 2018, Magn Reson Med. 79(6):2874-2885; [8] Považan et al., ISMRM 2017, No. 1058Figures
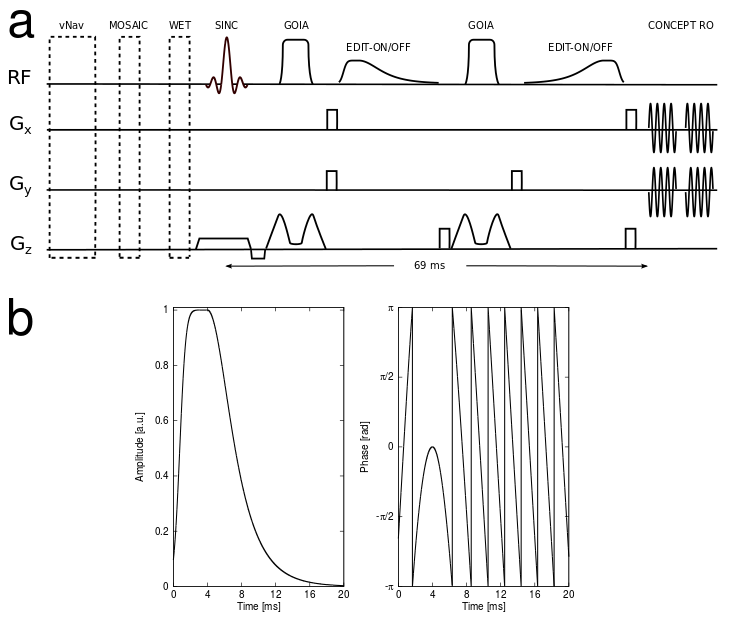
Figure 1: (a) 1D-semiLASER sequence (SINC excitation pulse and a pair of GOIA-refocusing pulses) including an adiabatic MEGA-editing scheme. Prior to MRSI excitation, volumetric navigators for real-time motion correction, MOSAIC prescans for coil combination, WURST inversion recovery for MM suppression and WET water suppression modules are played out. MEGA-editing elements include asymmetric adiabatic editing pulses and surrounding spoiler gradients (shaded in gray). Concentric-ring encoding readout starts after a TE of 69ms; (b) the asymmetric adiabatic full-passage pulse for spectral MEGA-editing was designed from a combination of one-half of a 32-ms-long hyperbolic secant (HS) pulse of order 1 and the other half of an 8-ms-long HS-4.
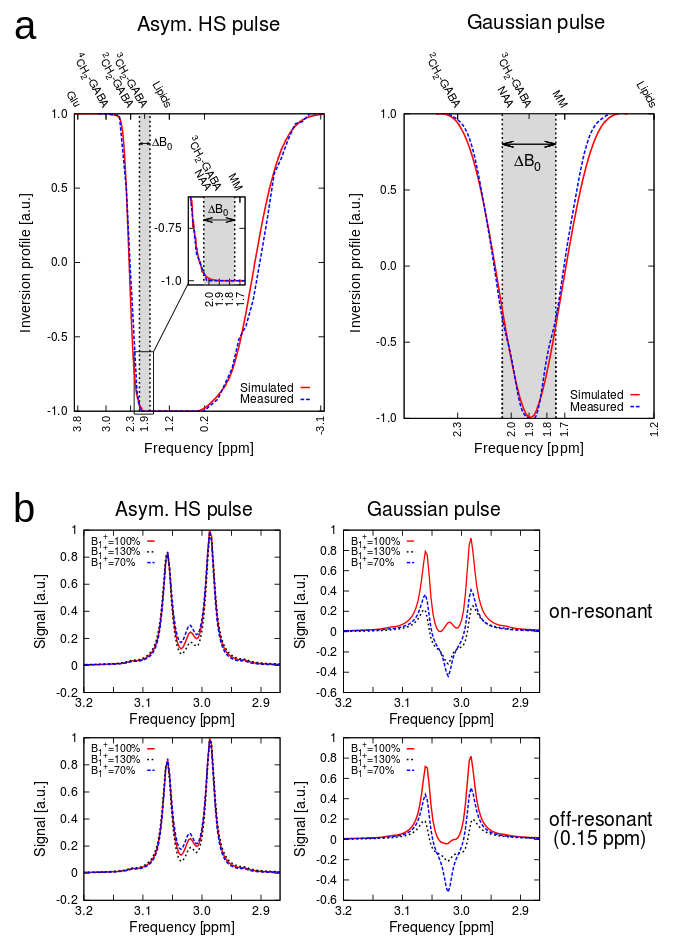
Figure 2: (a) Measured and simulated inversion profiles for the asymmetric adiabatic HS editing pulse compared to a conventional Gaussian pulse. A frequency band of ΔB0=±0.15 ppm is indicated to visualize the frequency offset sensitivity of the Gaussian pulse, while the adiabatic pulse yields robust, full inversion over ΔB0; (b) Simulations of the 4CH2-GABA signal at 3.01 ppm. The resonance shapes showed high editing stability in case of the adiabatic editing pulse in the presence of B1+ variations of ±30% and 0.15 ppm editing frequency offsets (<1.8% integrated signal loss).
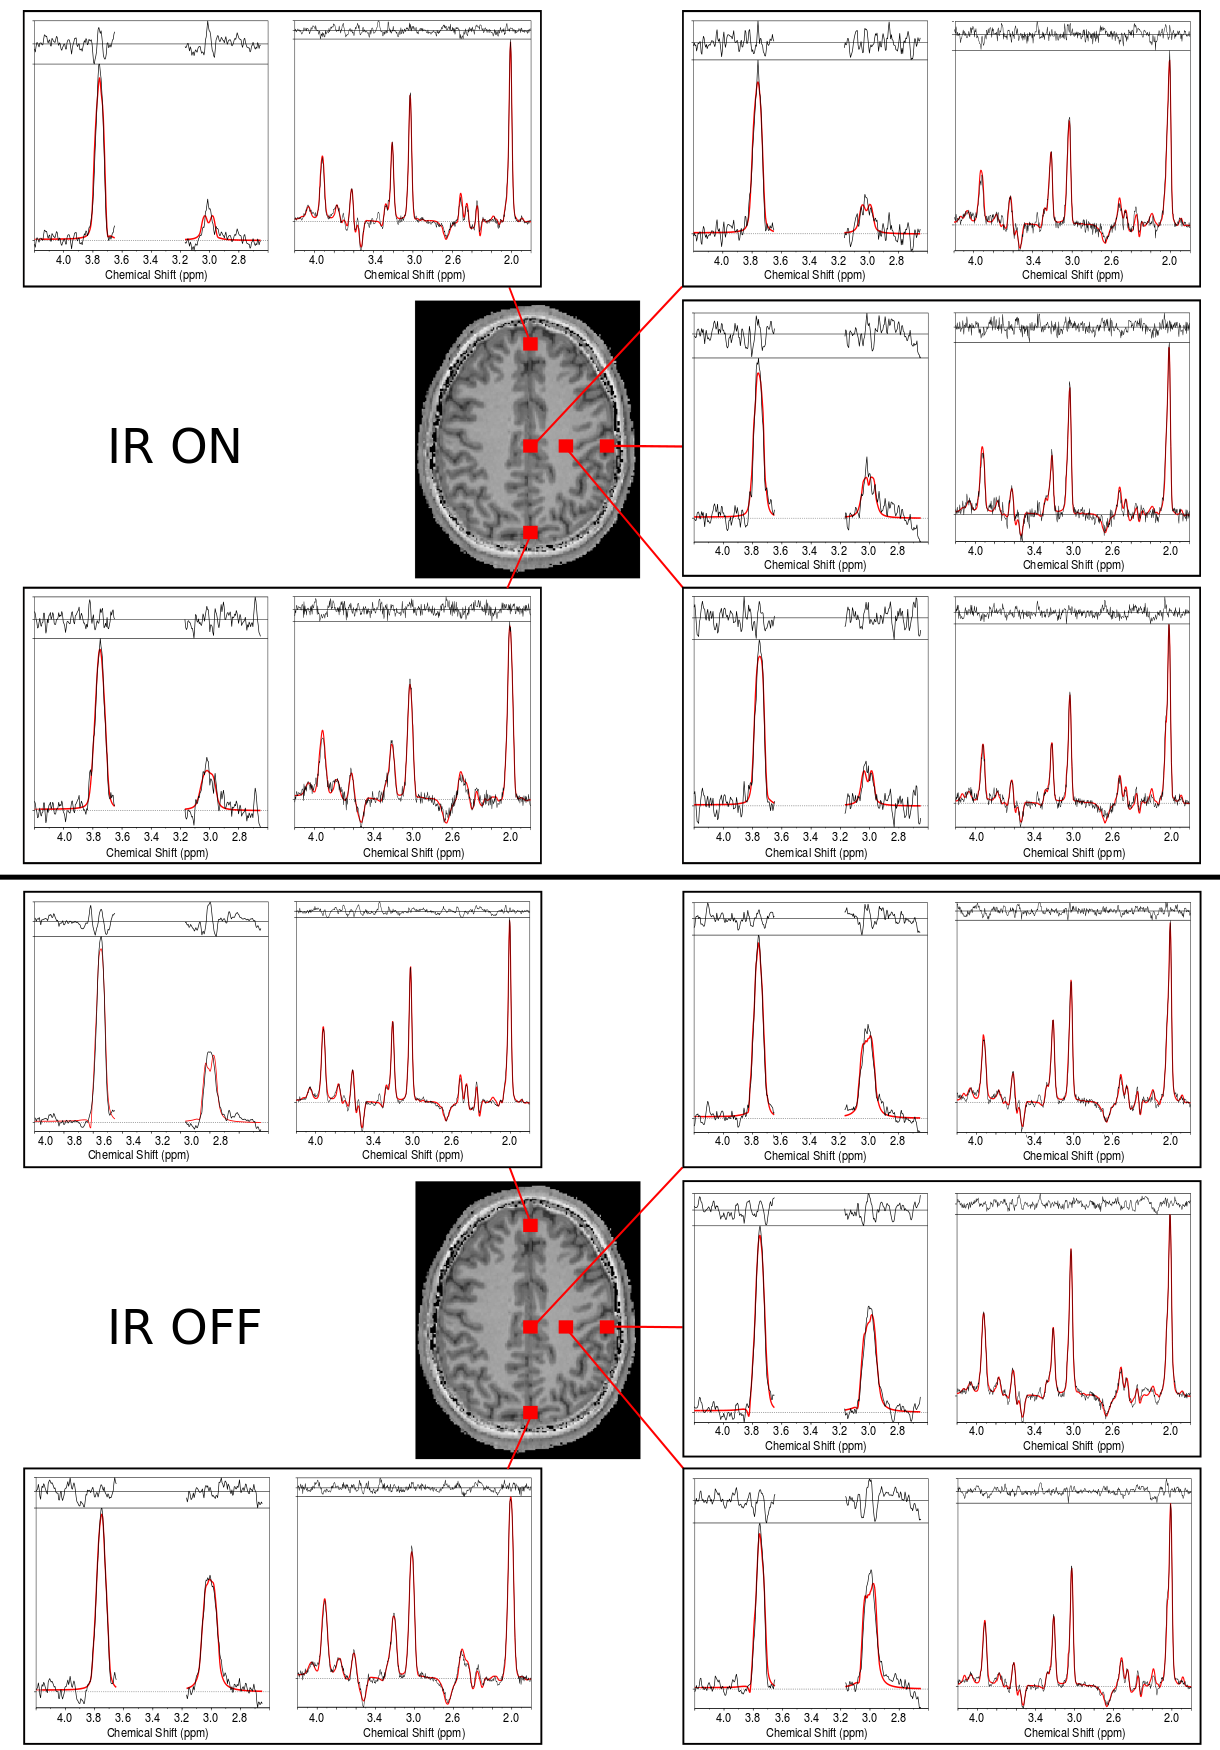
Figure 3: Sample spectra including the LCModel fits (in red) for volunteer 1. Spectra from different brain regions that included voxels with typically good spectral quality (mesial gray matter and left frontoparietal white matter) and lower spectral quality (frontal and occipital lobes) are shown. For each voxel, DIFF and EDIT-OFF spectra are grouped together. For comparison, spectra with inversion recovery ON and OFF are provided. A decrease in overall SNR, as well as a significantly reduced GABA peak, is observed in the IR-ON case. The effective voxel size was 1.4 cm3.
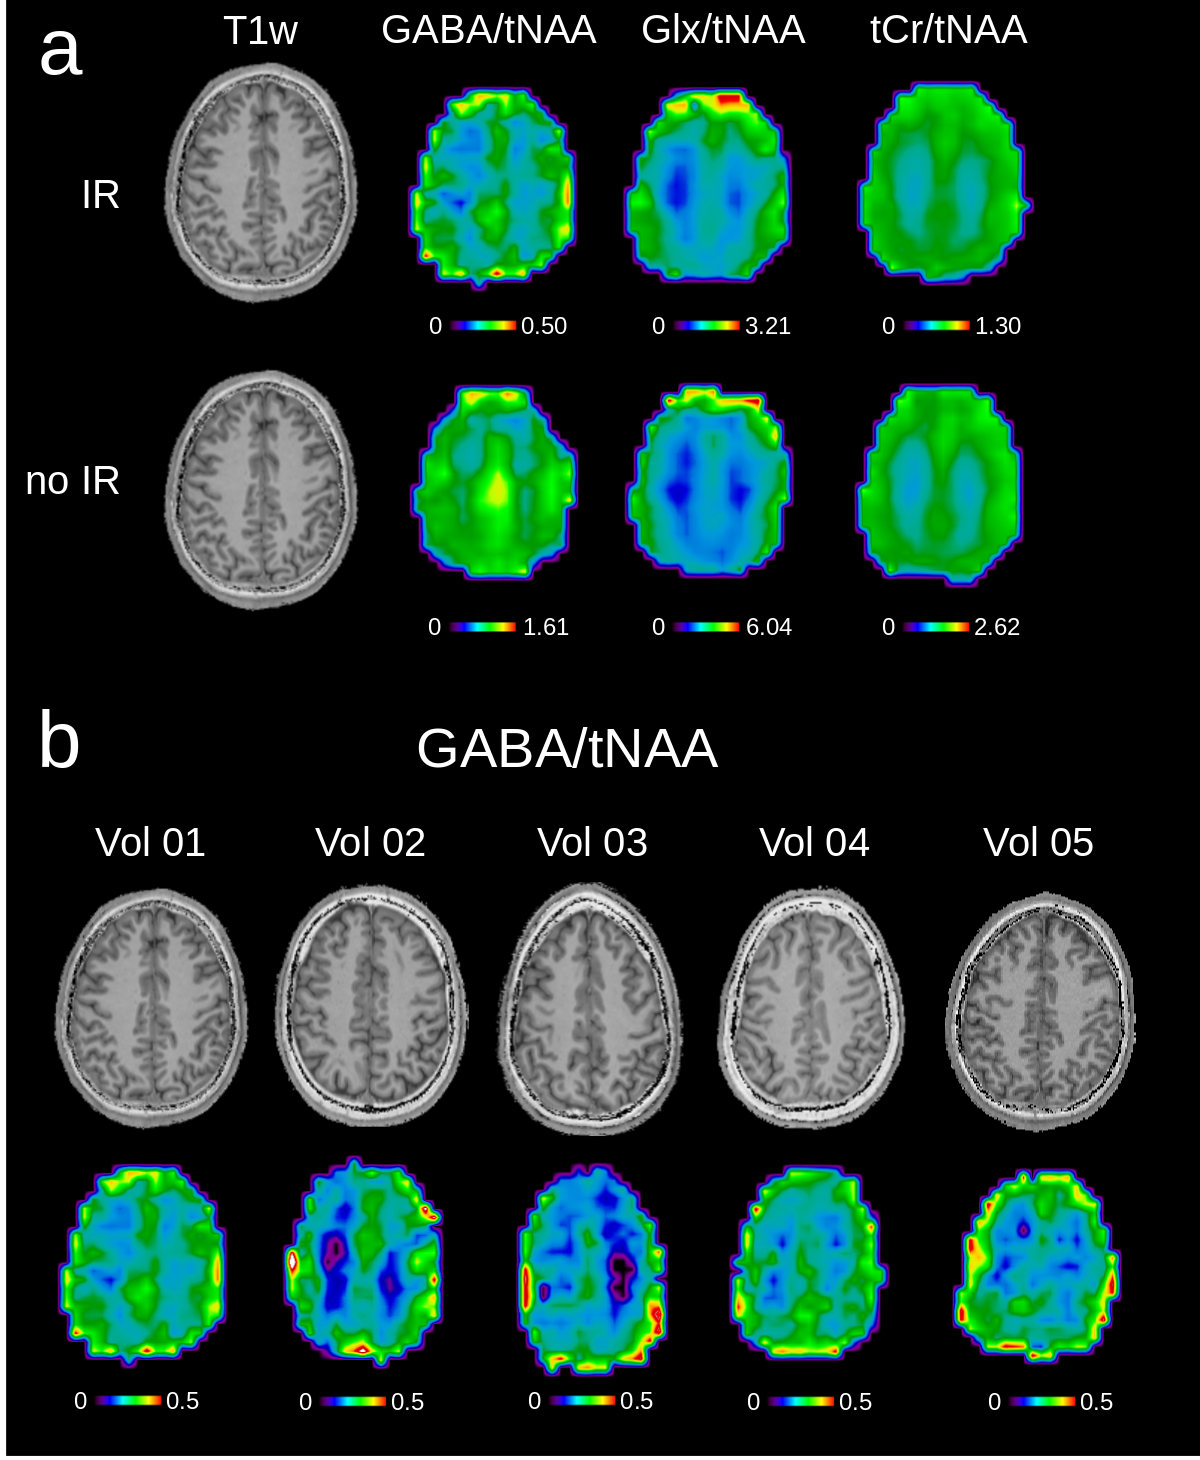
Figure 4: (a) Metabolic ratio maps for inversion recovery ON and OFF for volunteer 1. T1-weighted images are shown, as well as GABA/tNAA and Glx/tNAA maps from DIFF spectra. tCr/tNAA maps are also provided and were obtained from EDIT-OFF spectra; (b) pure GABA/tNAA metabolic maps without MM contamination, as well as the corresponding T1-weighted images are shown for all five volunteers. Metabolic maps were acquired using the following MRSI settings: FOV 220×220 mm2; 32x32 matrix; slice thickness 16 mm; TA 24:12 min. The maps were interpolated to a 64x64 matrix for display.
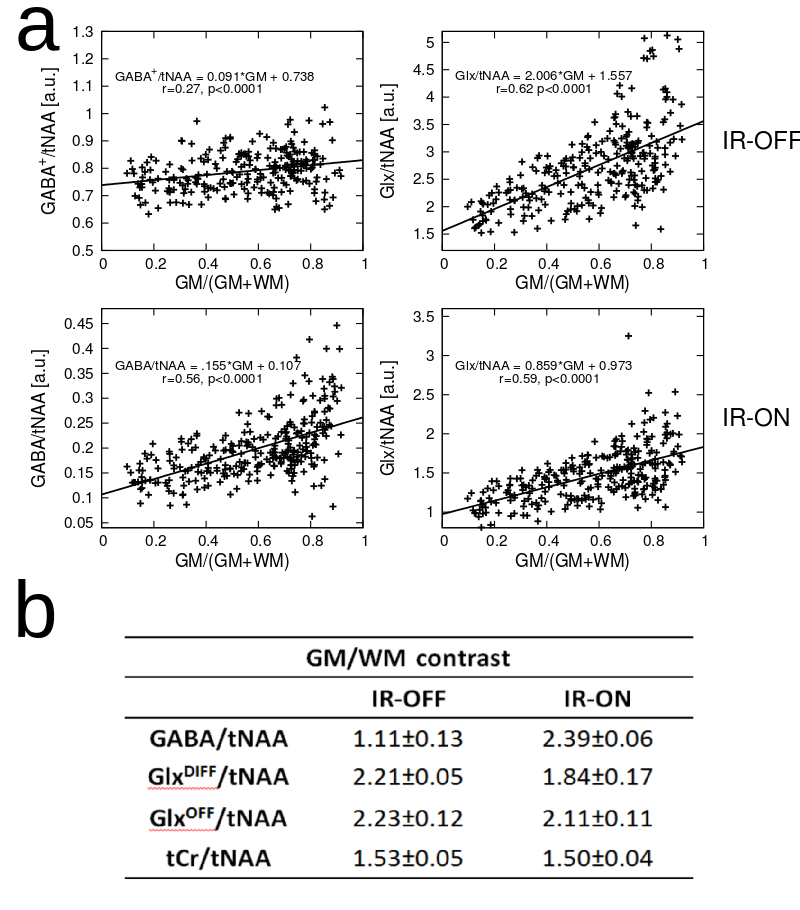
Figure 5: Linear regression plot of GABA/tNAA and Glx/tNAA versus GM tissue composition. GABA/tNAA shows a signal decrease by a factor of ~4 in the case of IR-ON compared to IR-OFF (IR reduces the GABA signal by a factor of ~2 and eliminates MM contributions), while a factor of only ~1.7 in signal decrease is observed in the case of Glx/tNAA; (b) Ratios for GM/WM contrast for different metabolic ratio maps averaged over all five volunteers. GABA/tNAA and GlxDIFF/tNAA were obtained from DIFF-spectra, while GlxOFF/tNAA and tCr/tNAA were obtained from EDIT-OFF spectra. tNAA obtained from EDIT-OFF IR-ON spectra was used as normalization in all cases.