0952
Ultra-high-resolution brain MRSI at 7T and 9.4T – A direct comparison1MRCE, Medical University of Vienna, Vienna, Austria, 2Athinoula A. Martinos Center for Biomedical Imaging, Department of Radiology, Massachusetts General Hospital, Harvard Medical School, Boston, MA, United States, 3Russell H. Morgan Department of Radiology and Radiological Science, The Johns Hopkins University School of Medicine, Baltimore, MD, United States, 4F. M. Kirby Research Center for Functional Brain Imaging, Kennedy Krieger Institute, Baltimore, MD, United States, 5Department of Cognitive Neuroscience, Maastricht University, Maastricht, Netherlands, 6Scannexus BV, Maastricht, Netherlands, 7MRShim GmbH, Reutlingen, Germany, 8Christian Doppler Laboratory for Clinical Molecular MR Imaging, Vienna, Austria
Synopsis
Despite the successful demonstration of fast ultra-high resolution MRSI at 7T and 9.4T, a direct comparison has been lacking. This study fills this gap by measuring the same FID-MRSI protocol in the same volunteer group at both field strengths within a short time frame. Our results show overall similar quality measures across field strengths, with more quantifiable metabolites but also more prevalent spectral artefacts at 9.4T.
Purpose
Utilising the increased signal-to-noise ratio (SNR) and spectral separation of ultra-high-field-MR systems, high- and ultra-high-resolution (UHR) magnetic resonance spectroscopic imaging (MRSI) was successfully demonstrated, refined and applied in the recent years for 7T [1,2] and 9.4T [3,4]. So far, however, there has been no direct comparison of MRSI performance between both field strengths. We conducted the first study of this kind at a facility with both 7T and 9.4T MR systems in close proximity, to compare the same MRSI method in the same five volunteers at both fields. This allowed us to look at the expected differences (SNR, spectral quantification, B0-/B1+-effects, lipid/water artefacts) for two different resolutions and accelerations.Methods
Five volunteers (4m, 1f) were measured with Siemens Magnetom 7T and 9.4T scanners, equipped with the vendor provided 32-channel (Nova Medical) and custom built 8Tx/31Rx coil [5], respectively. Written informed consent and approval of the institutional review board were obtained.
As part of the protocol, structural MRI (7T: MP2RAGE, 9.4T: MPRAGE), B0- and B1+-mapping sequences were acquired. The MRSI-sequence used an ultra-short-acquisition delay of 1.3 ms and a TR of 300 ms, WET water suppression, a FOV of 220×220 mm² and 1024 readout points. For best comparability, flip angles were set to 32°/29° (average metabolite Ernst angles) and a readout bandwidth of 3000 Hz at 7T 4000 Hz at 9.4T was used to acquire the same spectral range in ppm. Two MRSI scans were conducted, one with a 64×64 resolution in 15 min without acceleration and another with 100×100 and a 2×CAIPIRNIHA acceleration [2] in 19 min. Both used elliptical encoding and integrated GRE prescans for MUSICAL [6] coil combination. All MRSI sequences were acquired transversally above the ventricles.
Postprocessing included a Hamming filter and L2-regularisation [7] to remove lipid artefacts. LCModel quantification included in addition to the metabolites (NAA, NAAG, Cr, PCr, GPC, PCh, mIns, sIns, GABA, GSH, Glu, Gln, Gly, Tau, Lac) a macromolecule basis [3,8] and used a range from 0.4-1.15 ppm and 1.75-4.2 ppm. A water sideband artefact in the 9.4T data required the exclusion of the 3.4-3.7 ppm range for these datasets.
The results were evaluated based on the resulting spectra and metabolite maps as well as average tNAA SNR in the spectral domain (corrected for the different readout lengths), tNAA FWHM and metabolite CRLBs.
Results
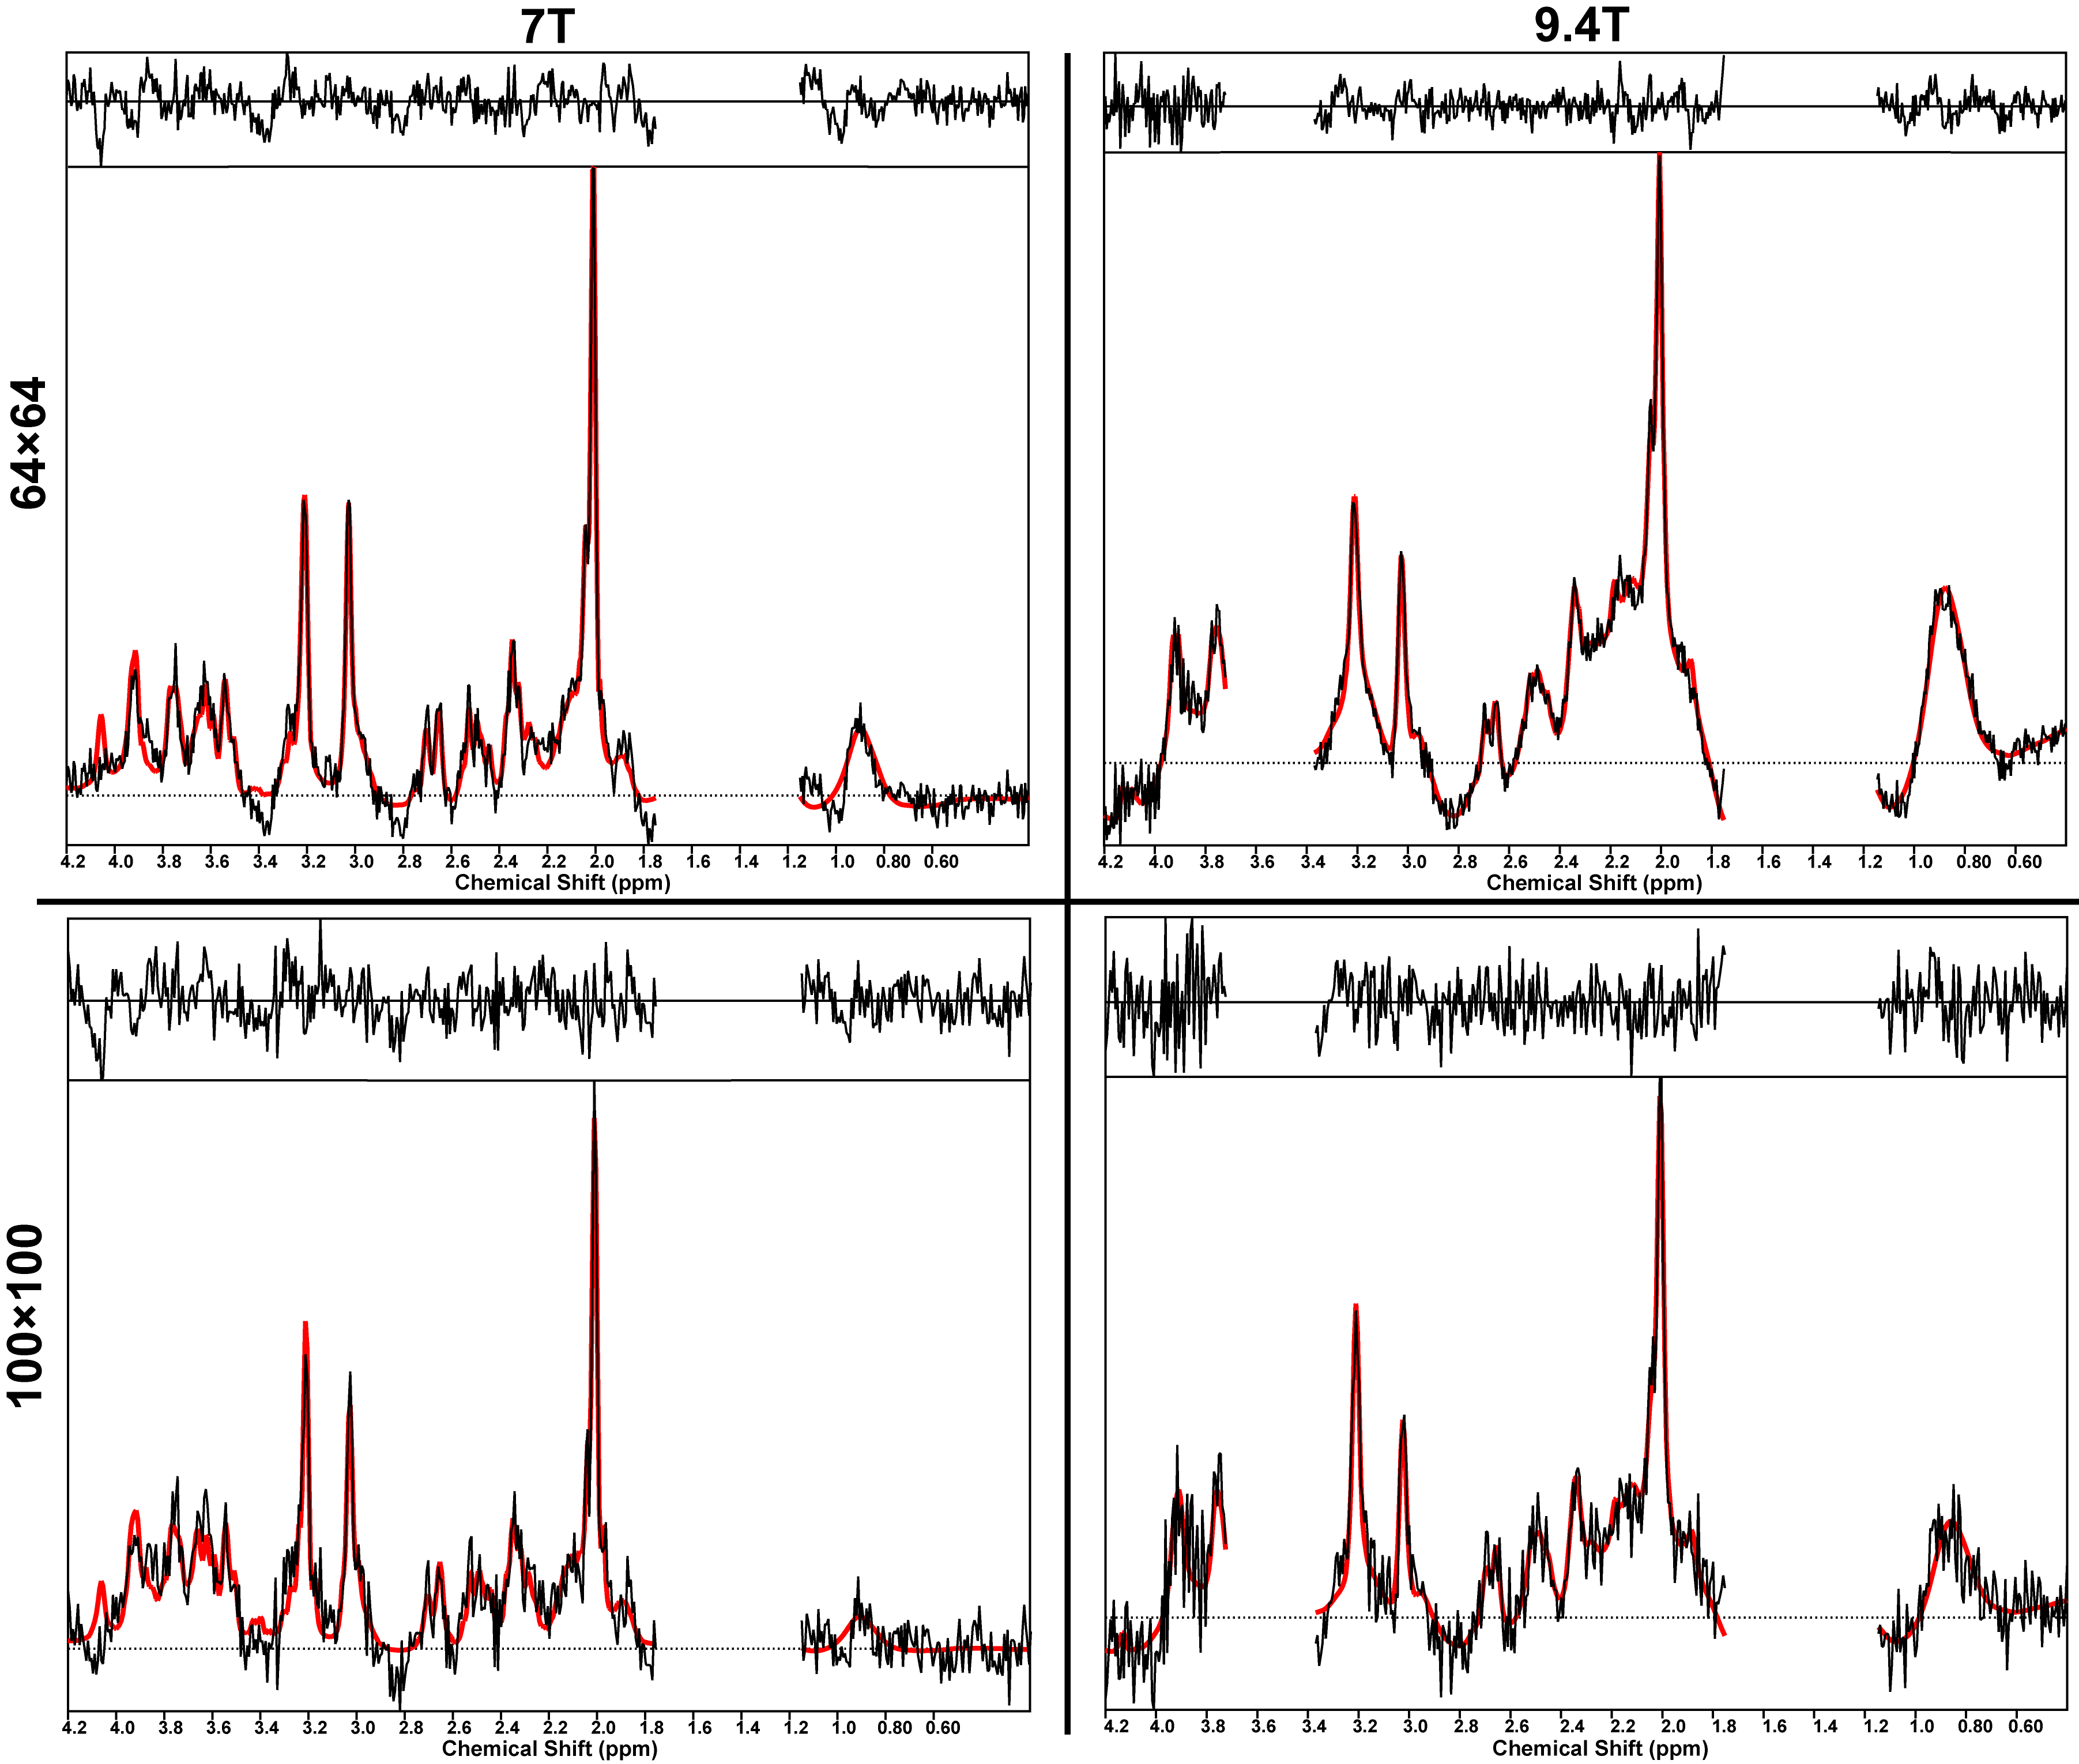
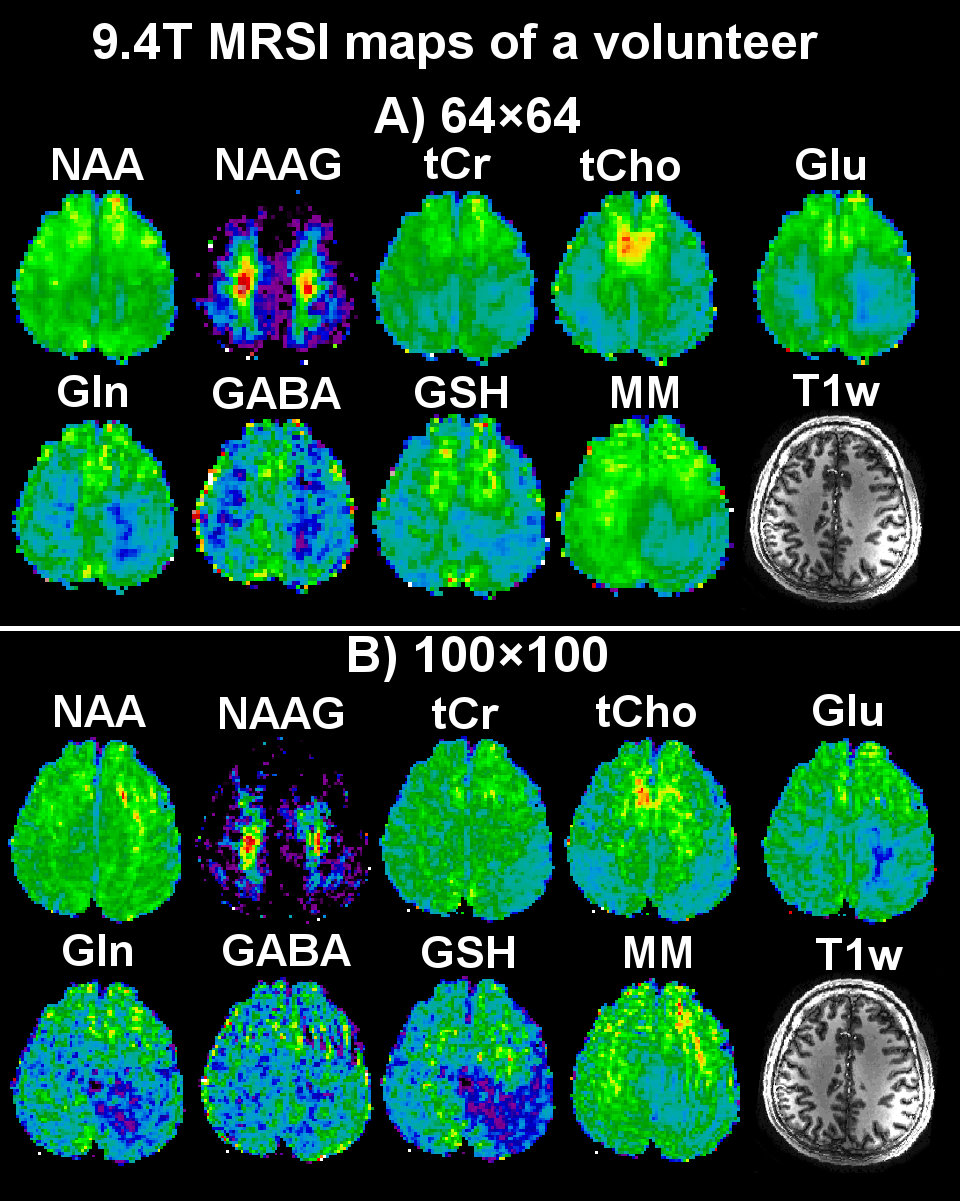
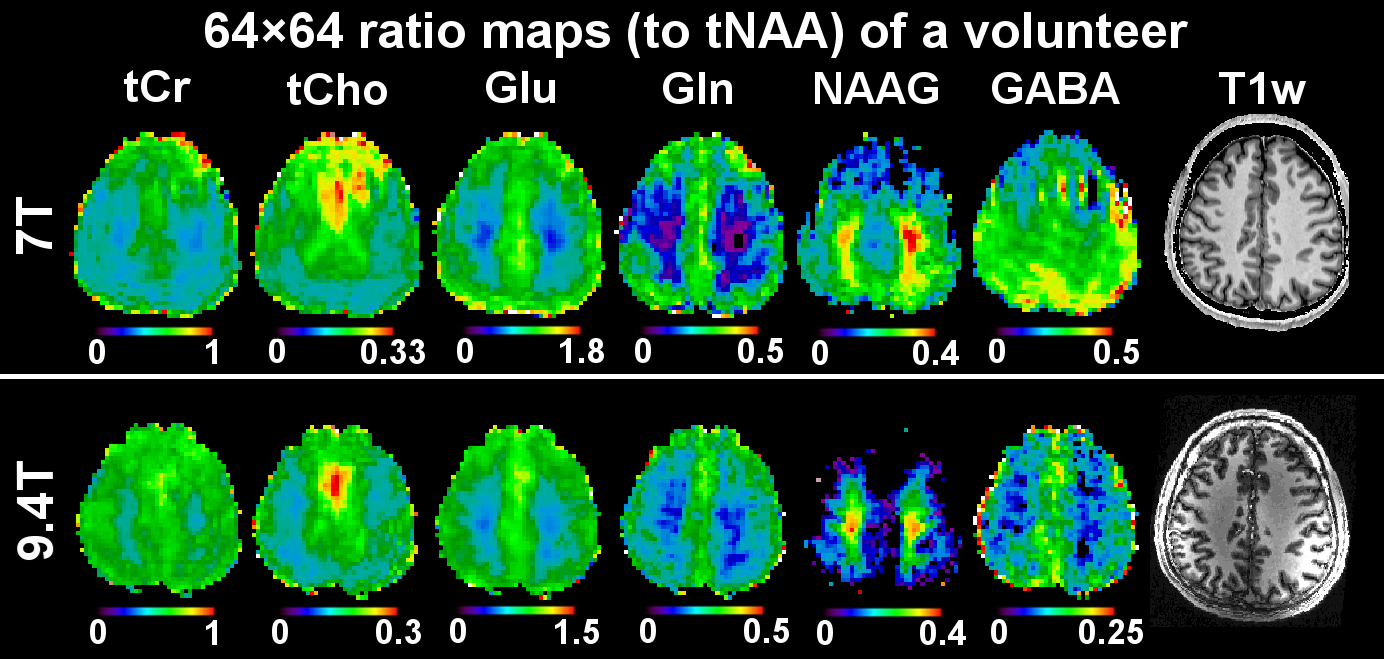
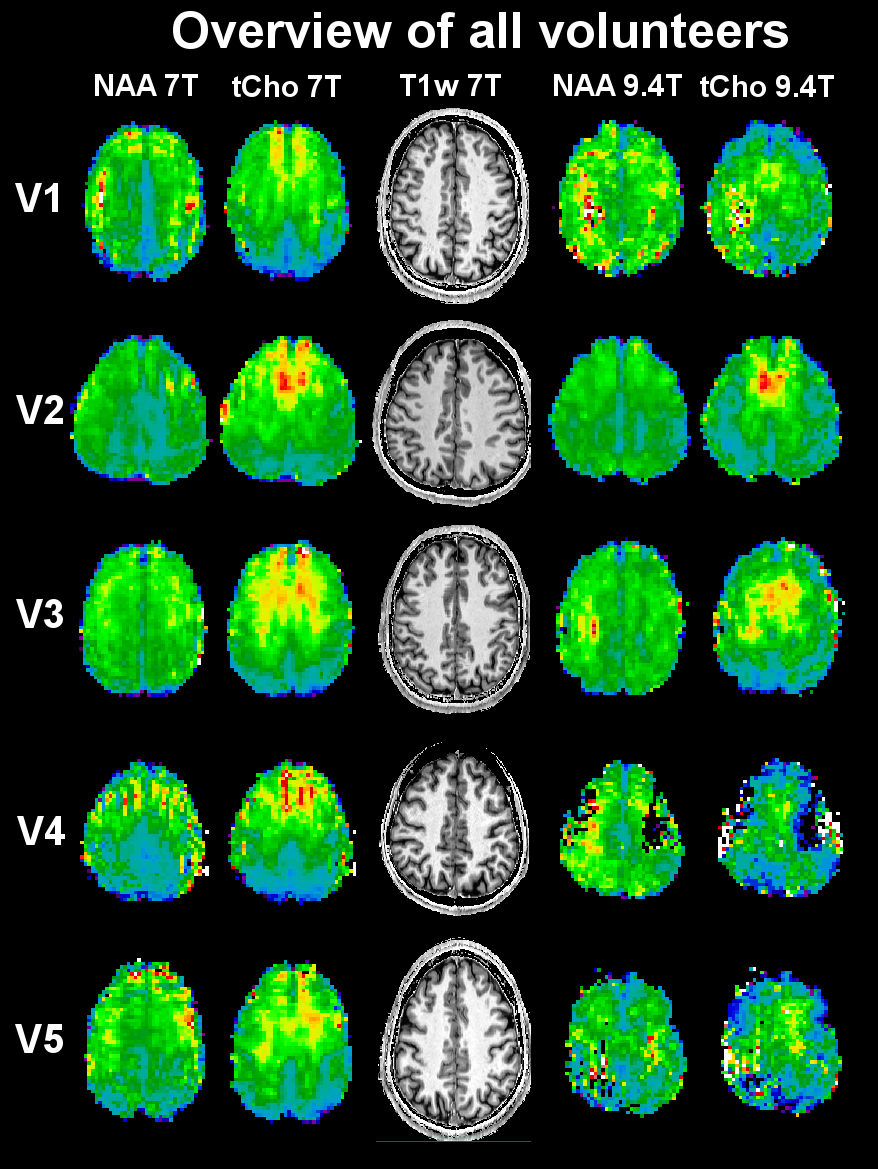
Assessment of the spectra (e.g. Fig. 1) showed sufficient MRSI data quality for quantification for all five volunteers. Fig.2 shows an example of excellent 9.4T map quality and of the successful quantification of challenging metabolites like NAAG, GABA and GSH. Ratio maps (Fig.3) show generally similar results for both field strengths, with differences such as NAAG likely rooted in different T1s and larger NAA/NAAG separation at 9.4T. An overview over all five volunteers (Fig.4) shows successful measurements for all of them, but also artefacts/unfittable regions in some of the maps, both 7T and 9.4T.
While 9.4T had 2% more SNR than 7T for 64×64 and 10% less for 100×100, FWHMs and CRLBs turned out similar, e.g. for 7T-64/9.4T-64/7T-100/9.4T-100, SNR of 54.8±23.2/55.9±27.4/28.2±10.6/25.3±12.5, FWHMs of 0.048±0.019/0.045±0.017/0.048±0.017/0.044±0.019 ppm, NAA CRLBs of 5.2±4.2/5.1±2.9/7.7±5.1/7.6±3.5 %, tCr CRLBs of 6.9±3.5/5.9±2.710.1±3.7/9.6±3.0 %, tCho CRLBs of 6.1±4.2/9.7±5.4/8.8±3.7/14.3±5.5 %, NAAG CRLBs of 25.7±17.1/28.6±19.8/35.6±19.5/43.2±21.9 %, and GABA CRLBs of 16.8±12.9/32.4±17.8/23.3±13.9/41.8±18.4 % (Fig.5).
Discussion
To our knowledge, this study is the first to directly compare the same MRSI protocol between 7T and 9.4T. We found an overall similar behaviour, with a better quantification of lower-signal metabolites such as GABA and NAAG at 9.4T. Especially UHR-GABA-mapping would be a promising application but needs more verification that the fitted GABA signal is not contaminated by MMs (that seem to be affected to some extend by the L2-regularisation at 9.4T) and other compounds contributions. While the short acquisition delay minimises T2-based differences, different T1s can be expected to enhance differences in the results.
Compared to the 7T scans, the processing of the 9.4T data posed a greater challenge. Increased B0- and B1+-inhomogeneities compared to 7T can be expected as a cause for linewidth broadening, worse water suppression as well as enhanced lipid and water sideband artefacts. So far, we have not addressed them satisfactorily, with further measurements requiring improved methods especially regarding B0-/B1+-shimming to increase measurement and quantification stability [3,9]. So far, while the 9.4T system was used in pTX-mode, the MRSI sequence was not adapted to benefit from any pTX-capabilities.
In summary, we found the FID-MRSI approach to perform similarly well at both fields, with more metabolites that were acceptably well quantifiable, but also more challenges that need to be considered at 9.4T.
Acknowledgements
This study was supported by the Scannexus IDEA Meeting challenge 2016, the Austrian Science Fund (FWF): KLI-646 and P 30701 as well as the FFG Bridge Early Stage Grant #846505.References
[1] Hangel et al.; NeuroImage
2018, doi: 10.1016/j.neuroimage.2016.10.043
[2] Strasser et al.; MRM 2017; doi: 10.1002/mrm.26386
[3] Nassirpour et al.; NeuroImage 2018, doi: 10.1016/j.neuroimage.2016.12.065
[4] Nassirpour
et al.; NeuroImage 2018, doi: 10.1016/j.neuroimage.2018.08.03
[5] Shajan et. al.; MRM 2014, doi: 10.1002/mrm.24726
[6] Strasser et al.; NMR in Biomed 2013; 26(12): 1796-805
[7] Bilgic et al.; JMRI
2014; 40(1):181-191
[8] Považan et al.; MRM 2018; doi: 10.1002/mrm.26778
[9] Chang el
al.; MRM 2018; doi: 10.1002/mrm.26658
Figures