0951
Preliminary detailed in-vivo brain atlas of metabolic and macromolecular distributions in humans using 7T 1H Magnetic Resonance Spectroscopic Imaging1University Medical Center Utrecht, Utrecht, Netherlands, 2Max Planck Institute for Biological Cybernetics, Tübingen, Germany, 3IMPRS for Cognitive and Systems Neuroscience, Eberhard Karls University of Tübingen, Tübingen, Germany, 4Amsterdam University Medical Center, Amsterdam, Netherlands
Synopsis
This study amalgamated current state-of-the-art MRSI developments to create a detailed and reliable in vivo metabolic atlas of the healthy human brain. We used an ultra-high field 7T MR scanner to acquire high resolution, short echo-time (TE) MRSI data along with an external crusher coil for hardware based extra-cranial lipid signal suppression. Advanced post-processing and data reconstruction techniques were used in conjunction with stringent data filtering based on several quality assurance metrics, while registration to the MNI152 standard atlas allowed us to generate high-resolution metabolite/macromolecule ratio maps.
Introduction
Magnetic resonance spectroscopic imaging (MRSI) can increase our understanding of the neurobiological mechanisms underlying brain diseases related to etiology, disease progression, and treatment efficacy. However, there are currently important limitations to the use of in-vivo MRSI in the human brain related to metabolite fitting in low SNR data, variations due to partial volume effects, lipid artefacts, and clinically relevant aspects such as scan-time constraints. To demonstrate the potential of MRSI as a powerful clinical metabolic tool, we recently developed a novel 7T-MRSI approach incorporating a crusher coil to suppress high intensity extra-cranial lipid signals, advanced reconstruction and post-processing techniques to enable the accurate quantification of metabolite distributions at high spatial resolution in the brain using a relatively short scan-time of 11 minutes. Our focus on quality control and normalization of our data to the MNI standard atlas allowed us to delineate high-resolution, metabolite maps of several clinically relevant metabolites in 23 healthy individuals.Methods
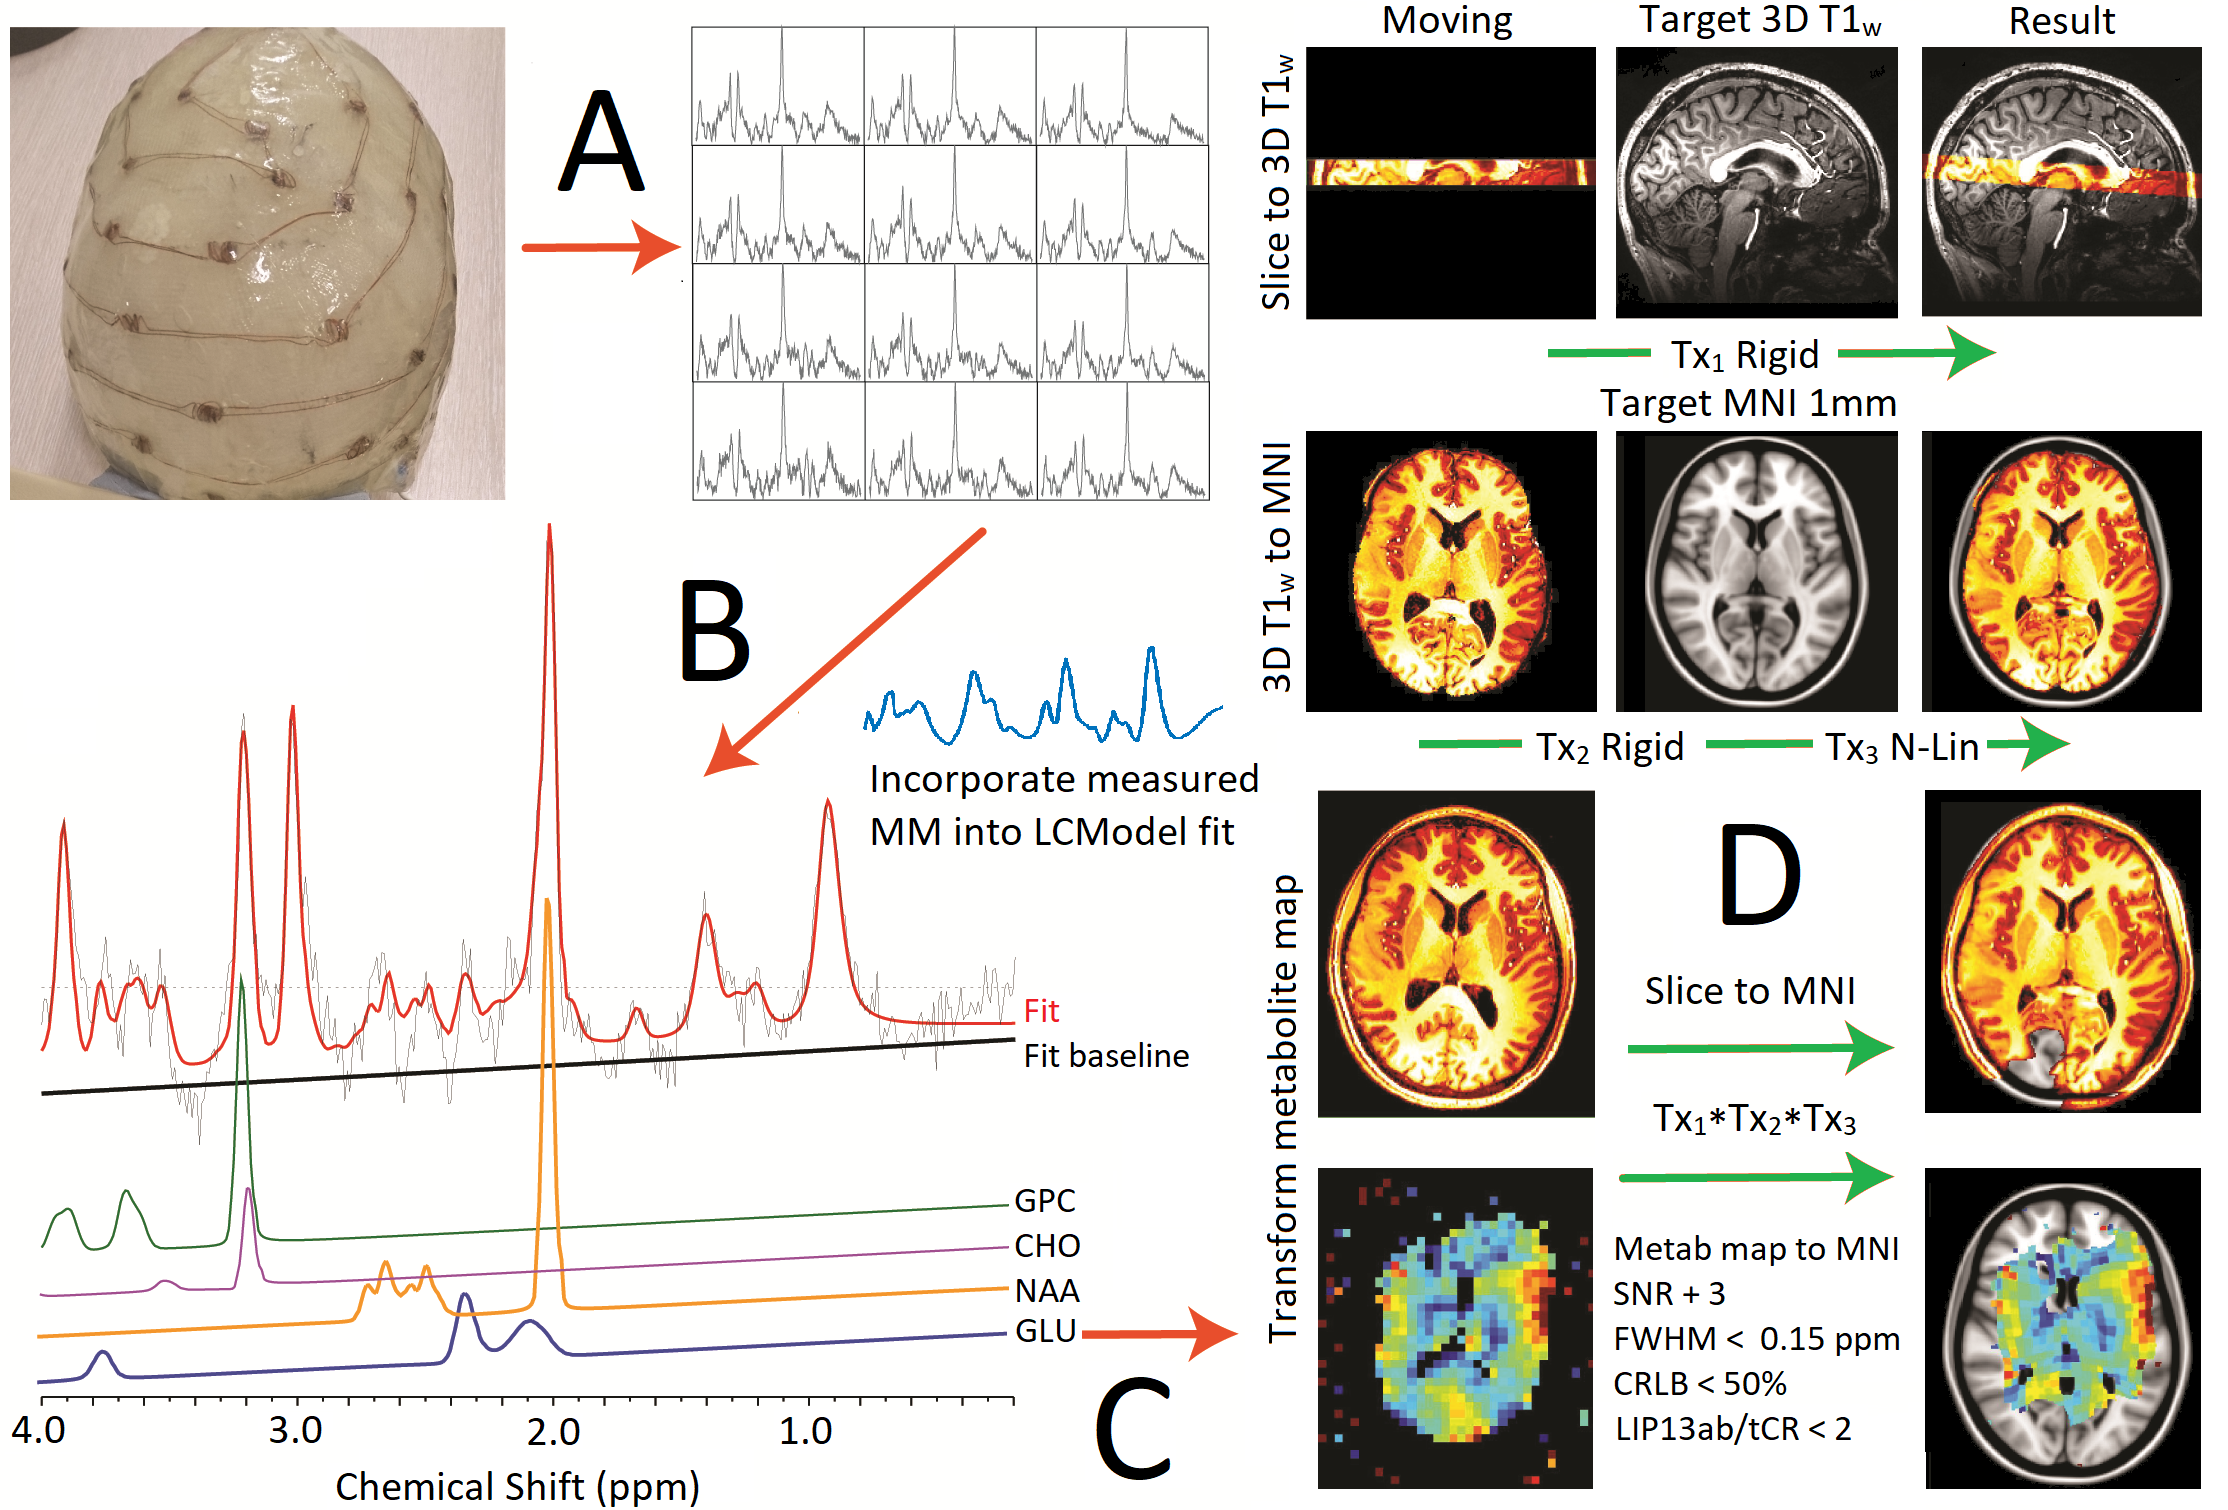
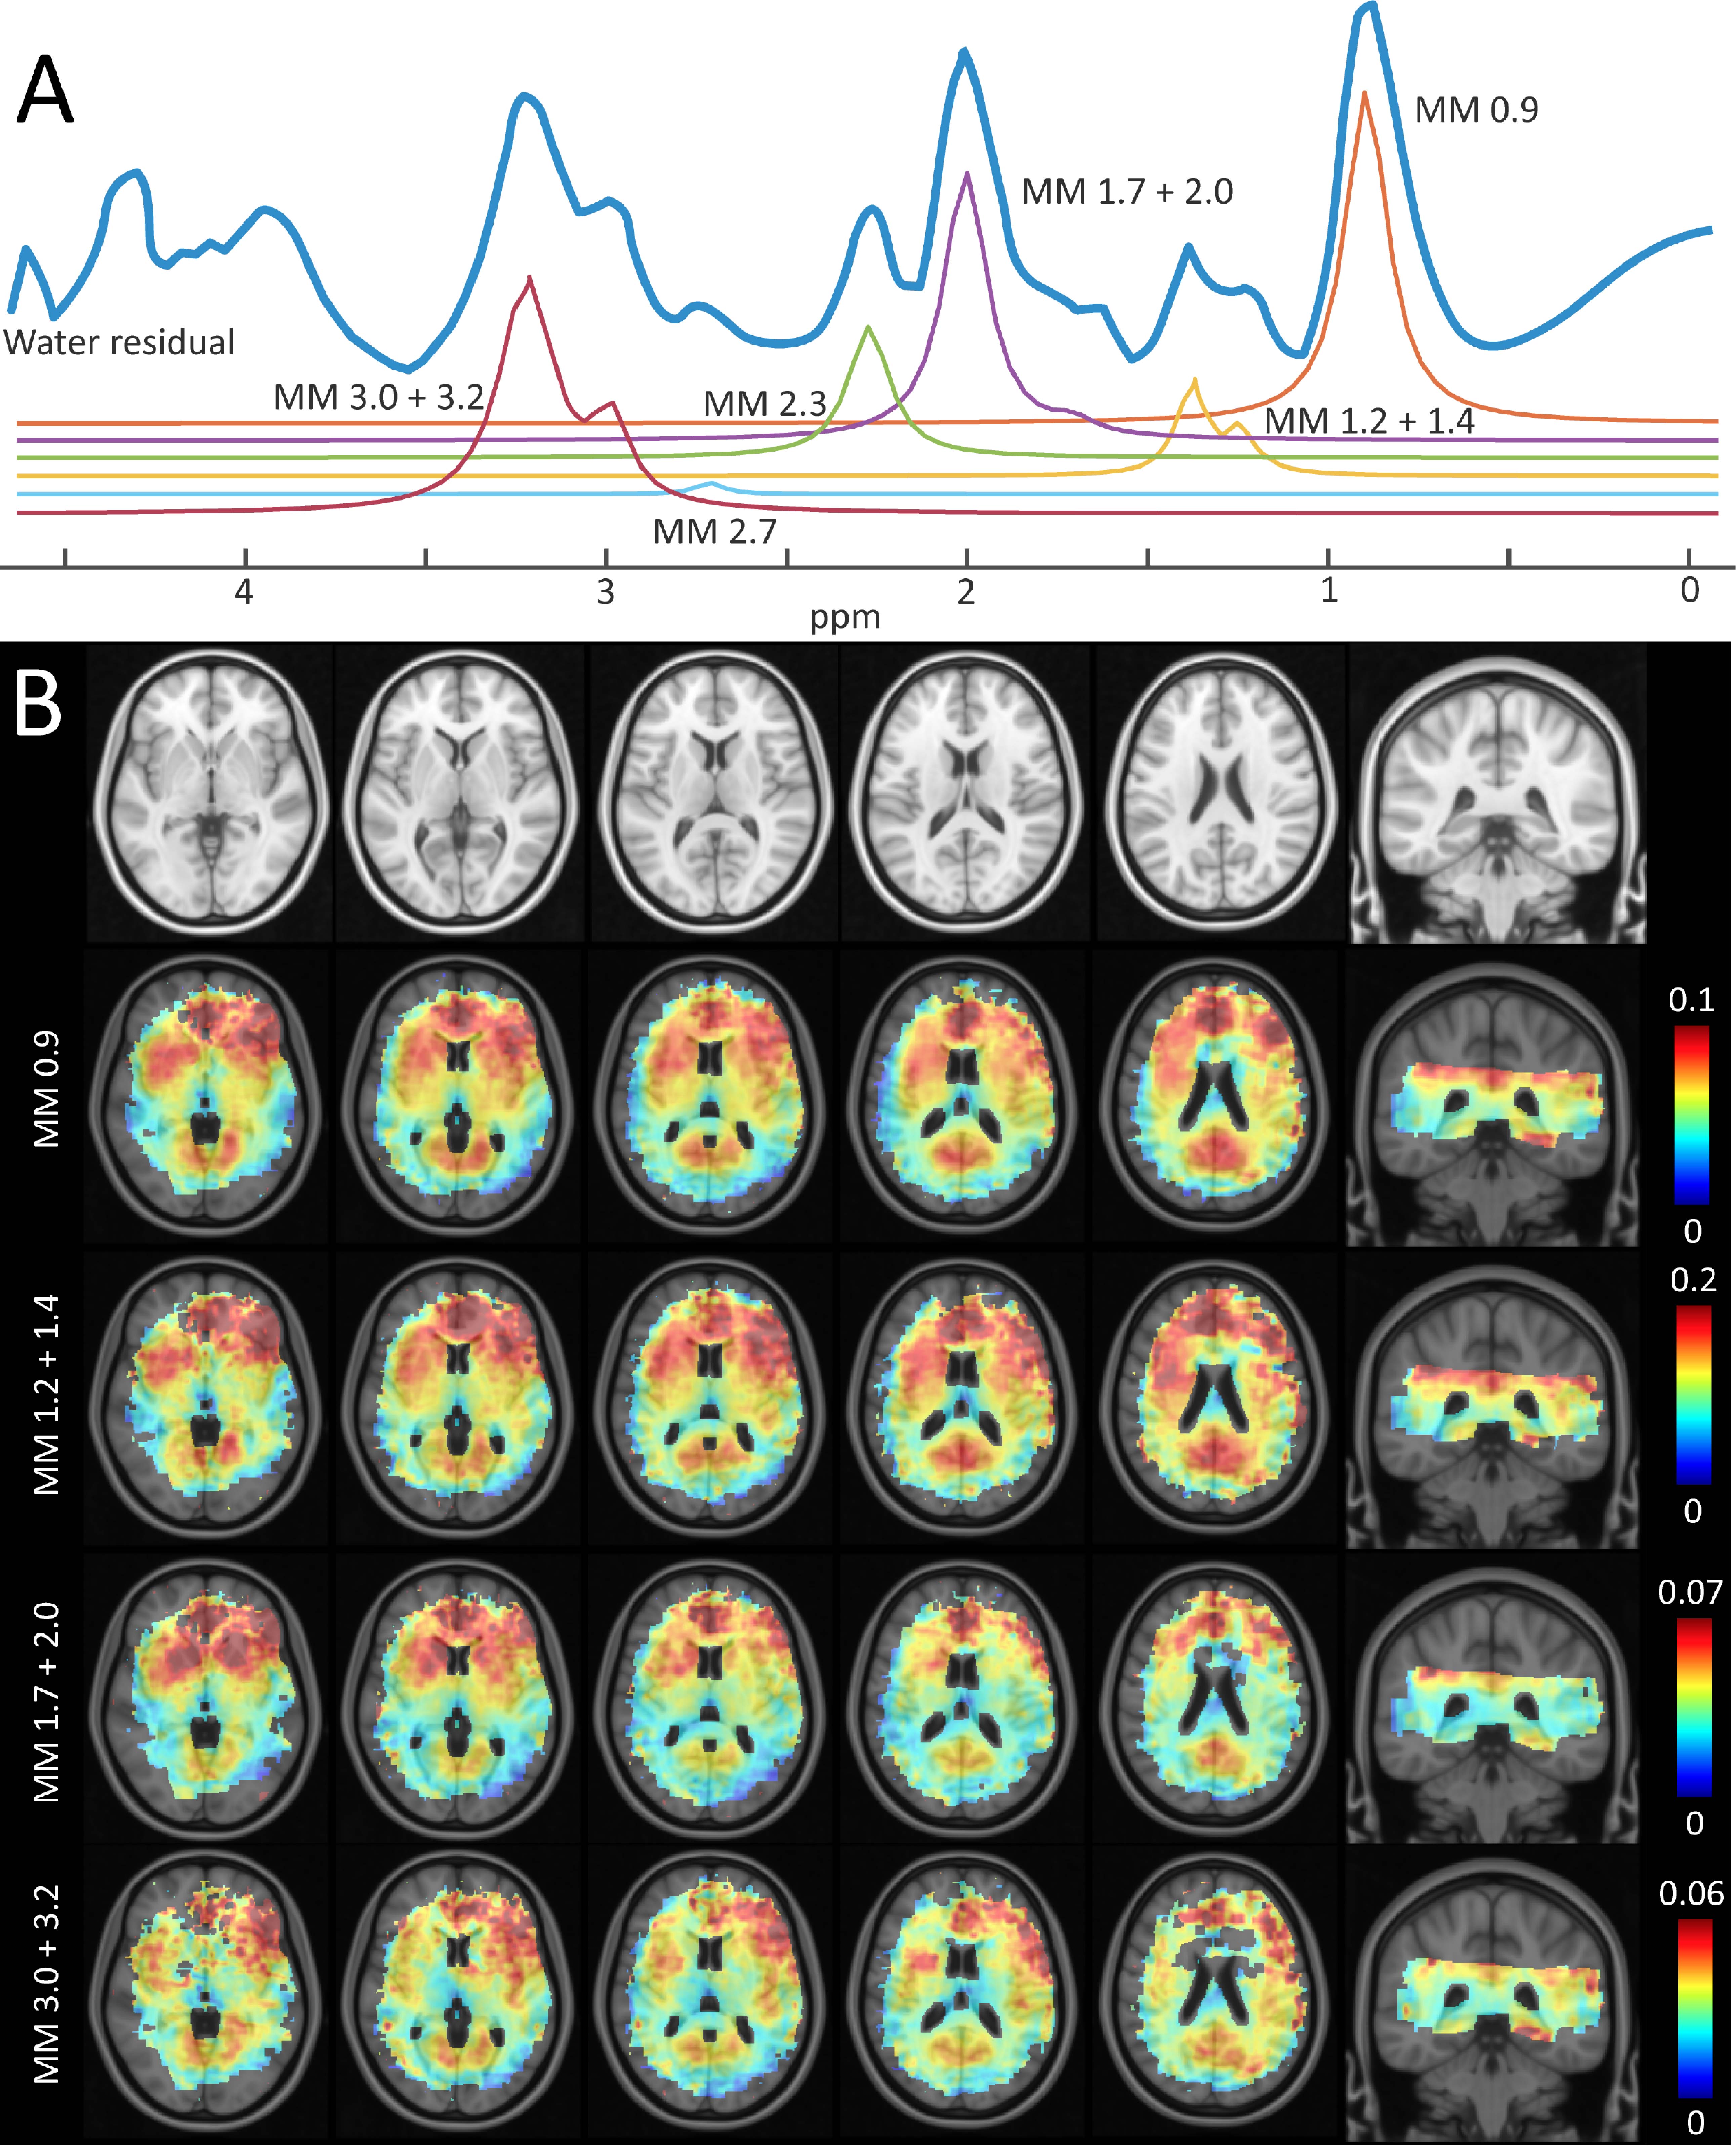
Experiments were performed according to the guidelines and regulations of the WMO (Wet Medisch Wetenschappelijk Onderzoek). Informed consent was received and 23 young healthy volunteers were scanned (age 23 ± 5, 9 females) on a 7T MRI scanner (Phillips, Best, NL) using a dual-transmit head coil and 32ch receive coil (Nova Medical, Wilmington Ma, USA). Suppression of extra-cranial lipid signals was achieved using an external crusher coil1. MRSI data was collected (2nd order shimming, tailored water suppression2 using a Short TE, steady-state free precession (SSFP) sequence: TE/TR=2.5/300ms, FOV=220x220mm, acquisition matrix=44x44, resolution=5x5x10mm3, BW=3000Hz, samples=512, averages=2, duration = 10m59s, alpha=35o, slices=2. A measured macromolecular (MM) baseline was acquired using a double inversion sequence3: TE/TR=2.5/1000ms, FOV=220x220mm2,resolution=30x30x10mm3, BW=6000Hz, samples=512, averages=30, duration=11m28s, VAPOR, TI1/2=870/296ms. Spectra were processed using a custom script and high resolution anatomical and B0 images. An over-discretized SENSE reconstruction and B0 correction4,5 was used to reduce voxel bleeding and improve the SNR and line-shape. Eddy current and zero-order phase correction was performed using a water reference image (acquired at half resolution6). Post-processing steps included prediction of initial missing points of the FIDs using a backward linear prediction auto-regressive algorithm, and residual water peak removal using HLSVD method6. MRSI data was registered to MNI space as shown in fig1. Spectra were fit using LCModel version 6.3-1 K. Lipid resonances (0.9ppm, 1.3ppm, 2.0ppm) were simulated by LCModel; measured MM signal components described in fig3 were incorporated into basis set. Quality assurance thresholds defined in fig1 (bottom-right) were applied for voxel selection.
Results
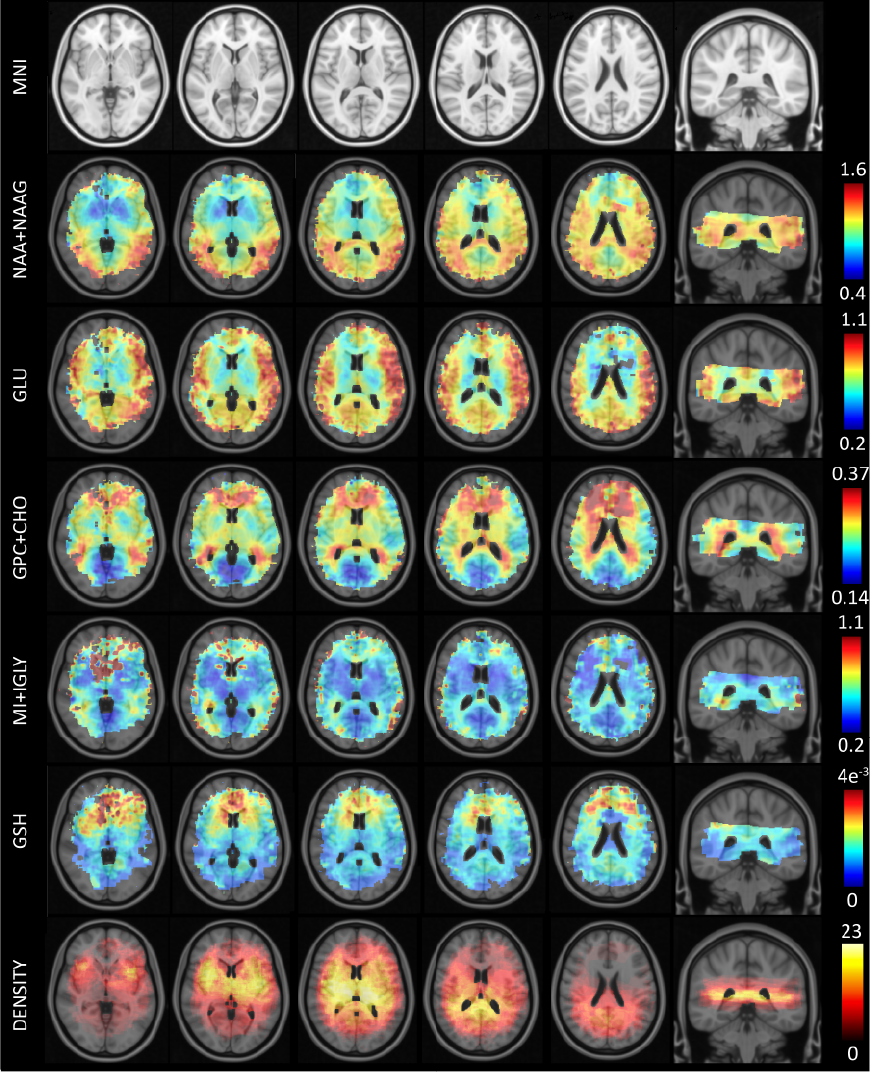
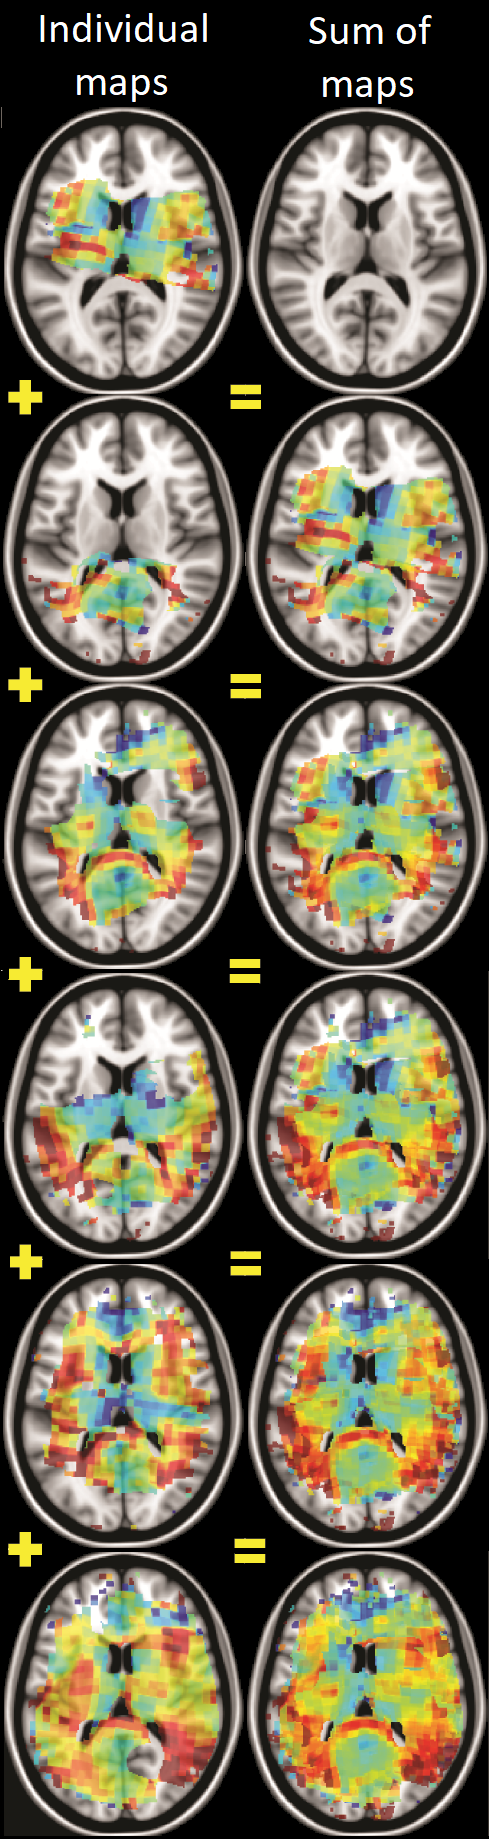
Using the novel MRSI setup and analysis pipeline (fig1), we were able to generate high quality maps for a variety of metabolites with high spatial coverage. A consequence of spatially averaging metabolite maps at the resolution of the 1mm-MNI152 atlas was an apparent increase in signal contrast between brain regions; particularly in striatal/thalamic regions of the brain where data density was high. Moreover, due to inter-subject variations in anatomy and slice planning, spatial coverage increased in our atlas as compared to the 20mm slice thickness planned during acquisition (fig2).Data on metabolite ratios that was missing in some maps due to QA filtration, or differences in acquisition and consequent anatomical registration, was often replaced by corresponding data from other subjects (fig3). While not all MM components could be determined using our parametrized MM basis functions, clear differences between GM and WM could be observed for 4 out of 6 MM signals (fig4).
Discussion & Conclusion
One of the major promises of MRSI is the ability to detect physiological changes in disease in the absence of structural/anatomical markers and evolving metabolic mapping techniques provide opportunities for evaluating the metabolic state of the entire brain. We demonstrate a novel 7T-MRSI approach to investigate high-resolution in-vivo metabolite levels across the human brain by combining several important methodological advances, including a crusher coil to suppress the high intensity extra-cranial lipid signal, advanced reconstruction and normalization to a standard space. We present a high-resolution reference atlas of metabolite ratios, as well as an initial investigation into macromolecule distributions, whose involvement in the progress of various diseases remains a point of interest. Our acquisition and processing pipeline provides an infrastructure to which future data can be easily added; also from other research groups or using MR scanners from other vendors. From a clinical point of view, regional metabolite maps can be used to study patho-physiological mechanisms related to metabolite levels in psychiatric and neurological disorders in unprecedented detail and, may ultimately prove useful for intervention strategies.Acknowledgements
This research was supported by a Brain and Behavior Research Foundation NARSAD Young Investigator Award (24074).References
[1] Boer V.O. et al. MRM 2015; [2] Ma J. MRM 2018; [3] Považan, M., et al, NIMG 2015; [4] Kirchner et al., MRM 2015; [5] Kirchner et al., MRM 2016; [6] Klose et al., MRM 1990;Figures