0924
Trajectory correction for ultrashort echo-time (UTE) imaging based on the measurement of the gradient impulse response function (GIRF) with a thin-slice method1Department of Diagnostic and Interventional Radiology, Technical University of Munich, Munich, Germany, 2Philips Research, Hamburg, Germany
Synopsis
Reconstruction of high-quality ultrashort echo-time UTE images requires precise knowledge of the dynamic gradient magnetic fields used to perform the spatial encoding during the ramp up of the gradients. System delays and eddy currents can perturb the gradient fields and significantly degrade the image quality. The present study proposes the measurement of the gradient transfer response function with standard scanner hardware to correct the UTE readout gradients and to improve UTE image quality.
Purpose
Ultrashort echo time (UTE) imaging allows the MR signal detection from tissues with very short T2/T2*1,2. With TEs of less than 1ms, UTE sequences have recently received increasing interest especially for the study of the musculoskeletal system3,4,5 and for PET attenuation correction6. UTE sequences typically acquire k-space data as soon as possible after the radiofrequency excitation and during the ramp up of the gradient fields7, making UTE imaging prone to eddy current and system delay effects8. The real k-space trajectory therefore deviates from the designed one, causing degradation of the reconstructed images.9 The k-space trajectory errors can be corrected with a precise knowledge of the actual UTE readout gradient waveform. A number of different techniques for the characterization of the UTE readout gradient have been proposed that either perform separate calibration scans before the UTE measurement8,10,11 or measure a universal gradient impulse response function (GIRF) with specialized NMR field probes6,12. The latter approach measures both short- and long-term eddy currents and system delays in one separate calibration scan however relying on the availability of specialized hardware. The purpose of this work is to perform a GIRF measurement using a technique that does not rely on additional hardware13,14,15,16,17 and to apply the measured GIRF for trajectory correction in UTE imaging.Methods
GIRF Measurement
To predict the behavior of the gradient system for all operation states
a phantom-based measurement of the GIRF was performed using a thin-slice method
(Figure 1a), as previously proposed in18,19,20. Specifically, after
the selection of a thin slice, a chirp waveform (Figure 1b) was played out with
a frequency range of 0.1-10 kHz and an acquisition window of 80ms. The
measurement was repeated: for positive and negative polarity of the readout
gradient, along all three gradient axes and for four slices per axis with increasing
distance from isocenter.
Trajectory Correction
For the GIRF estimation the phase was fitted with a 2nd order
polynomial after correcting it with the reference measurement. The magnitude
and phase of the first order components of the spatial GIRF (Figure 1c) were
used for the correction of the ideal gradient by convolving the GIRF with the input
readout gradient (Figure 2b). The nominal trajectory was calculated based on a simple low-pass model of the
gradient chain characterized by a single time constant.
Simulations
Simulated UTE
k-space data of a Shepp-Logan Phantom was generated using NUFFT by the Berkeley Advanced Reconstruction Toolbox (BART, https://mrirecon.github.io/bart/) based on the the measured, GIRF corrected, k-space
trajectories. Images were then reconstructed using the nominal k-space
trajectories and using again the measured trajectories
Phantom measurements
A 3D-UTE stack-of-stars
measurement was performed (Figure 2a) on a 3T system (Ingenia Elition, Philips
Healthcare, Best, The Netherlands) with a structural phantom in a 32-channel head-spine
coil using TE: 0.14 ms, TR: 2.8 ms, flip angle: 5°, in- plane resolution: 1.5x1.5 mm2, FOV 208x208x100 mm3, slice thickness: 2 mm.
Specimen measurements
A 3D-UTE stack-of-stars dual-echo measurement was performed with monopolar readout of a human elbow specimen
in a 16-channel TR-knee coil using TE: 0.14 ms/ 4.2 ms, TR: 7.4 ms, flip angle:
5°, in- plane resolution: 1.0x1.0 mm2, FOV 180x180x200 mm3,
slice thickness: 2 mm.
Results
Simulation
In Figure 3 the reconstructed images of simulated UTE k-space data with
nominal and measured trajectories are shown. The UTE images reconstructed with
the nominal trajectories show (a) higher signal intensity in the background and
(b) an overshoot of signal intensity at tissue borders with low signal.
Phantom
UTE
images of a structured phantom reconstructed with the nominal and measured
k-space trajectories are shown in Figure 4. The line profiles highlight (a)
background signal in air, (b) smoothed edges and (c) overestimated signal
intensity. All above artifacts are reduced in the images reconstructed with the
measured k-space trajectories
Specimen
Figure 5 shows UTE images
reconstructed with the nominal and measured k-space trajectories of a human
bone specimen. The nominal reconstructed UTE image shows an overshoot of signal
intensity at tissue borders with low signal like bone. Overall the signal
intensity is overestimated.
Discussion and Conclusion
Short-term eddy currents and system delays are known to lead to
artifacts in UTE images. The present work shows that with a simple GIRF
measurement and standard scanner hardware the real UTE k-space trajectories are
estimated and the image quality is improved. The reconstruction with GIRF-corrected
trajectories reduced signal in the background as previously shown16. Additionally, the
present work showed that GIRF-corrected trajectories resulted in reduced
blurring and reduced signal overshoot and undershoot next to tissue borders
with strong signal variations compared to the uncorrected reconstructed data.
Therefore, correcting the UTE trajectories should be also in principle
beneficial to quantitative T2* measurements of short T2* tissues.Acknowledgements
The present work was supported by the European Research Council (grant agreement No 677661, ProFatMRI). This work reflects only the authors view and the EU is not responsible for any use that may be made of the information it contains. The authors would also like to acknowledge research support from Philips HealthcareReferences
1. Robson MD, Gatehouse PD, Bydder M, Bydder GM. Magnetic Resonance: An Introduction to Ultrashort TE (UTE) Imaging. J Comput Assist Tomogr. 2003. doi:10.1097/00004728-200311000-00001.
2. Tyler DJ, Robson MD, Henkelman RM, Young IR, Bydder GM. Magnetic resonance imaging with ultrashort TE (UTE) PULSE sequences: Technical considerations. J Magn Reson Imaging. 2007;25(2):279-289. doi:10.1002/jmri.20851.
3. Reichert ILH, Robson MD, Gatehouse PD, et al. Magnetic resonance imaging of cortical bone with ultrashort TE pulse sequences. Magn Reson Imaging. 2005;23(5):611-618. doi:10.1016/j.mri.2005.02.017.
4. Du J, Bydder GM. Qualitative and quantitative ultrashort-TE MRI of cortical bone. NMR Biomed. 2013. doi:10.1002/nbm.2906.
5. Chang EY, Du J, Chung CB. UTE imaging in the musculoskeletal system. J Magn Reson Imaging. 2015;41(4):870-883. doi:10.1002/jmri.24713.
6. Aitken AP, Giese D, Tsoumpas C, et al. Improved UTE-based attenuation correction for cranial PET-MR using dynamic magnetic field monitoring. Med Phys. 2014;41(1). doi:10.1118/1.4837315.
7. Rahmer J, Börnert P, Groen J, Bos C. Three-dimensional radial ultrashort echo-time imaging with T2 adapted sampling. Magn Reson Med. 2006;55(5):1075-1082. doi:10.1002/mrm.20868.
8. Atkinson IC, Lu A, Thulborn KR. Characterization and correction of system delays and eddy currents for MR imaging with ultrashort echo-time and time-varying gradients. Magn Reson Med. 2009;62(2):532-537. doi:10.1002/mrm.22016.
9. Peters DC, Derbyshire JA, McVeigh ER. Centering the projection reconstruction trajectory: Reducing gradient delay errors. Magn Reson Med. 2003;50(1):1-6. doi:10.1002/mrm.10501.
10. Takizawa M, Hanada H, Oka K, Takahashi T, Yamamoto E, Fujii M. A Robust Ultrashort TE (UTE) imaging method with corrected k-space trajectory by using parametric multiple function model of gradient waveform. IEEE Trans Med Imaging. 2013;32(2):306-316. doi:10.1109/TMI.2012.2226050.
11. Latta P, Starčuk Z, Gruwel MLH, Weber MH, Tomanek B. K-space trajectory mapping and its application for ultrashort Echo time imaging. Magn Reson Imaging. 2017;36:68-76. doi:10.1016/j.mri.2016.10.012.
12. Vannesjo SJ, Haeberlin M, Kasper L, et al. Gradient system characterization by impulse response measurements with a dynamic field camera. Magn Reson Med. 2013;69(2):583-593. doi:10.1002/mrm.24263.
13. Duyn JH, Yang Y, Frank JA, Van Der Veen JW. Simple Correction Method for k-Space Trajectory Deviations in MRI. J Magn Reson. 1998;132(1):150-153. doi:10.1006/jmre.1998.1396.
14. Brodsky EK, Klaers JL, Samsonov AA, Kijowski R, Block WF. Rapid measurement and correction of phase errors from B0 eddy currents: Impact on image quality for non-cartesian imaging. Magn Reson Med. 2013;69(2):509-515. doi:10.1002/mrm.24264.
15. Addy NO, Wu HH, Nishimura DG. Simple method for MR gradient system characterization and k-space trajectory estimation. Magn Reson Med. 2012;68(1):120-129. doi:10.1002/mrm.23217.
16. Stich M, Pereira LM, Wech T, et al. Trajectory correction for a 3D-ultrashort echo time (UTE) sequence using the gradient system transfer function. Proc Intl Soc Mag Res Med. 2018:0941. ismrm 2018 0941.
17. Campbell-Washburn AE, Xue H, Lederman RJ, Faranesh AZ, Hansen MS. Real-time distortion correction of spiral and echo planar images using the gradient system impulse response function. Magn Reson Med. 2016;75(6):2278-2285. doi:10.1002/mrm.25788.
18. Campbell-Washburn AE, Xue H, Lederman RJ, Faranesh AZ, Hansen MS. Real-time distortion correction of spiral and echo planar images using the gradient system impulse response function. Magn Reson Med. 2016;75(6):2278-2285. doi:10.1002/mrm.25788.
19. Addy NO, Wu HH, Nishimura DG. Simple method for MR gradient system characterization and k-space trajectory estimation. Magn Reson Med. 2012;68(1):120–129. doi:10.1002/mrm.23217.
20. Mazurkewitz P, Rahmer J, Börnert P. GIRF measurement using a combination of triangular and chirp waveform input functions. In: Proc. Joint Annual Meeting ISMRM-ESMRMB, Paris, France. ; 2018.
Figures

Figure 1: Measurement of the
gradient impulse response function
(a) Thin-slice method to generate a virtual probe for the GIRF
measurement. After the slice is excited a chirp gradient waveform (b) is played
out. (c) Spectral representation of the gradient impulse response function.
Shown is the measured linear transfer function for all three gradient axis.

(a) UTE stack-of-stars sequence diagram showing the (b) ideal, nominal and measured (GIRF corrected) readout gradient. The dotted line illustrates the start of the acquisition.
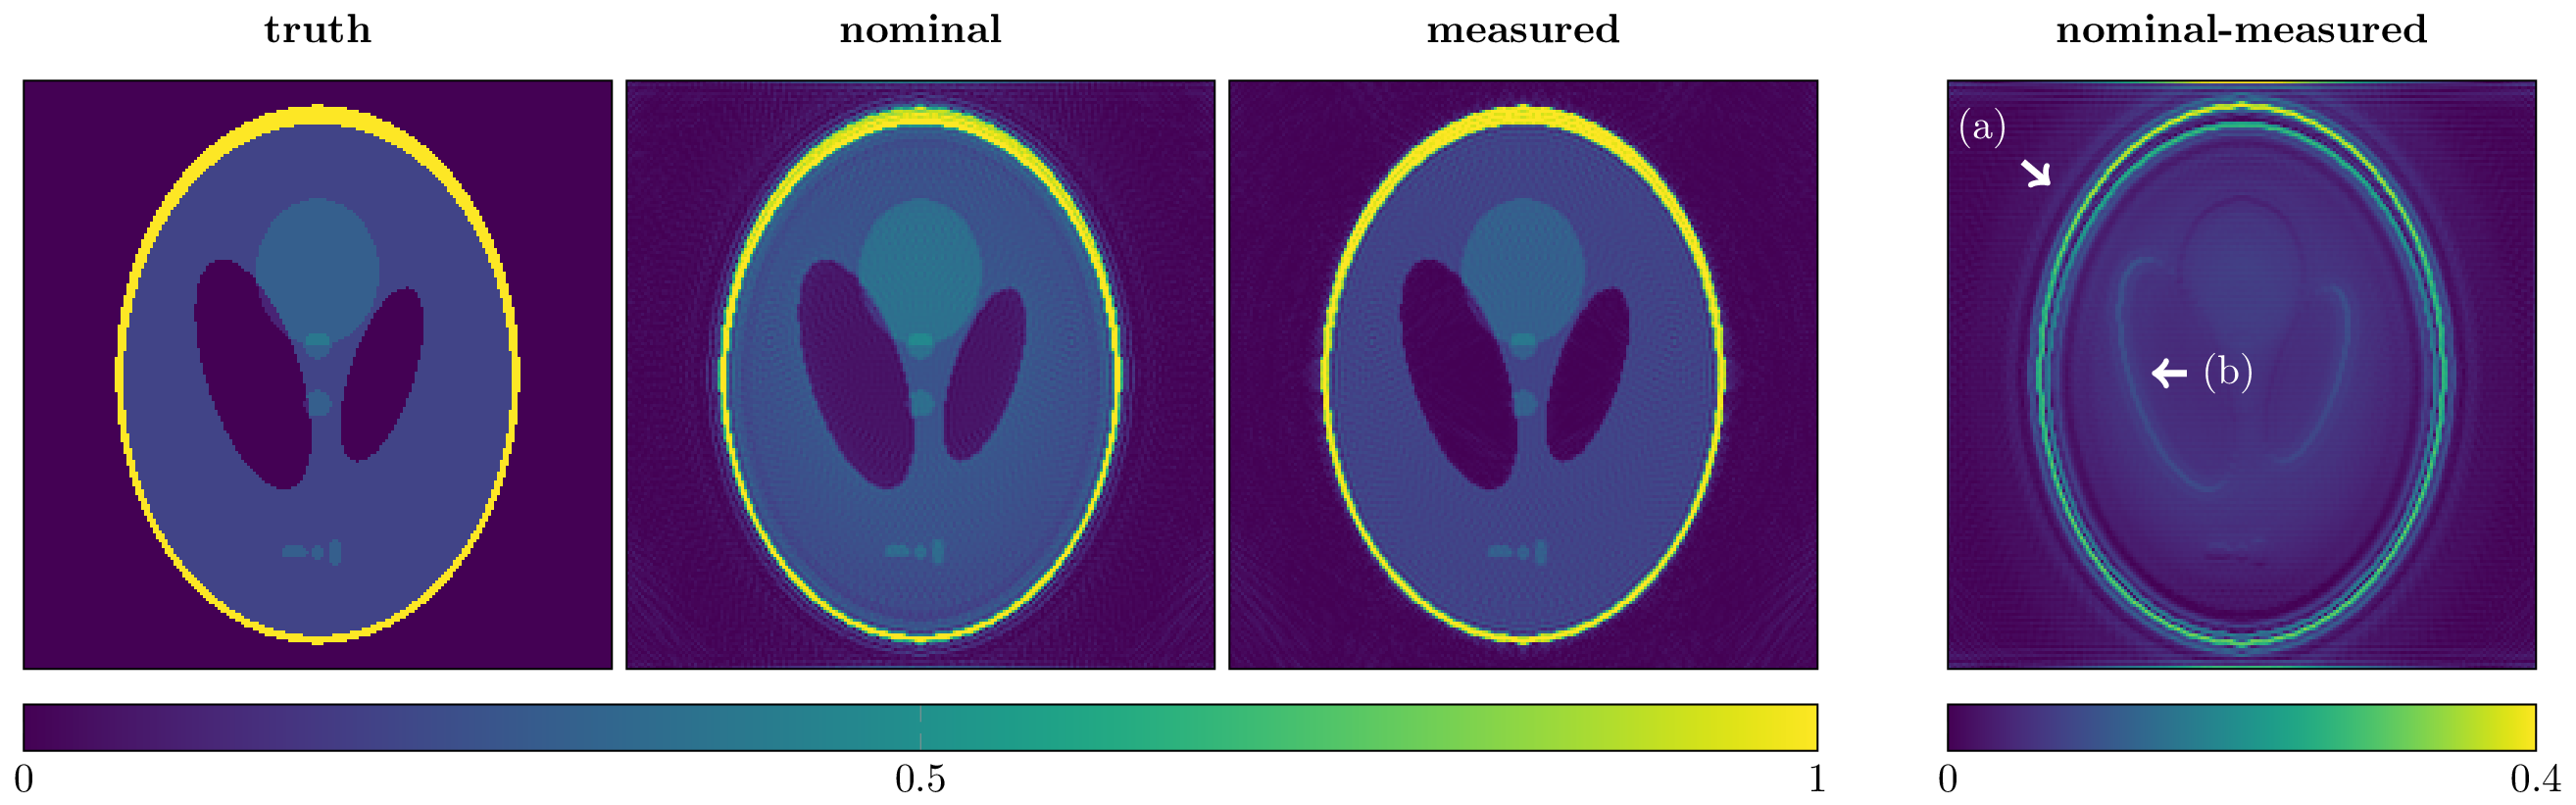
The k-space data was generated using NUFFT encoding and the measured trajectories. Images were then reconstructed using the nominal and again the measured trajectories. Blurring is introduced in the UTE image reconstructed with the nominal trajectory. Especially on the air-tissue border the nominal reconstructed image (arrow a) has more energy in the background (air) region and shows an overshoot (arrow b) of signal intensity at tissue borders with low signal.

The phantom images were reconstructed using the nominal and measured trajectories. The line profiles highlight the signal overshoot in regions with low signal (arrow a), the blurring of high-resolution features (arrow b) and the overestimation of the signal amplitude (arrow c).

Figure
5: UTE
stack-of-stars dual-echo images of a human bone specimen preserved in formalin.
Shown is a transversal slice of the forearm with the
radial bone and the ulna. In the nominal reconstructed image, the signal
amplitude is overestimated at tissue borders with strong signal variations. A
line profile through the proximal ulna highlights the aforementioned
overestimation (arrow). The location of the bone tissue border is detected by
the 2nd non-UTE image.