0919
Towards a Standard Pipeline for the Analysis of Human Spinal Cord fMRI Data SeriesMauro DiNuzzo1, Julien Cohen-Adad2, Fabio Mangini1, Laura Maugeri1, Marta Moraschi3, Daniele Mascali3, Federico Giove3, and Michela Fratini1
1IRCCS Fondazione Santa Lucia, Rome, Italy, 2NeuroPoly Lab, Institute of Biomedical Engineering, Polytechnique Montreal, Montreal, QC, Canada, 3Enrico Fermi Centre, Rome, Italy
Synopsis
Spinal cord functional magnetic resonance imaging (scfMRI) is still insufficiently
exploited in clinical settings due to several challenging problems related to
image acquisition and analysis. In the present study, we implemented and
optimized a scfMRI data analysis pipeline built around the Spinal Cord Toolbox
(SCT). We acquired axial and sagittal functional images at 3T from the spinal
cord of forty-six healthy subjects performing an isometric motor task. Using our SCT-based
pipeline, we substantially improved motion correction and image registration.
Furthermore, we found task-induced activations with a high level of statistical
significance.
INTRODUCTION
Spinal cord functional magnetic resonance imaging (scfMRI) is a promising tool for non-invasive assessment of human spinal cord function following traumatic injury or neurodegenerative disease. In spite of decades of research, the utilization of scfMRI in clinical settings has been hampered by technical and methodological limitations related to spinal cord motion (due to respiratory and cardiac-driven pulsation of spinal arteries and cerebrospinal fluid), poor spatial resolution, image distortions and signal loss (due to surrounding structures with different density, e.g. vertebrae and intervertebral discs) 1, 2. As a result, the development of data analysis methods and relevant software has been almost exclusively restricted to brain fMRI. The aim of the present study was to contribute filling this gap by implementing and optimizing a pipeline for scfMRI data analysis.METHODS
The pipeline incorporated physiological noise correction, realignment, slice timing, centerline-directed smoothing, segmentation and normalization. Many of these steps have been made available only recently with the introduction of the Spinal Cord Toolbox (SCT) 3. In particular, we combined existing software libraries commonly employed for brain fMRI with further developments of SCT. In particular, we used (i) custom-made Matlab (The MathWorks, Inc.) implementation of RETROICOR 4 for cardiorespiratory rhythms correction using peripheral measures of respiration and cardiac pulsation; (ii) Statistical Parametric Mapping (SPM12) for slice timing as well as first- and second-level statistical analysis; (iii) Analysis of Functional NeuroImages (AFNI) and FMRIB Software Library (FSL) packages for intermediate image preparations and for testing purposes; and (iv) SCT for realignment (motion correction, hereafter MoCo), longitudinal spatial smoothing, segmentation and vertebral labeling as well as normalization (registration) to the PAM50 spinal cord template 5. The pipeline was applied to functional (gradient echo EPI) images acquired on a Philips Achieva 3T MR scanner using a neurovascular coil array with the following sequence parameters: TE/TR = 25/3000 ms, Flip angle = 80°, FOV = 192x144x104 mm3 (sagittal) or 140x140x143 mm3 (axial), acquisition Matrix = 128x128x35 (sagittal) or 96x96x34 (axial), resolution = 3x1.5x2 mm3 (sagittal) or 1.5x1.5x3 mm3 (axial). Anatomical reference images were acquired using T1-weighted gradient echo sequence (TE/TR 5.89/9.59 ms, flip angle 9°, FOV = 240x240x192 cm3, resolution 0.75x0.75x1.5mm3). Images were acquired from forty-six healthy subjects (all right-handed with a mean age of 35 years) while performing a block-design isometric motor task (hand-held force transducer and a visual feedback system) consisting of 5 cycles of 30s/30s rest/task epochs.RESULTS
Figure 1 shows a representative example of the quality of segmentation and normalization to PAM50 template reference performed with SCT on anatomical images for guidance in manual vertebral labeling of EPI images (see below). The latter underwent the complete data analysis pipeline. We applied the pipeline to both axial and sagittal images to examine the impact of different acquisition directions on the physiological noise removal. Particularly, we investigate the performance of the de-noising strategy by evaluating the temporal Signal to Noise Ratio (tSNR). The variability of tSNR increase was assessed by computing the relative Coefficient of Variation (CV). We found that the SCT MoCo algorithm led to an increase in image tSNR of about 16% and 41% for sagittal and axial images, respectively, thus significantly outperforming available computational tools such as AFNI 3dWarpDrive (Figure 2). Furthermore, compared with AFNI SCT MoCo substantially reduced the variability of the relative tSNR change among subjects (by 15% and 7% for sagittal and axial images, respectively). The spatial distribution map of the tSNR gain indicates that the increase is restricted to the cord and it is rather uniform across it. The segmentation and normalization of EPI images to PAM50 allowed for robust 2nd-level analysis, as evidenced by the activation maps (threshold at p<0.001 uncorrected), which showed consistent ipsilateral active voxels with none (sagittal) or few (axial) significant voxels outside the cord (Figure 3).DISCUSSION
Our data analysis pipeline combining recently developed and optimized software packages substantially improved the otherwise problematic detection of task-activated voxels at group-level, even with a relatively small number of subjects. Important determinants for such good statistical power are the algorithm for motion correction specifically developed for the spinal cord and the normalization to the reference template, which are two major features of SCT. Although further benchmarking is necessary to test the robustness and reliability of results in more subjects, the present approach supports the usefulness of optimized pipelines in human scfMRI studies.CONCLUSION
Overall, the present work provides an optimized methodological tool to move the field of scfMRI forward in basic research and towards forthcoming applications in the clinical practice.Acknowledgements
This research was financially supported by The Italian Ministry of Health Young Researcher Grant 2013 (GR-2013-02358177).References
- Fratini M, Moraschi M, Maraviglia B, Giove F. On the impact of physiological noise in spinal cord functional MRI. Journal of magnetic resonance imaging : JMRI 2014; 40(4): 770-7.
- Giove F, Garreffa G, Giulietti G, Mangia S, Colonnese C, Maraviglia B. Issues about the fMRI of the human spinal cord. Magn Reson Imaging 2004; 22(10): 1505-16.
- De Leener B, Levy S, Dupont SM, Fonov VS, Stikov N, Louis Collins D et al. SCT: Spinal Cord Toolbox, an open-source software for processing spinal cord MRI data. Neuroimage 2017; 145(Pt A): 24-43.
- Maugeri L, Moraschi M, Summers P, Favilla S, Mascali D, Cedola A et al. Assessing denoising strategies to increase signal to noise ratio in spinal cord and in brain cortical and subcortical regions. Journal of Instrumentation 2018; 13(02): C02028.
- De Leener B, Fonov VS, Collins DL, Callot V, Stikov N, Cohen-Adad J. PAM50: Unbiased multimodal template of the brainstem and spinal cord aligned with the ICBM152 space. NeuroImage 2018; 165: 170-179.
Figures
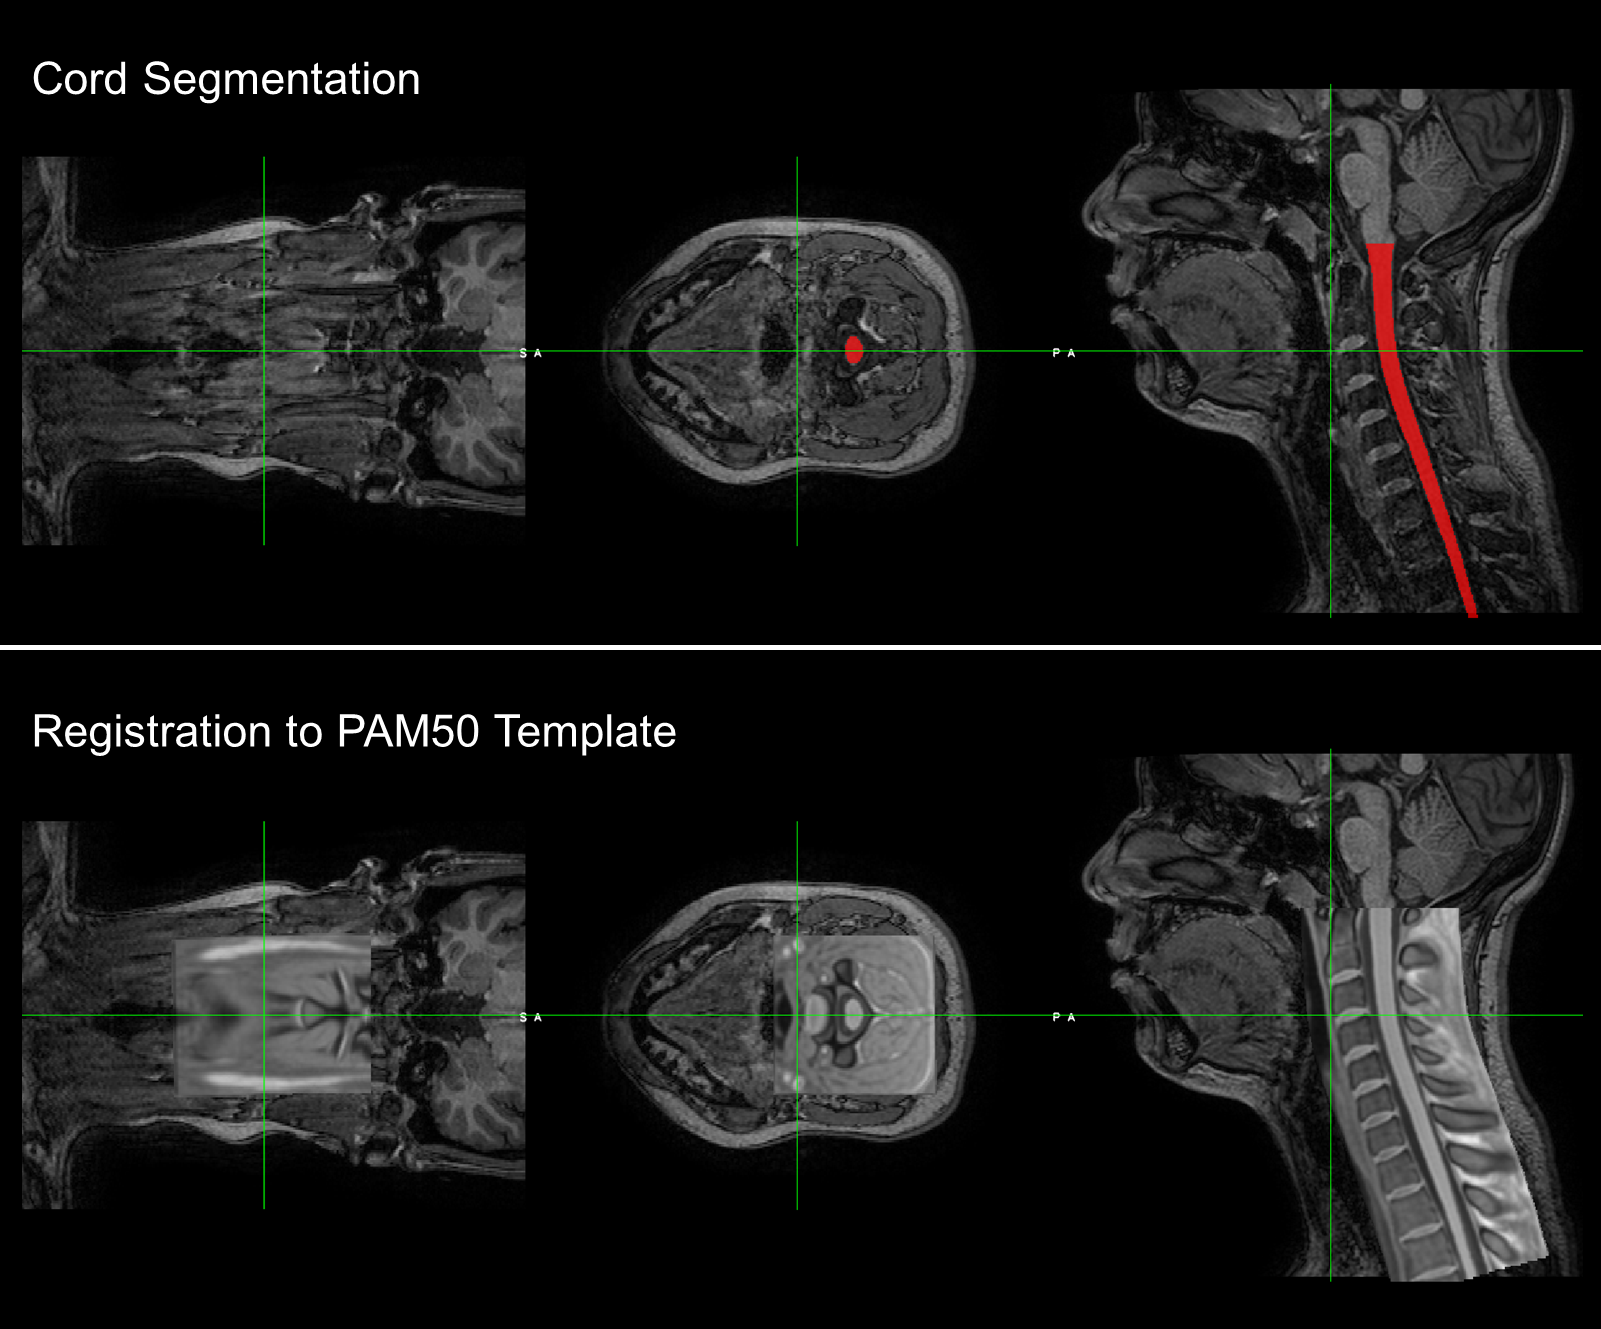
Figure 1. Representative anatomical T1-weighted image covering part of
the brain and cervical spinal cord. This step guided the segmentation of EPI
images for manual labeling of C2/C3 vertebral disc.
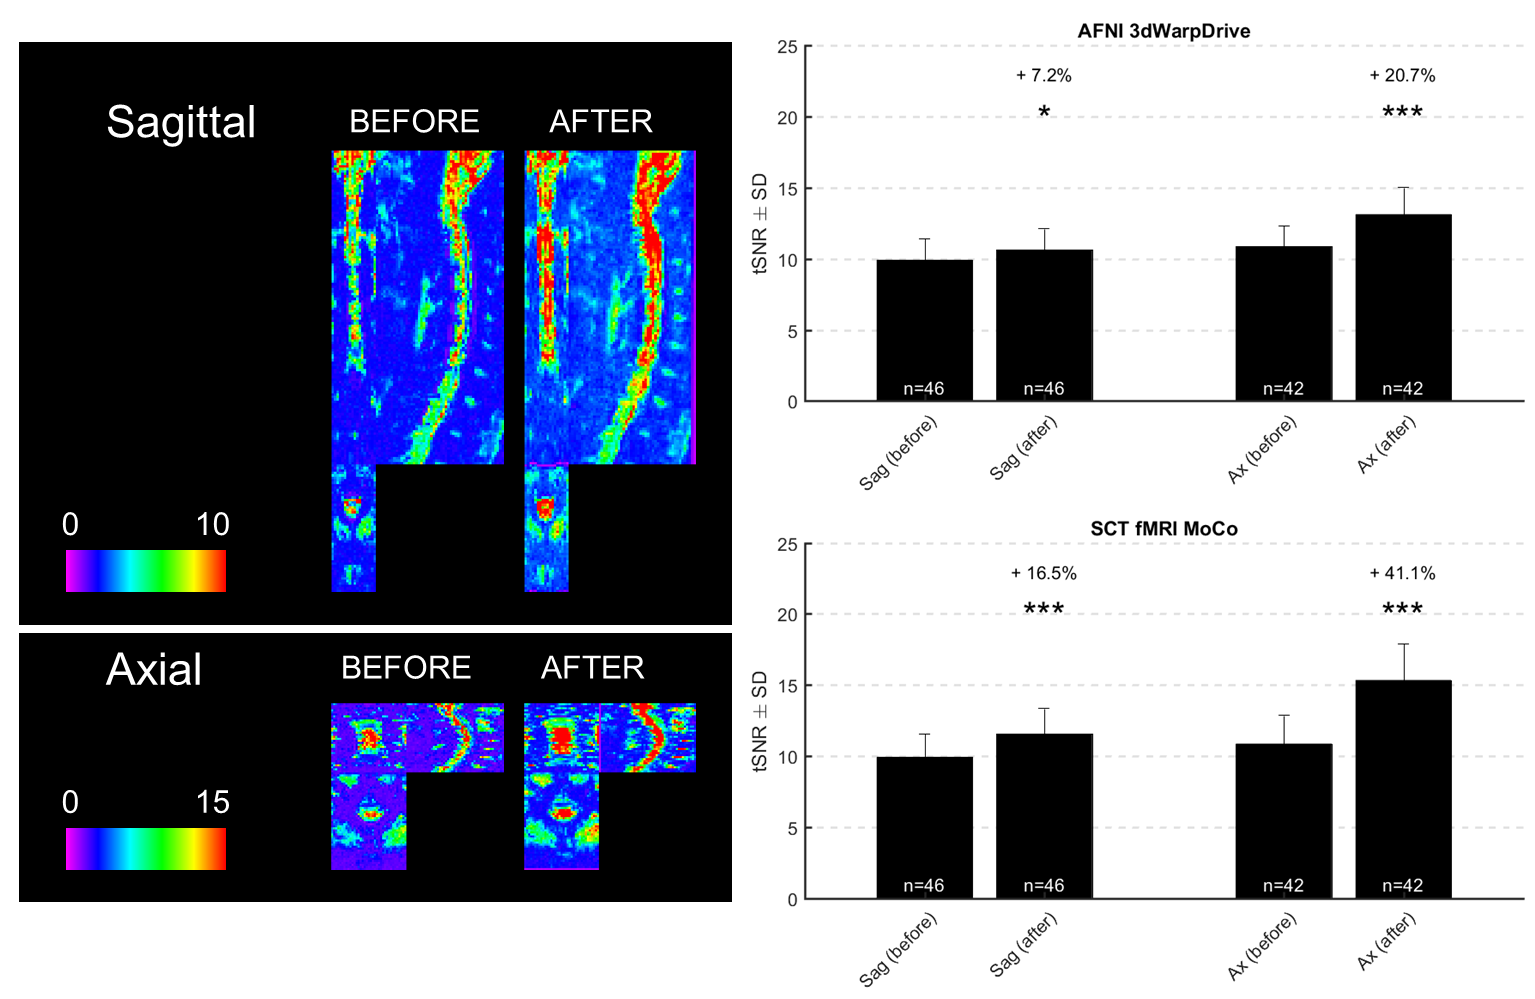
Figure 2. Increase in tSNR after motion correction in both sagittal and
axial images. Representative tSNR maps from a healthy subject before and after
SCT fMRI MoCo (left). Group statistics for tSNR after motion correction
performed either with AFNI or SCT (right). CV for AFNI 3dWarpDrive and SCT fMRI
MoCo was 59% and 44% for sagittal images, respectively, and 43% and 36% for
axial images, respectively. The increase in tSNR is statistically significant.
* p<0.05, *** p<0.001.
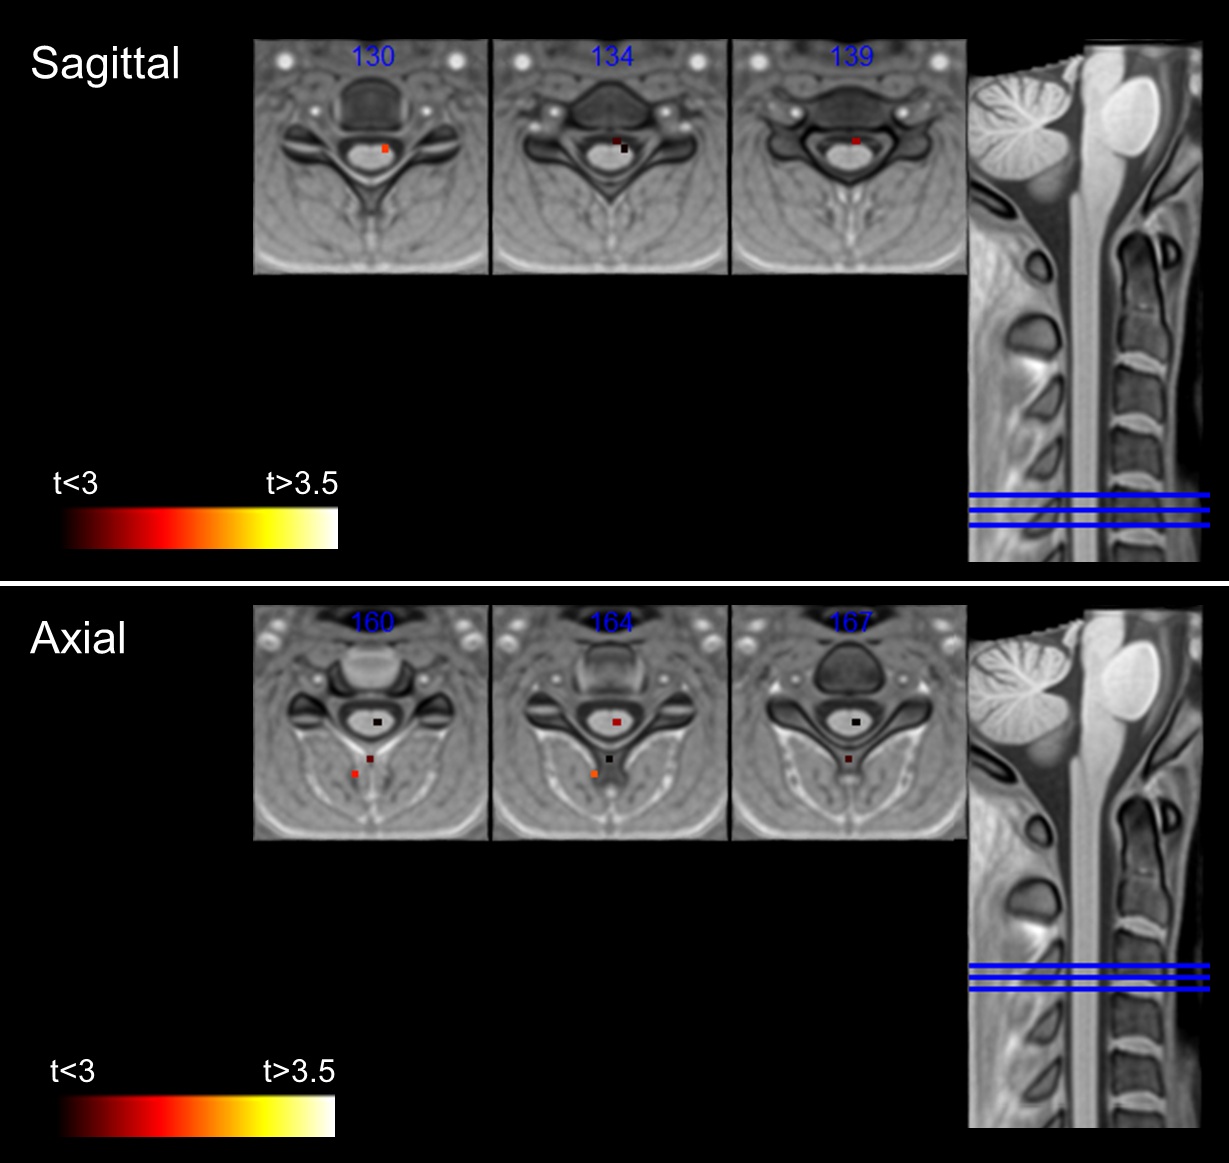
Figure 3. Activation maps after group-level analysis performed in the
PAM50 template space. In the sagittal images there were no active voxels
outside the cord, while some active voxels outside the cord survived threshold
(p<0.001 uncorrected) in axial images. However, active voxels in axial
images are more consistent with grey matter activation, while in sagittal
images the active voxels are found in white matter. The longitudinal level of
the activation is also different (C5 for sagittal images and C3/C4 for axial
images). As expected, the functional activation is only found in ipsilateral
spinal cord.