0918
Task-fMRI: pre-whitening and hemodynamic response function modeling substantially impair specificity and sensitivity1Dept. of Clinical Neurosciences, University of Cambridge, Cambridge, United Kingdom, 2Dept. of Pure Mathematics and Mathematical Statistics, University of Cambridge, Cambridge, United Kingdom, 3MRC Cognition and Brain Sciences Unit, University of Cambridge, Cambridge, United Kingdom
Synopsis
Given the recent controversies in some neuroimaging statistical methods, we investigated pre-whitening and hemodynamic response function (HRF) modeling techniques available in AFNI, FSL and SPM and used in task-fMRI studies. We found that pre-whitening often leaves much positive autocorrelated noise in the data, which leads primarily to false positives. Also, we observed that for an event-related design dataset, the use of the simple canonical HRF led to a strong sensitivity deterioration. Currently, both specificity and sensitivity could be increased in task-fMRI studies with some less popular, but widely available statistical methods.
Introduction
Functional Magnetic Resonance Imaging (fMRI) data are known to be positively autocorrelated in time. If this autocorrelation is not properly accounted for during pre-whitening, parts of the brain might erroneously appear active during an experiment. This lowers specificity (1). When analyzing task-fMRI data, assumptions about hemodynamic response function (HRF) are made. Most often the canonical HRF model is used, though it is known to be an approximation (2). Using data corresponding to different fMRI protocols, we analyzed the impact of pre-whitening and HRF modeling on specificity and sensitivity.
Methods
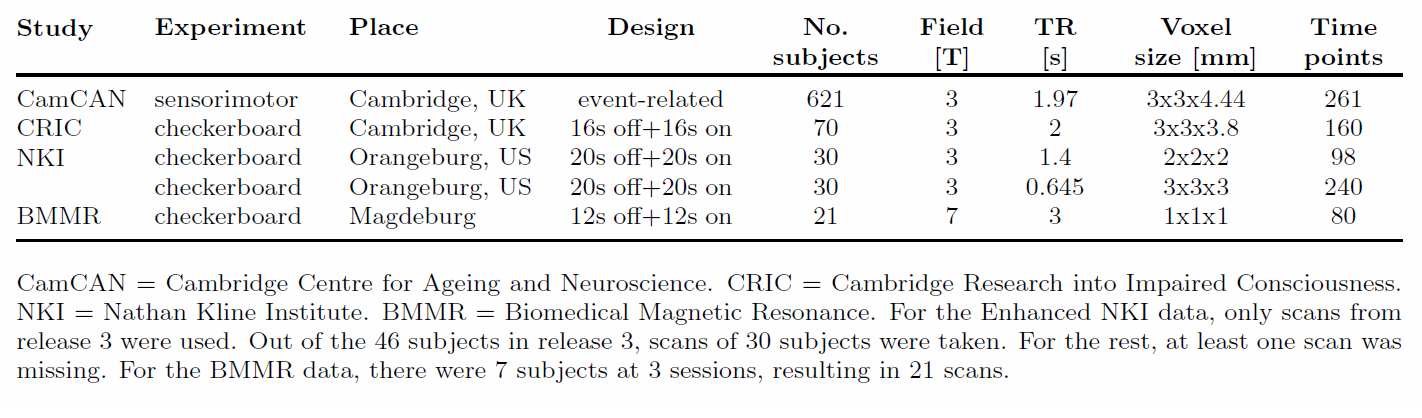
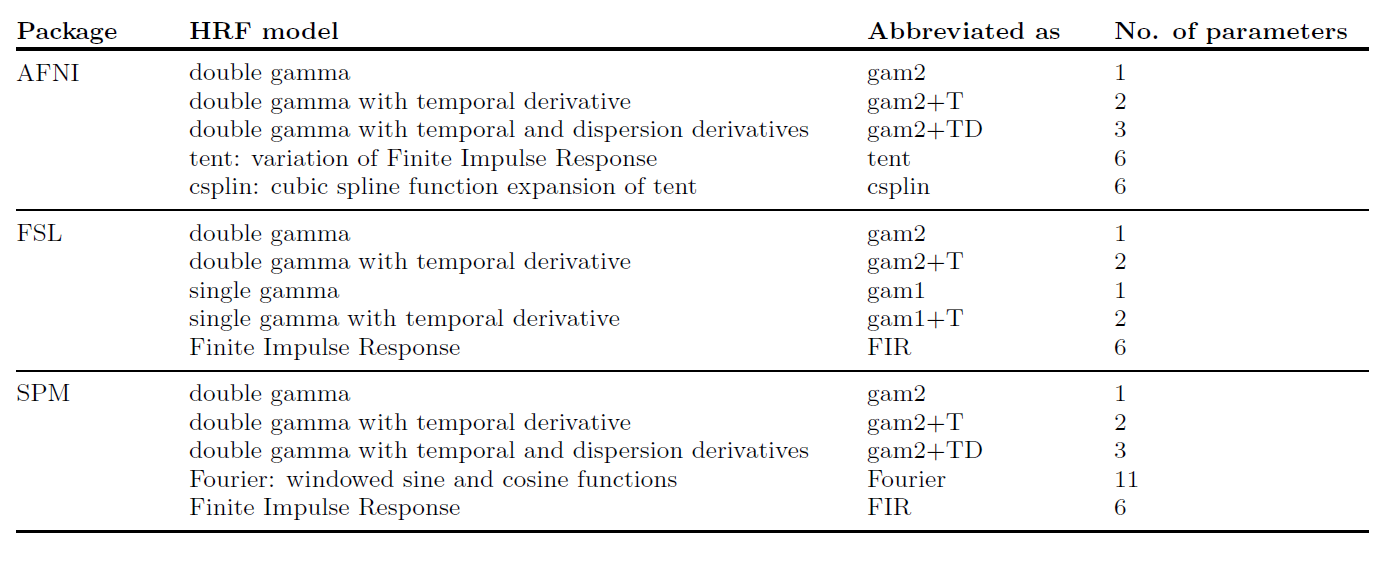
For our analyses, we employed five task datasets (Table 1), both with boxcar and event-related designs. CamCAN (3, www.cam-can.org) and NKI (4) data and are publicly shared anonymized data. CRIC and BMMR (5) scans can be obtained from us upon request. We investigated pre-whitening methods available in AFNI, FSL and SPM. These are the most popular fMRI packages. We analyzed power spectra of the GLM residuals (1). For SPM, we checked the performance both of its default pre-whitening method, and of its alternative approach: FAST. We also compared some of the HRF models from AFNI, FSL and SPM (Table 2).
In order to investigate specificity, we applied incorrect designs when analyzing task data. If for such null data, two pre-whitening methods (or HRF models) perform comparably, while for task-based data tested with the true design, the use of one pre-whitening method (or HRF model) leads to detection of more significant activation, this could be treated as evidence of this pre-whitening method (or HRF model) being more sensitive. For AFNI, FSL and SPM analyses, the analyses pipelines were kept consistent, so that for the pre-whitening analyses the only relevant difference was the noise model, while for the HRF analyses the only relevant difference was the noise model (for SPM: FAST) together with the HRF model.
All the processing scripts needed to fully replicate the analyses are at https://github.com/wiktorolszowy/fMRI_temporal_autocorrelation and https://github.com/wiktorolszowy/fMRI_HRFs_comparison.
Results
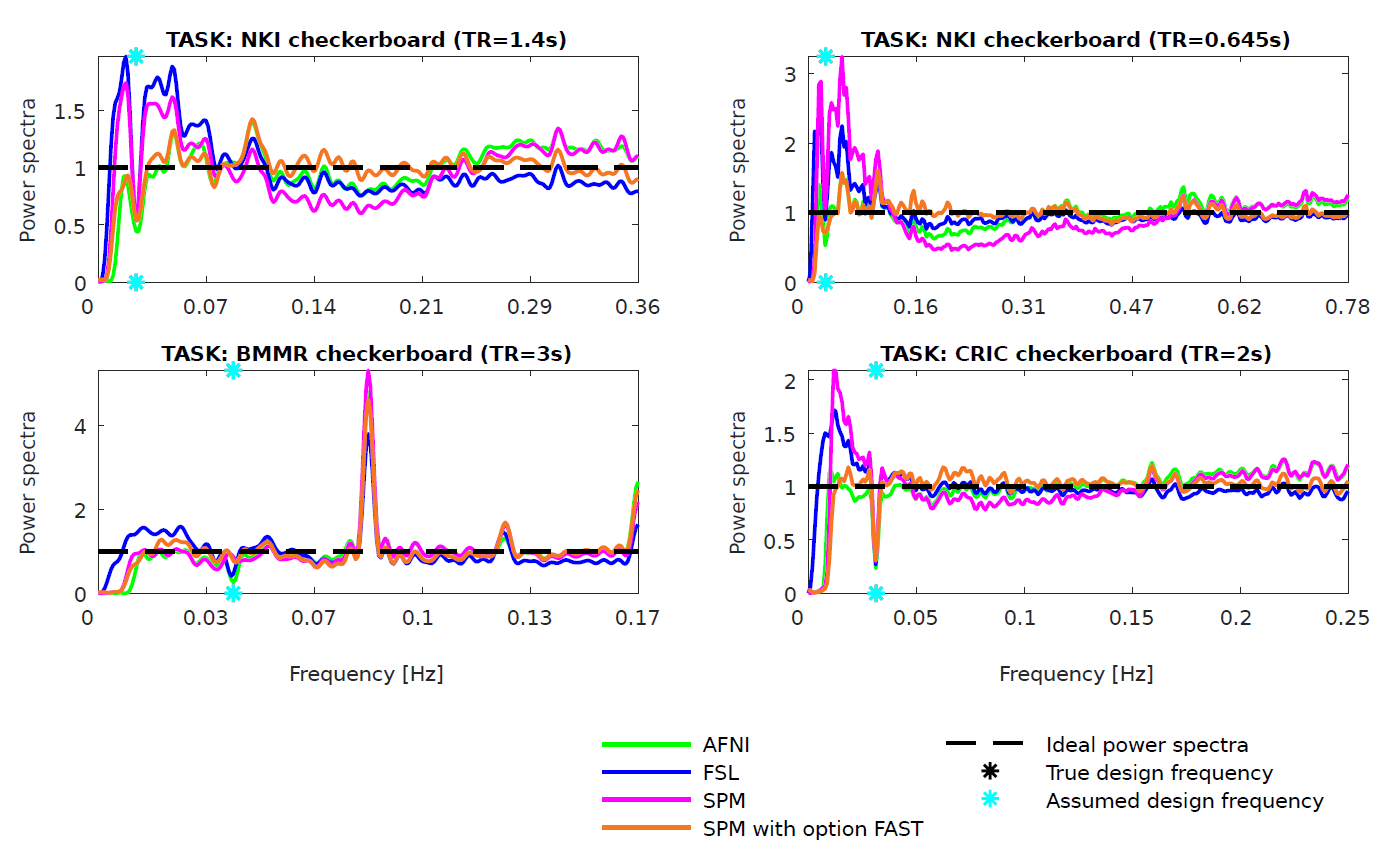
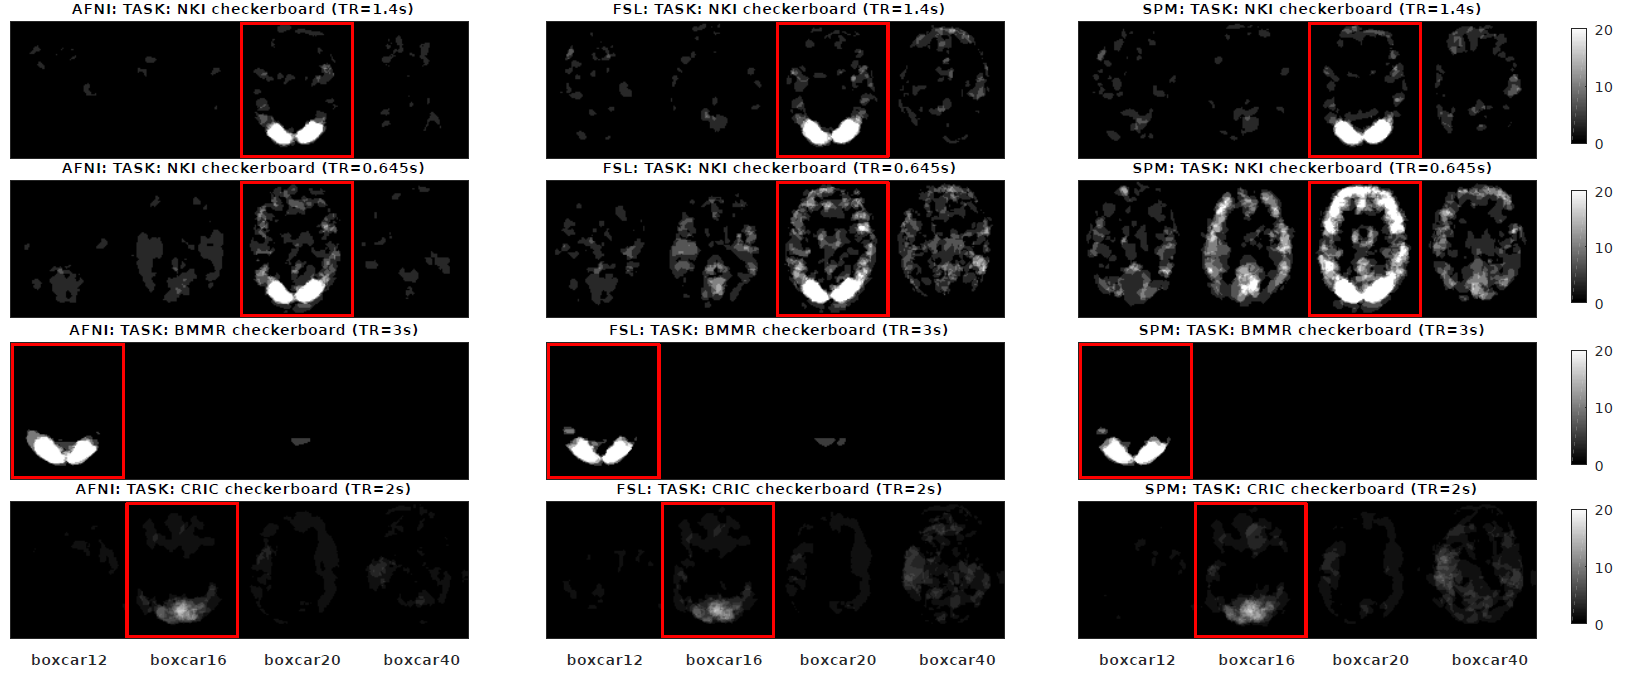
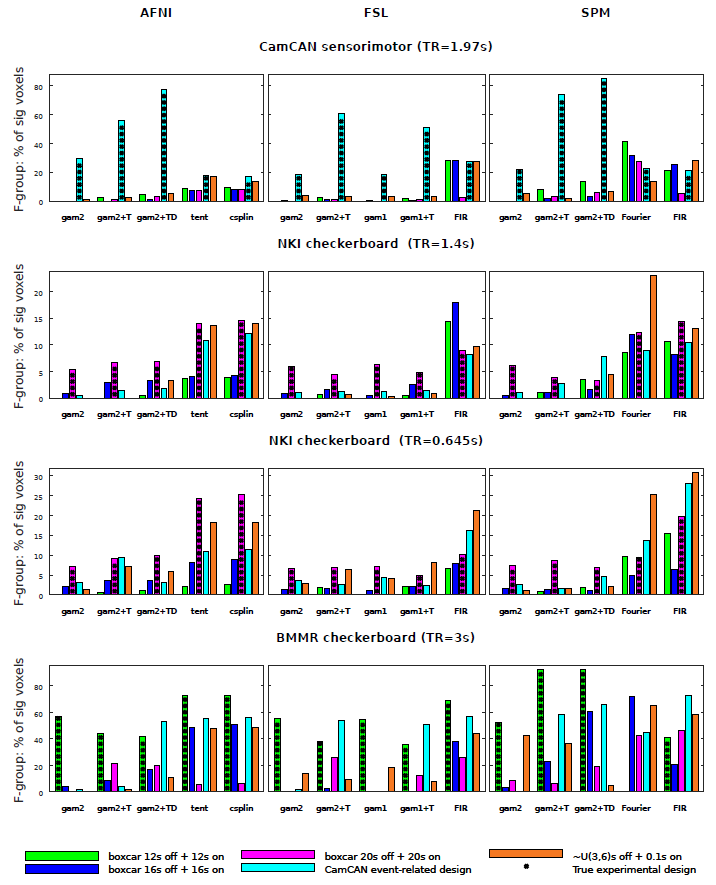
Analysis of the power spectra of the GLM residuals pointed to pre-whitening problems with FSL and SPM’s default methods (Figure 1). Figure 2 presents spatial distribution of significant clusters across single subject analyses for different assumed designs. For example, ‘boxcar12’ refers to design of 12s of rest followed by 12s of stimulus presentation. FSL and SPM’s default pre-whitening methods led to poor differentiation between the true design and the incorrect designs. Figure 3 shows group level results for different HRF models and different designs. For the event-related design dataset (“CamCAN sensorimotor”) tested with the true design, the highest percentage of significant voxels was found using an F-test on the canonical function together with derivatives.
Discussion
AFNI and SPM with option FAST showed much higher whitening performance than FSL and SPM’s default. It affected primarily first level results, leading to many false positive clusters for FSL and SPM analyses, particularly for low-frequency designs. Scans with short repetition times were strongly affected too. FSL is the only package with a benchmarking paper of its pre-whitening approach (6). The study employed data corresponding to two fMRI protocols. For one protocol TR was 1.5s, while for the other protocol TR was 3s. For both protocols, the voxel size was 4x4x7 mm^3. These were large voxels. FSL's pre-whitening approach could have been overfitted to this data. Regarding SPM, pre-whitening with simple global noise models was found to result in profound bias in at least two previous studies (7,8).
Regarding HRF modeling, the use of the temporal and dispersion derivatives led to large sensitivity increases compared to the use of the canonical model only, but only when the statistical inference was based on an F-test which tested the variance explained by canonical function together with the derivatives rather than a t-test which tested the variance explained by the canonical function only. This was the case for the event-related design dataset, both for single subject and for group level analyses. Unfortunately, most task-fMRI studies employ temporal derivative only as a confounder and base statistical inference on a t-test for the canonical function (like FSL's default).
Conclusions
Results from FSL could be made more robust if a different autocorrelation model was applied. However, currently there is no alternative pre-whitening approach in FSL. For SPM, our findings support more widespread use of the FAST method. We provide a simple MATLAB tool for the fMRI researchers to check if their analyses are affected by imperfect pre-whitening: https://github.com/wiktorolszowy/fMRI_temporal_autocorrelation/blob/master/plot_power_spectra_of_GLM_residuals.m. For an event-related design dataset, the use of canonical HRF along its derivatives improved sensitivity a lot, but only when using an F-test on all HRF-related covariates.
In task-fMRI studies both specificity and sensitivity could be increased with some less popular, but widely available statistical methods.
Acknowledgements
W.O. was in receipt of scholarships from the Cambridge Trust and from the Mateusz B. Grabowski Fund.References
- Olszowy, W., Aston, J., Rua, C., & Williams, G. B. (2018). Accurate autocorrelation modeling substantially improves fMRI reliability. bioRxiv, 323154.
- Handwerker, D. A., Ollinger, J. M., & D'Esposito, M. (2004). Variation of BOLD hemodynamic responses across subjects and brain regions and their effects on statistical analyses. Neuroimage, 21(4), 1639-1651.
- Shafto, M. A., Tyler, L. K., Dixon, M., Taylor, J. R., Rowe, J. B., Cusack, R., ... & Henson, R. N. (2014). The Cambridge Centre for Ageing and Neuroscience (Cam-CAN) study protocol: a cross-sectional, lifespan, multidisciplinary examination of healthy cognitive ageing. BMC neurology, 14(1), 204.
- Nooner, K. B., Colcombe, S., Tobe, R., Mennes, M., Benedict, M., Moreno, A., ... & Sikka, S. (2012). The NKI-Rockland sample: a model for accelerating the pace of discovery science in psychiatry. Frontiers in neuroscience, 6, 152.
- Abd Hamid, A. I., Speck, O., & Hoffmann, M. (2015). Quantitative assessment of visual cortex function with fMRI at 7 Tesla—test–retest variability. Frontiers in human neuroscience, 9, 477.
- Woolrich, M. W., Ripley, B. D., Brady, M., & Smith, S. M. (2001). Temporal autocorrelation in univariate linear modeling of FMRI data. Neuroimage, 14(6), 1370-1386.
- Friston, K. J., Josephs, O., Zarahn, E., Holmes, A. P., Rouquette, S., & Poline, J. B. (2000). To smooth or not to smooth?: Bias and efficiency in fmri time-series analysis. NeuroImage, 12(2), 196-208.
- Lenoski, B., Baxter, L. C., Karam, L. J., Maisog, J., & Debbins, J. (2008). On the performance of autocorrelation estimation algorithms for fMRI analysis. IEEE Journal of Selected Topics in Signal Processing, 2(6), 828-838.
Figures