0916
Physiologic noise correction effects on seed based spontaneous co-activation pattern analysis1Radiology, Cleveland Clinic, Cleveland, OH, United States, 2Biomedical Engineering, Pennsylvania State University, University Park, PA, United States, 3Institute for Cyber Science, Pennsylvania State University, University Park, PA, United States
Synopsis
The Spontaneous co-activation (CAP) approach has shown the potential to investigate the dynamic change in resting state fMRI. However, dynamic rs-fMRI would be expected to be sensitive to physiologic fluctuation since dynamic changes of CAP pattern could be affected by the spatiotempolly correlated physiologic pulsation in the brain. We investigate the physiologic noise effects on seed-based CAP analysis in this study, and we find that the physiologic noise corrected data generates not only a different fraction and consistency of CAP patterns, but also different CAP patterns.
Introduction
The spontaneous co-activation (CAP) approach has shown the potential to investigate the dynamic change in resting state fMRI (1, 2). However, dynamic resting state (rs-) fMRI would be expected to be sensitive to physiologic fluctuation since vigilance and arousal modulation are related to rs-fMRI amplitude change (3, 4) and rs-fMRI connectivity is likely affected by the spatiotemporal correlations across the brain caused by physiologic pulsation (5). In this study, we investigate the effects of physiologic noise correction on seed-based spontaneous co-activation pattern (CAP) analysis.Method
Twenty eight healthy controls were scanned at 3T using single band EPI with pulse plethysmograph and respiratory belt recording (TR=2.8s, 128x128 matrix, 31 slices, 132 repetitions). After the first 4 volumes were removed, A) untreated data: pre-processing step was conducted using afni_proc.py; 3d volume motion was corrected. Six motion parameters were regressed out with polynomial detrending. B) RETROICOR was applied slicewise first (6) and the preprocess described above was conducted. C & D) RETROICOR + RVT (7); After slicewise RETROICOR correction, single (C) and five (D) RVT regressors with -10, -5, 0 5, and 10 sec of delay were regressed out with the motion parameters in the pre-process. Pre-processed EPI images were normalized to MNI and resampled with isotropic 3 mm voxel size. 3D 4mm of FWHM spatial smoothing was applied and the low frequency band pass filtering (0.005 < < 0.1Hz) was applied.
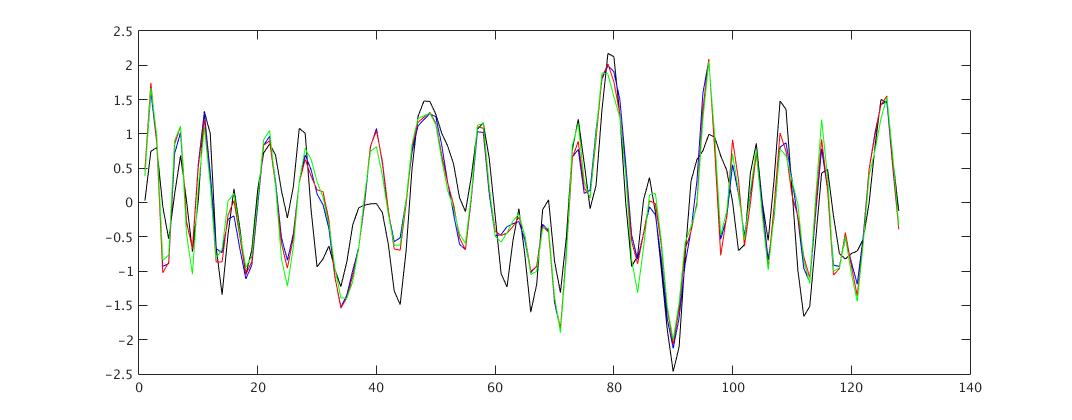
The seed, PCC ([0,-53,26]) related spontaneous CAP were calculated using kmeans (10,000 iteration) with 8 cluster number. To improve SNR, the time frames at the top 15% of signals were selected and the mask of the top 10% and the bottom 5% of voxels were chosen before k-mean clustering as described (1). Since the seed signals fluctuate differently in A-D data set, as shown in Fig1, two different temporal frames were selected across A-D data set; The temporal frames were selected in A dataset and used in A to D dataset, and the temporal frames were selected independently across A-D dataset.
The classified patterns are sorted from the largest to the smallest fraction (2) and the consistency of each pattern was calculated by average CC between the cluster and each corresponding frame (1). The selected patterns of different physiologic noise-corrected data (B to D) were classified to one of clusters from the untreated data (A) to maximize CC.
Result
Fig1 plots the example of the time series of PCC seed signals with/out physiologic noise correction (A to D). In the untreated seed signals, the correlation coefficient (CC) with RETRIOCIR, RETROICOR+1RVT and RETROICOR+5RVT are calculated 0.95±0.03, 0.93I±0.04 and 0.90±0.05 across 28 subjects, respectively.
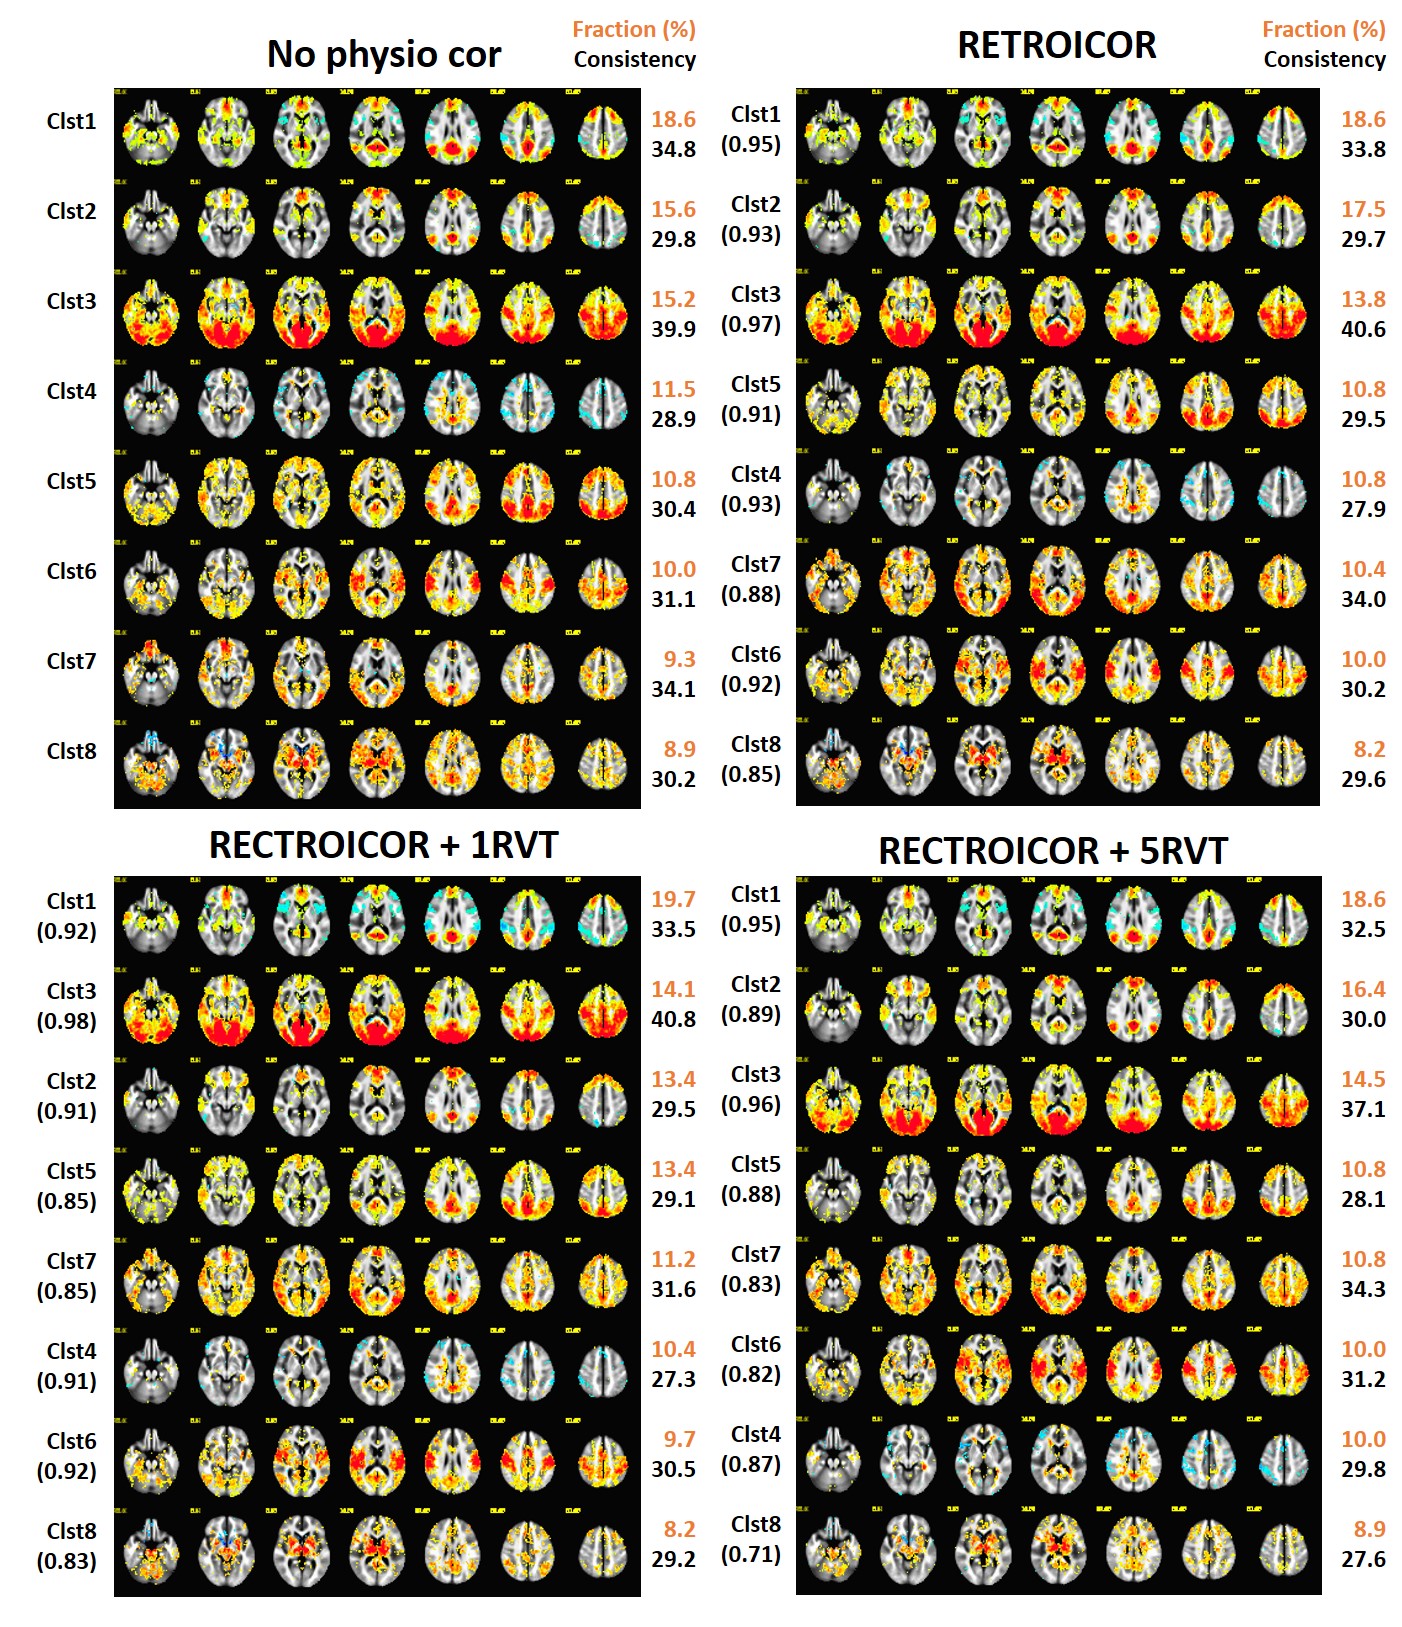
The default mode network was decomposed to 8 CAPs, showing hippocampal and parahippocampal gyrus in clust1, caudate nucleus in clust2, middle frontal gyrus in clust5 while the visual and motor network are observed in clust3 and 6, as shown in Fig2. Fig2 shows 8 CAPs in the physiologic noise-corrected data from the common temporal frame selection. While aslightly different fraction and consistency of each pattern is observed, 8 consistent CAPs from the untreated data are also observed in the physiologic noise-corrected data.
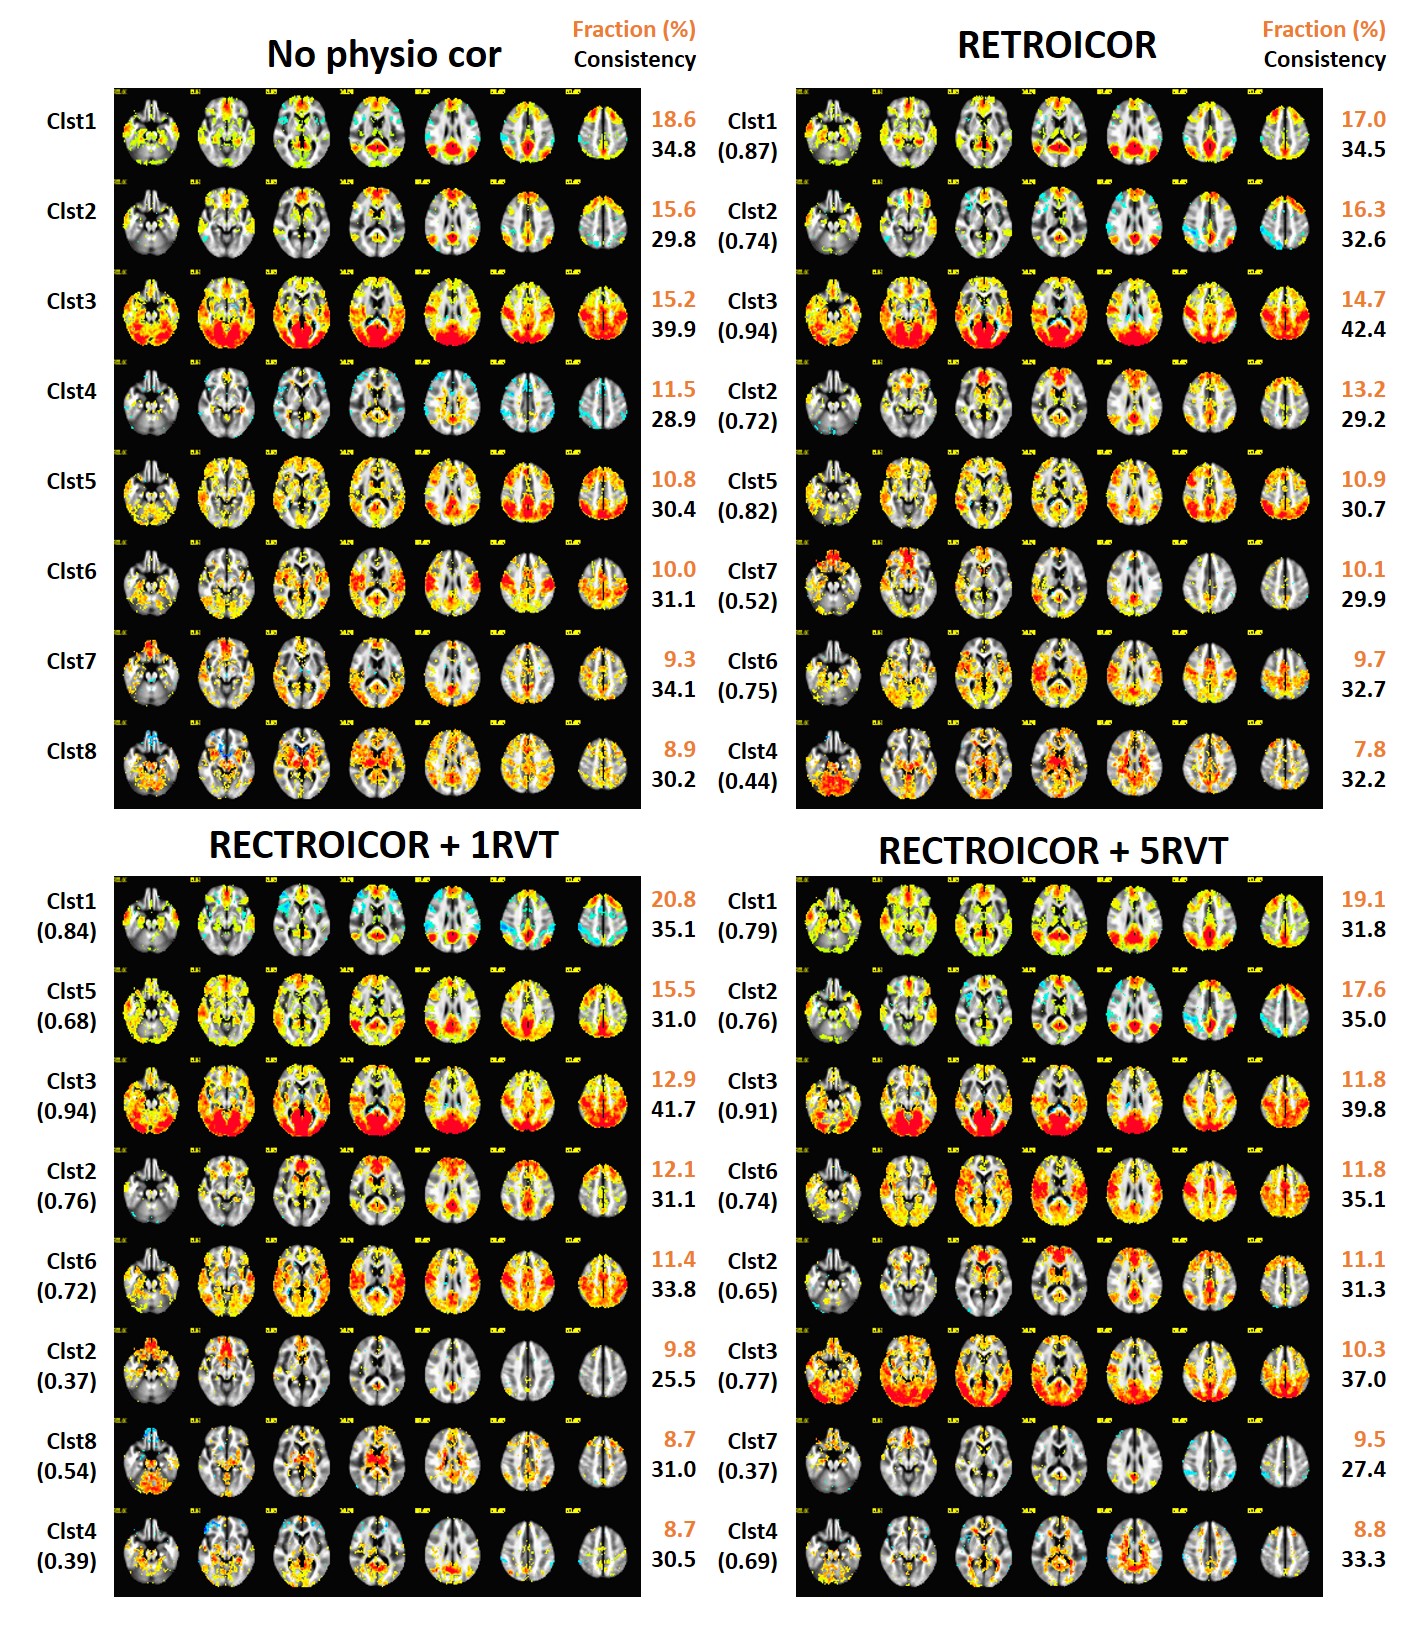
Fig3 presents 8 CAPs in the different physiologic noise-correcteddata from the each temporal frame selection. Clust7 and clust8 from the untreated data were not observed in RETROICOR+1RVT and RETRORICOR data set, respectively. Clust5 and clust8 from the untreated were not found in RETROICOR + 5RVT data set.
Discussion
We found the fraction of Clust3, including the visual and motor sensory regions is reduced from 15.2% in the untreated dataset to 13.8%, 14.1% , and 14.5% in datasets with physio corrections (see Fig2) and the reduction is larger with 14.7%, 12.9% and 11.8% (see Fig3) when top 15% of time frames from the seed signal are independently selected.
The source of the observed reduction in fraction from RETROICOR and RVT(s) procedures could be related to suppression of arousal-related rs-fMRI amplitude changes. When the top 15% data points were selected based on PCC signal, there may be fewer time points that include the arousal-effects after using these physiological correction methods, contributing to differences found with and without physiologic correction.
We observe that the physiologic noise correction makes direct effects on CAP analysis. It is recommended to apply the physiologic noise correction in CAP analysis, but to be cautious of the possible coherence with the measures of interest as the previous study pointed out in rs-fMRI connectivity study (5)
Acknowledgements
Authors appreciate the thoughtful comments from Dr. Jingyuan E. Chen, and acknowledge technical support by Siemens Medical Solutions.References
1. Liu X, Duyn JH. Time-varying functional network information extracted from brief instances of spontaneous brain activity. Proceedings of the National Academy of Sciences of the United States of America. 2013;110(11):4392-7.
2. Chen JE, Chang C, Greicius MD, Glover GH. Introducing co-activation pattern metrics to quantify spontaneous brain network dynamics. Neuroimage. 2015;111:476-88.
3. Wong CW, Olafsson V, Tal O, Liu TT. The amplitude of the resting-state fMRI global signal is related to EEG vigilance measures. Neuroimage. 2013;83:983-90.
4. Chang C, Leopold DA, Scholvinck ML, Mandelkow H, Picchioni D, Liu X, Ye FQ, Turchi JN, Duyn JH. Tracking brain arousal fluctuations with fMRI. Proceedings of the National Academy of Sciences of the United States of America. 2016;113(16):4518-23.
5. Birn RM, Cornejo MD, Molloy EK, Patriat R, Meier TB, Kirk GR, Nair VA, Meyerand ME, Prabhakaran V. The influence of physiological noise correction on test-retest reliability of resting-state functional connectivity. Brain connectivity. 2014;4(7):511-22.
6. Glover GH, Li TQ, Ress D. Image-based method for retrospective correction of physiological motion effects in fMRI: RETROICOR. Magn Reson Med. 2000;44(1):162-7.
7. Birn RM, Diamond JB, Smith MA, Bandettini PA. Separating respiratory-variation-related fluctuations from neuronal-activity-related fluctuations in fMRI. Neuroimage. 2006;31(4):1536-48.
Figures