0915
The Effect of Model-Based and Data-Driven Physiological Noise Correction Techniques on the Degree of Clustering in Resting-State fMRI Functional Connectivity1Graduate Program in Biological and Biomedical Engineering, McGill University, Montreal, QC, Canada, 2Department of Bioengineering, McGill University, Montreal, QC, Canada
Synopsis
One of the most essential steps in the analysis pipeline of fMRI studies is the correction for fluctuations due to physiological processes and head motion. This is particularly relevant for resting-state fMRI functional connectivity (FC) studies, where the SNR is lower and physiological fluctuations may introduce common variance in the signals from different areas of the brain, inflating FC. Several physiological noise correction techniques have been developed over the years. Nevertheless, an optimal preprocessing pipeline for FC has not yet been established. In this study, we examined more than 400 different pipelines using both model-based and data-driven techniques and have found that tissue-based regressors significantly improve the identifiability of well-known resting-state networks.
INTRODUCTION
Functional magnetic resonance imaging (fMRI) is widely viewed as the gold standard for studying brain function due to its high spatial resolution and non-invasive nature. However, confounding factors arising from head motion and physiological processes should be taken into consideration when analyzing and interpreting the results1. It is well established that spontaneous fluctuations in physiological processes, such as cardiac and respiratory activity, account for significant variance in the BOLD signal arising through different mechanisms and that they also have considerable impact on resting-state fMRI functional connectivity (FC) as well as dynamic functional connectivity studies2-3. Therefore, several physiological noise correction (PNC) techniques have been developed to remove the effects of motion and physiological factors from fMRI data.
PNC techniques can be categorized into two classes: 1) model-based techniques that utilize concurrent physiological measurements4-5, and 2) data-driven approaches that employ the fMRI data only6-7. Typically, a combination of techniques is employed during the preprocessing stage to account for several sources of noise. While many recent studies have examined the effect of different preprocessing pipelines on FC8-10, there is still no consensus on the optimal preprocessing strategy, possibly due to that each of these studies considered a different set of PNC techniques using different metrics to assess their performance and, thus, a comparison between pipelines examined in different studies cannot easily be done.
In the present study, we compare a range of different strategies for PNC including both model-based and data-driven techniques and propose two new metrics for assessing the quality of data for FC analysis based on the ability of identifying well-known resting-state networks (RSNs) at the subject level.
METHODS
Resting-state fMRI data from the Human Connectome Project (HCP11; 173 scans from 45 subjects; TR=0.72s; 15 min per scan) were used. The minimally-preprocessed data and data corrected for noise with FIX7 were transformed to the MIST_444 parcellation12 before any further preprocessing.
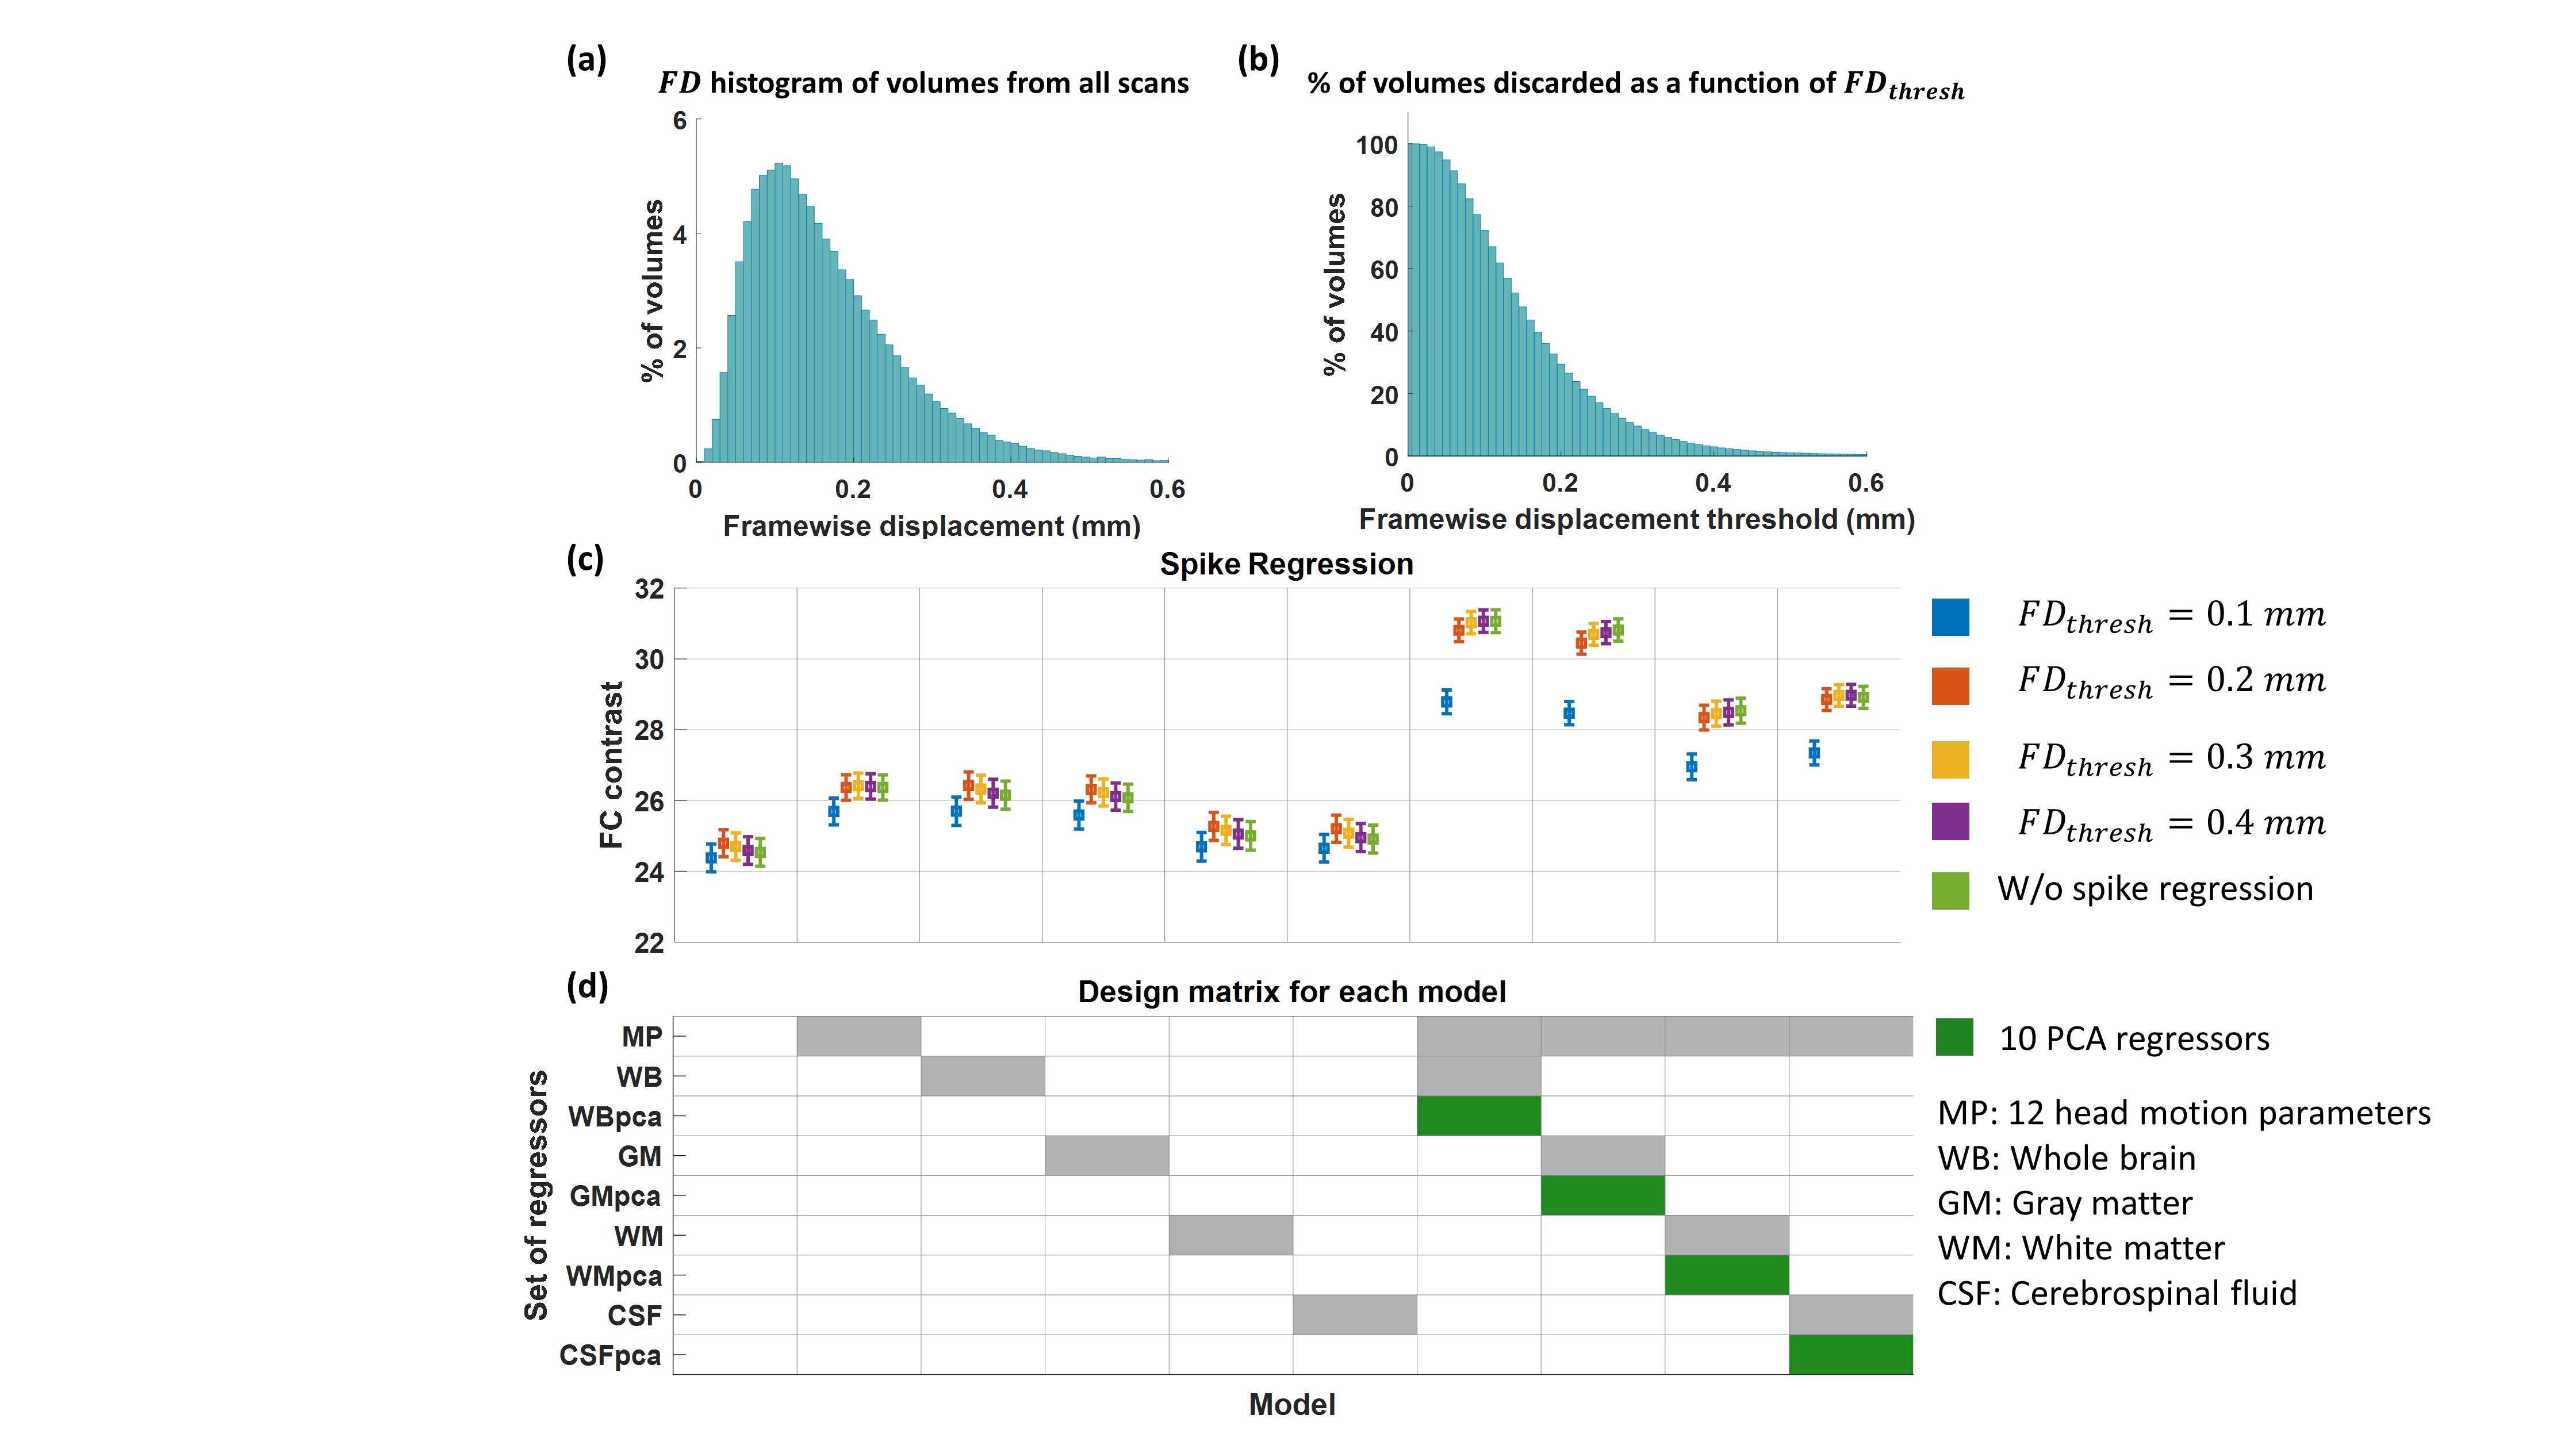
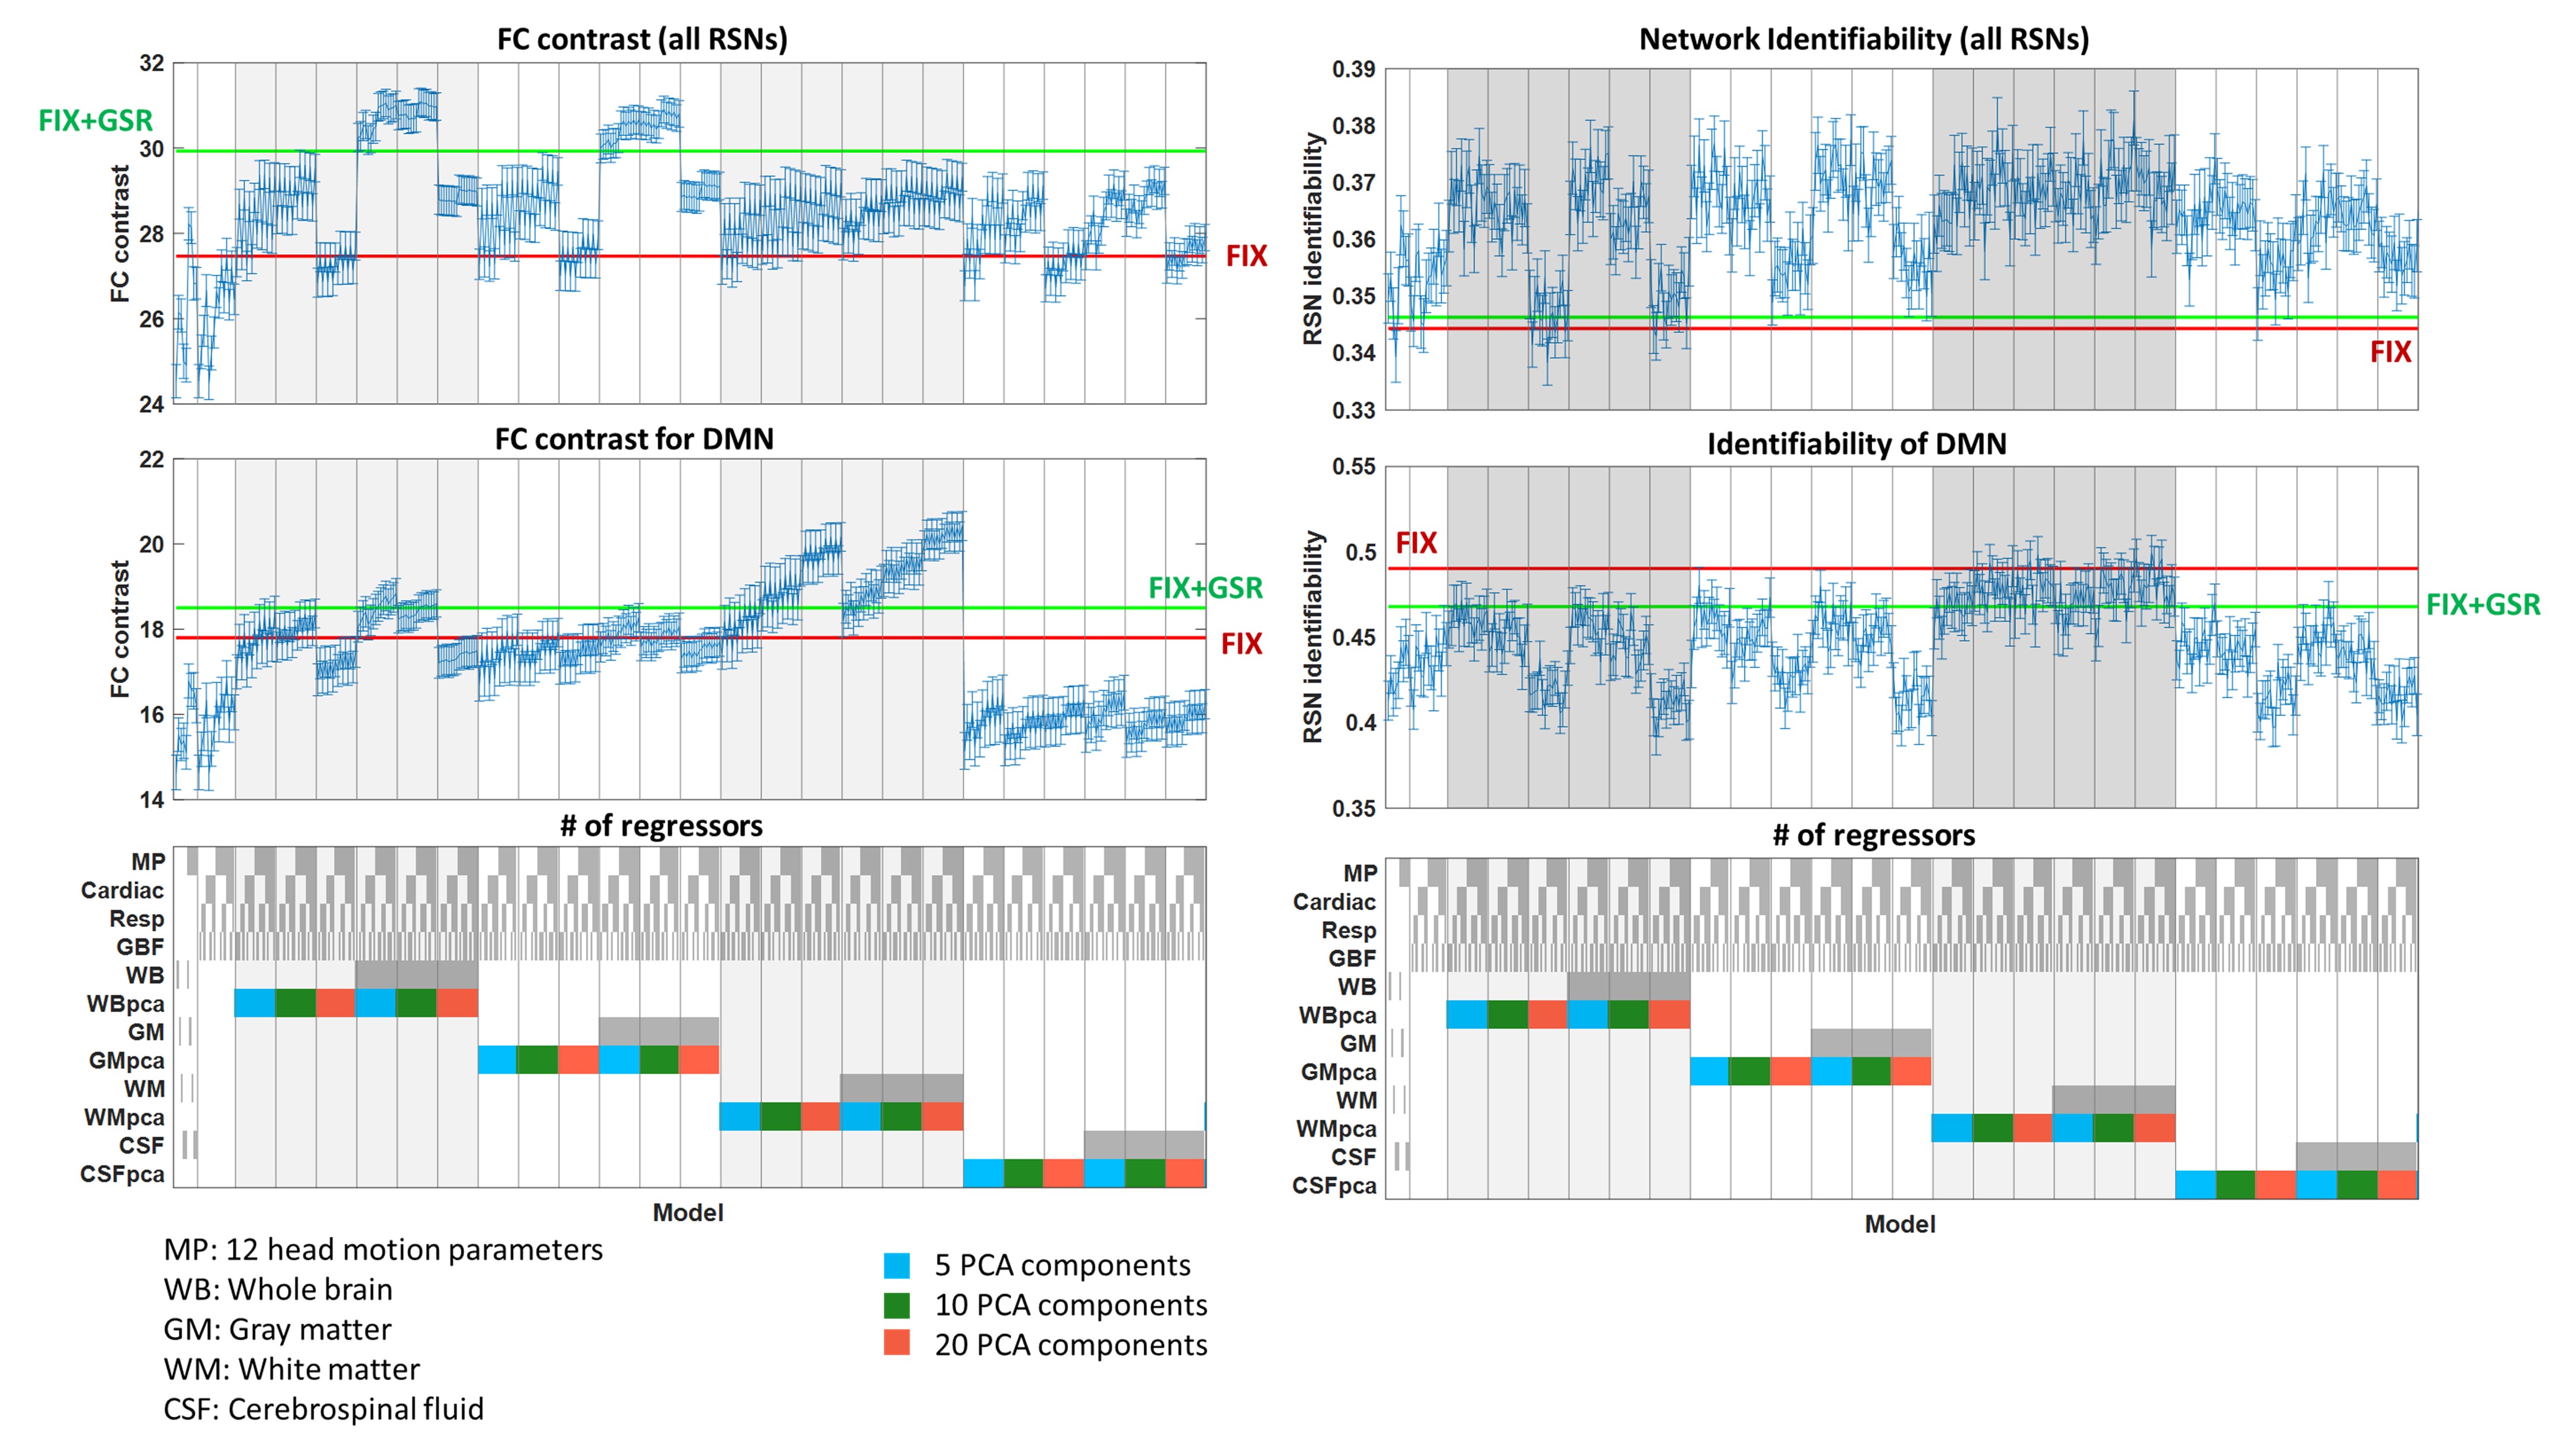
We examined more than 400 pipelines, which consisted of combinations of model-based and data-driven techniques (Fig. 3). The former included cardiac and respiratory-related RETROICOR4, and global blood flow (GBF)-based methods using our recently developed cardiac and respiration response functions5. The latter included methods based head motion parameters, scrubbing of bad volumes based on framewise displacement (FD)13, FIX7 and tissue-based regressors using mean timeseries and principal component analysis (PCA)6. The regressor combinations can be seen in Fig. 3.
To assess the quality of the data after a specific preprocessing pipeline, the functional connectivity matrix (FCM) of each subject was calculated based on Pearson’s correlation coefficient and the degree of clustering was quantified using the following novel two metrics:
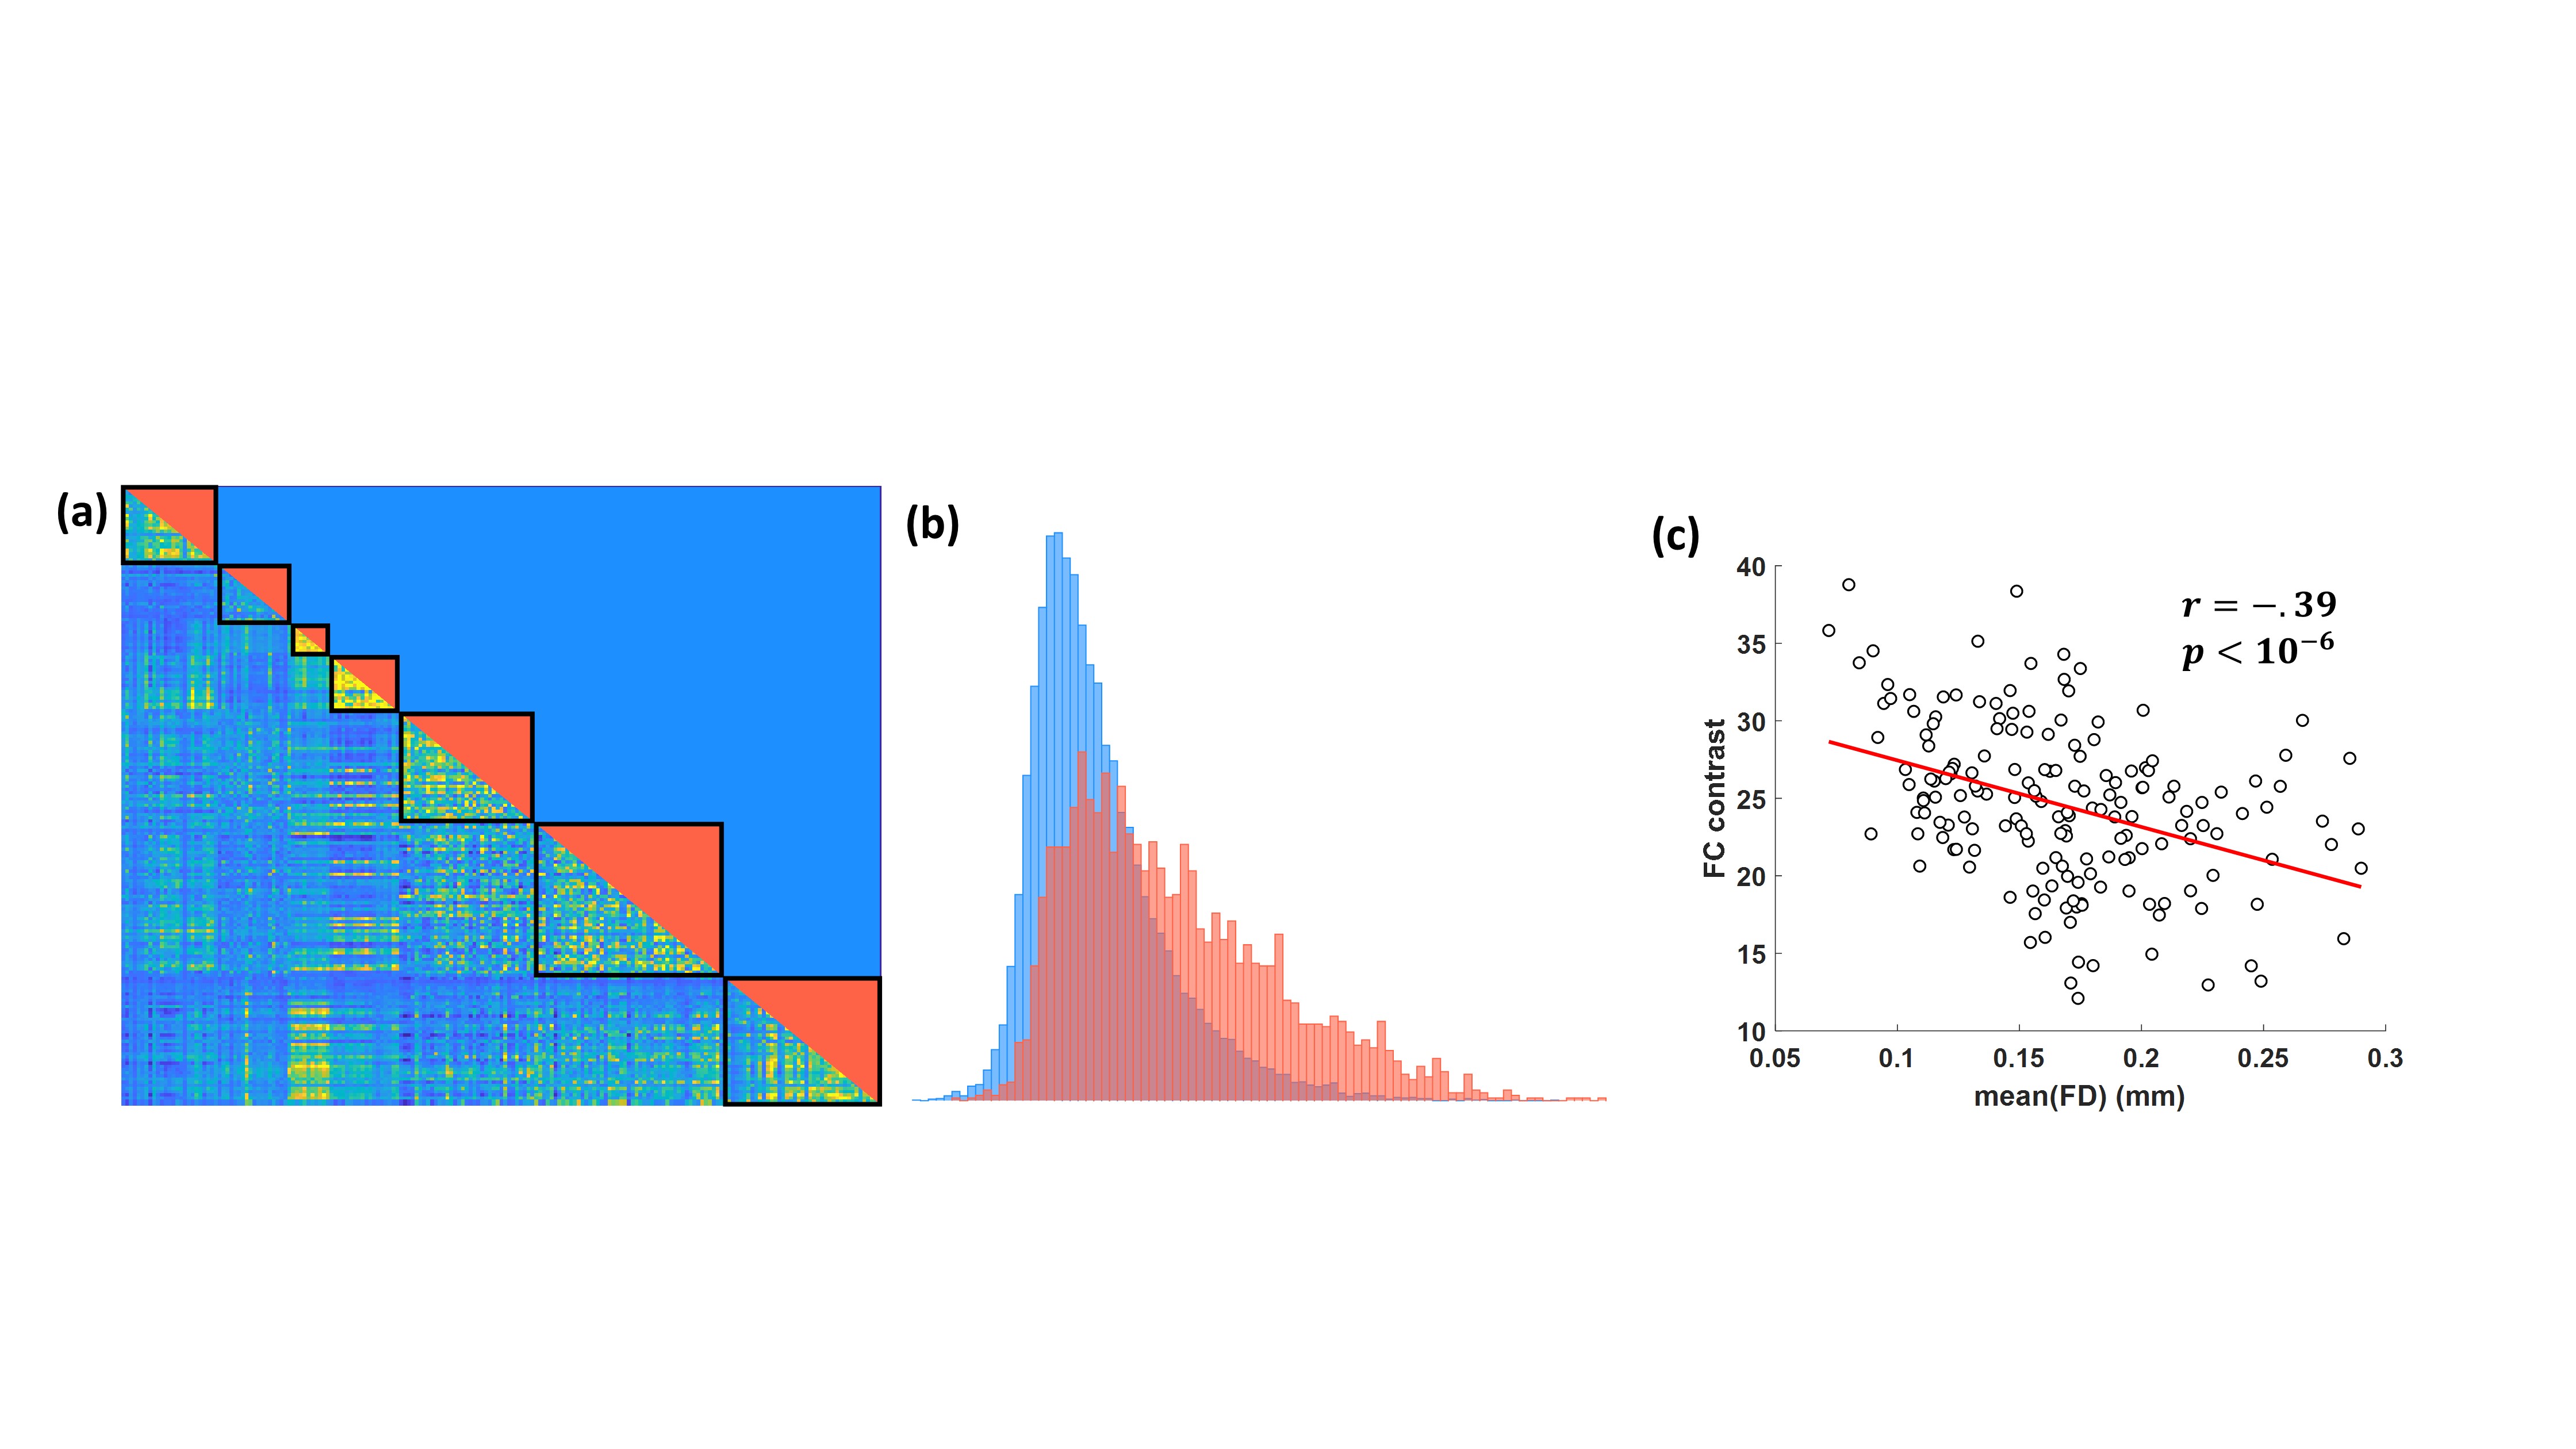
- The FC contrast (FCC) based on the Wilcoxon signed-rank test. The MIST parcellation provides a pseudo-hierarchical decomposition tree that relates each of the 444 parcels in MIST_444 to one of the seven RSNs in MIST_7. Based on this hierarchy, we categorized all the unique pairs of parcels in the obtained FCMs to significant and non-significant pairs depending on whether they belong to the same RSN or not. For a given FCM, FCC is defined as the Wilcoxon rank sum statistic for the two samples corresponding to the significant and non-significant pairs (Fig. 1).
- Network identifiability (NI) based on k-means clustering. Parcels were mapped in space using principal coordinate analysis of the FCMs, before being grouped in seven clusters through k-means clustering. Subsequently, the clusters were associated with the 7 RSNs of the MIST_7 parcellation and the spatial (dice) correlation was calculated for each pair of network-cluster.
RESULTS
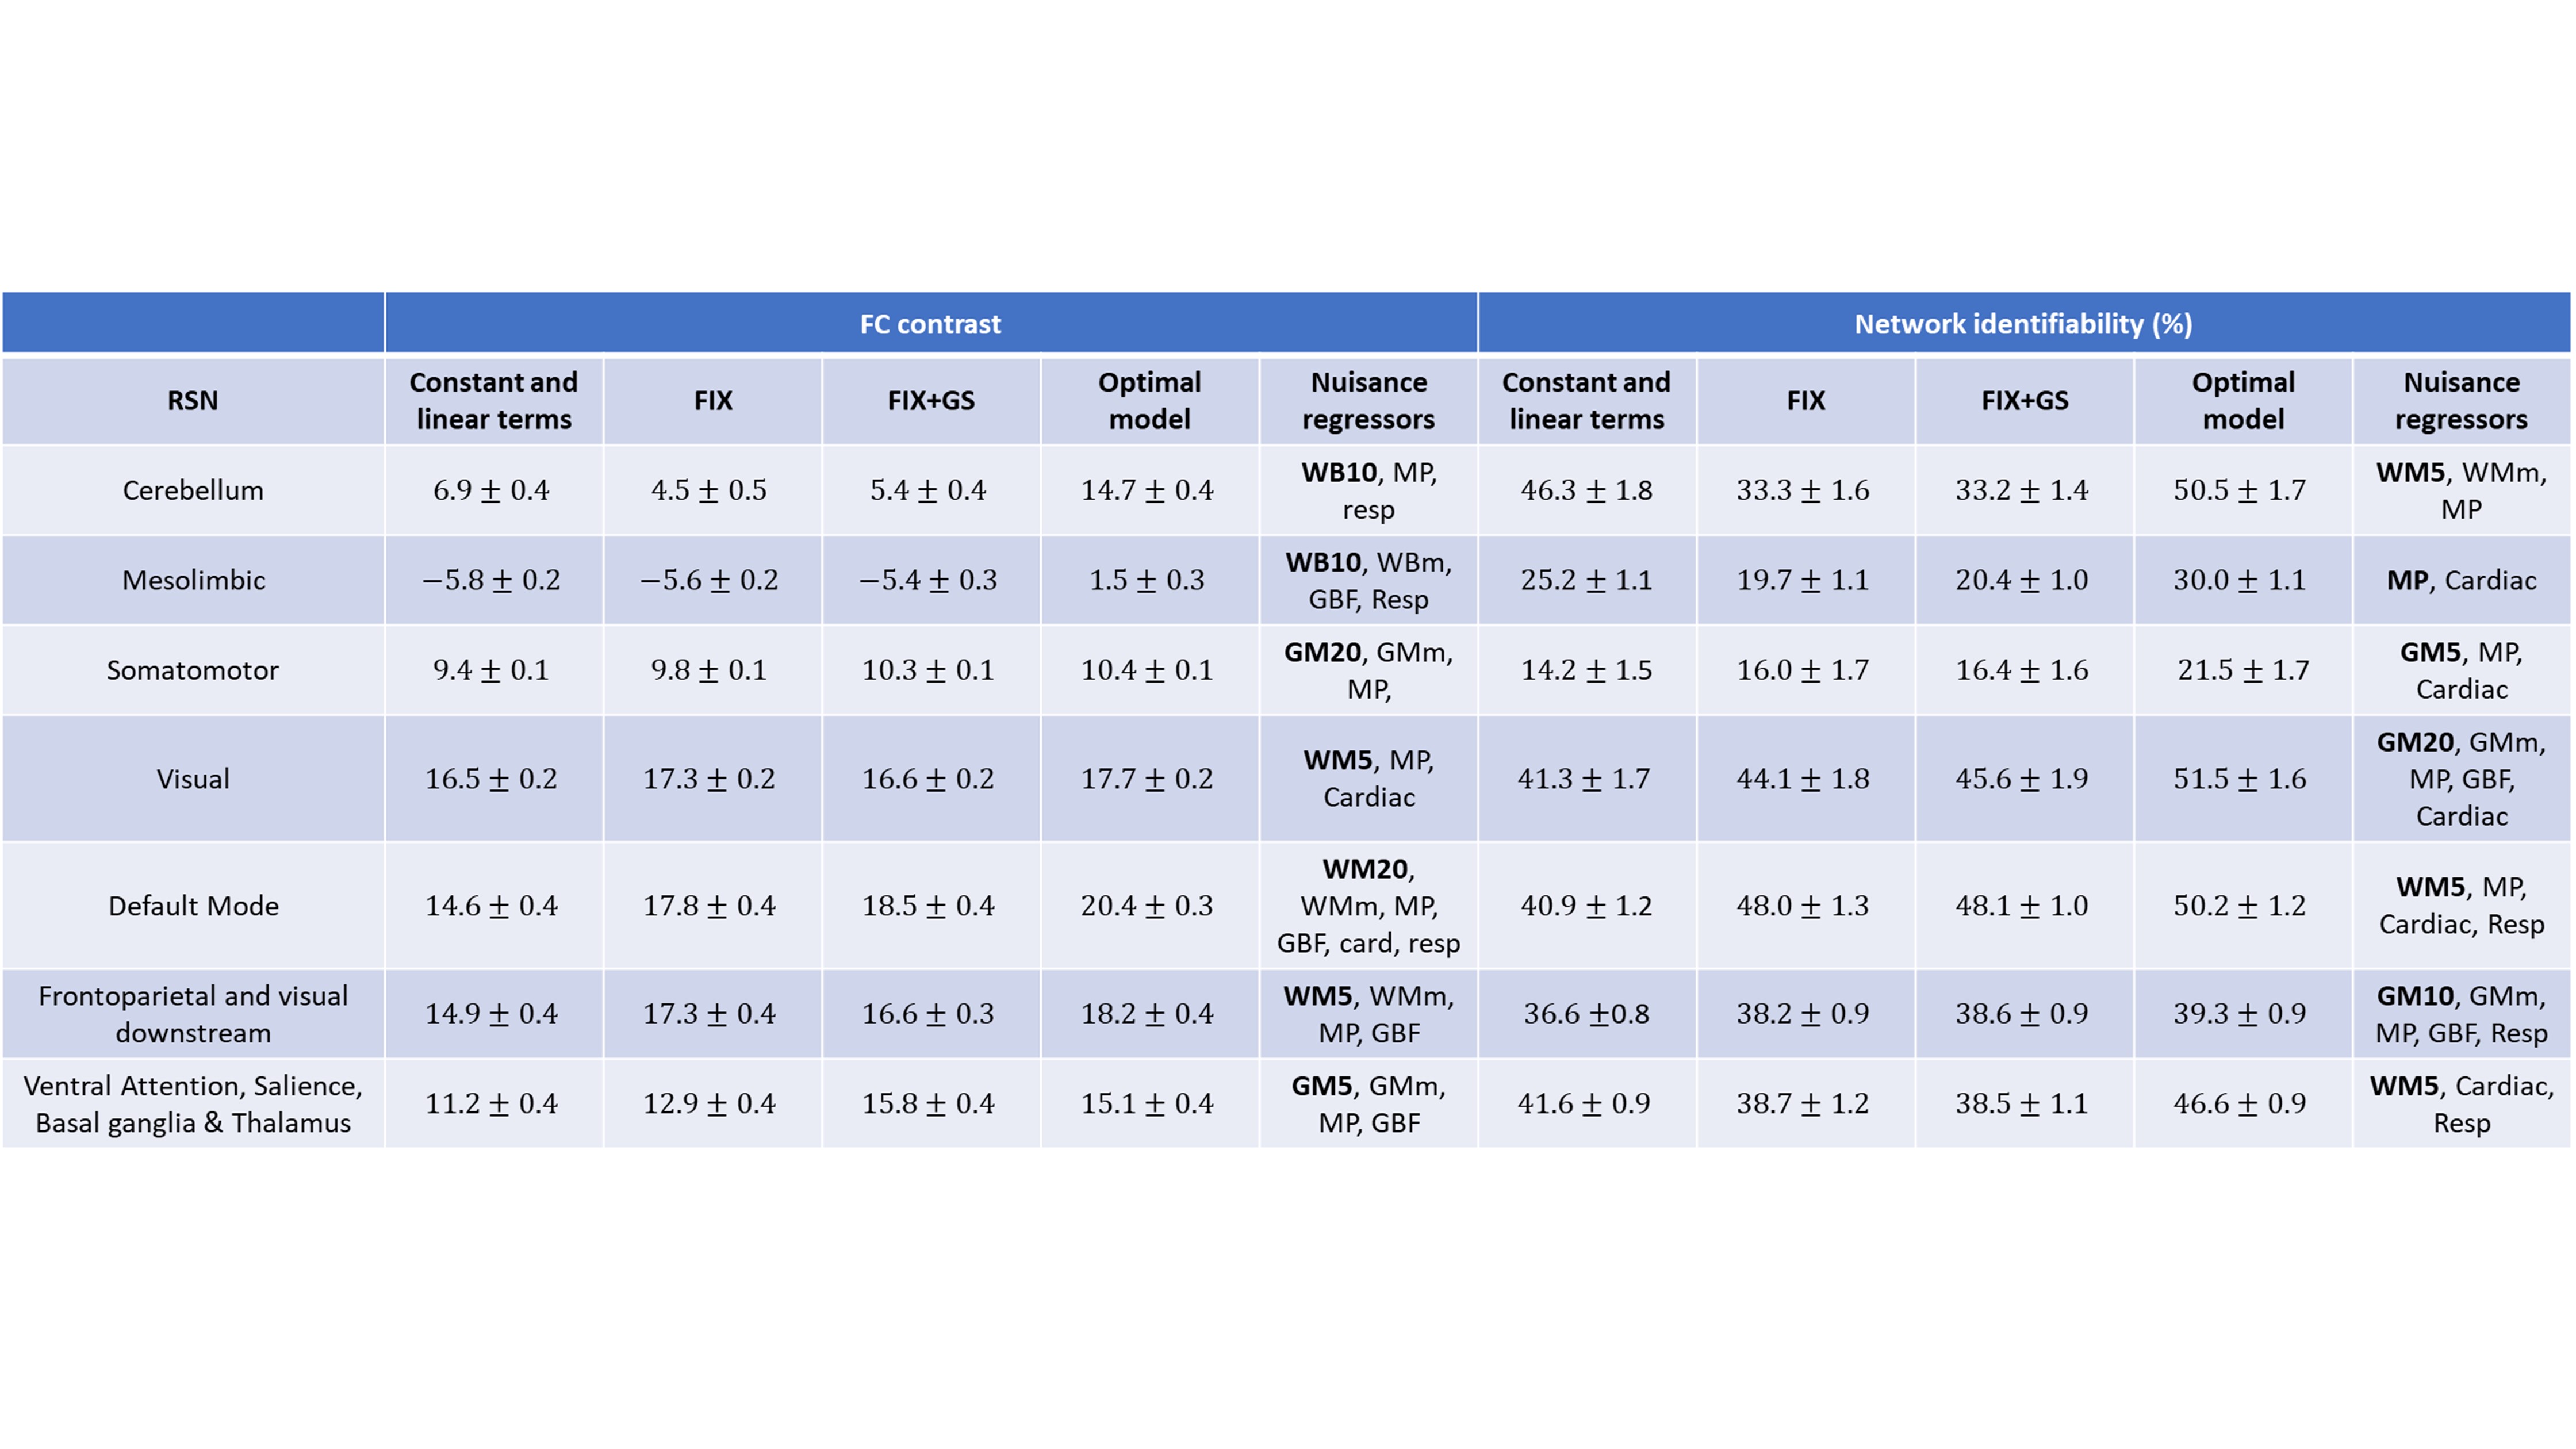
Fig. 2 shows that the FCC is higher when PCA tissue-based regressors were used and no scrubbing was applied for bad volumes. Moreover, in Fig. 3 we observe that the PCA regressors and, to a less extent, the mean timeseries from brain tissue types, including the whole-brain mean timeseries (also termed global signal), yielded the largest improvement in FCC and NI. However, we did not identify an optimal preprocessing pipeline that yielded the highest identifiability for all RSNs (Table 1). Importantly, regressors obtained from physiological data had a considerably smaller effect on NI, particularly when tissue-based regressors were included in the preprocessing. Furthermore, many of the examined preprocessing pipelines which consisted of a small number of tissue-based regressors performed better than FIX, which was the method of choice for noise correction in the HCP.DISCUSSION & CONCLUSION
Tissue-based regressors, derived either by using PCA or calculating the mean signal in a brain tissue type, outperformed model-based techniques in improving the identifiability of RSNs. However, further work is needed to identify the tissue type from which the regressors should be derived from and a systematic procedure for selecting the PCA components to be regressed out.Acknowledgements
This work was supported by the Fonds Recherche Nature et Technologies Quebec (Team Grant awarded to GDM), the Natural Sciences and Engineering Research Council of Canada (Discovery Grant awarded to GDM) and the Canada First Research Excellence Fund (awarded to McGill University for the Healthy Brains for Healthy Lives initiative). MK acknowledges funding from Québec Bio-imaging Network (QBIN).References
[1] R. M. Birn, “The role of physiological noise in resting-state functional connectivity,” Neuroimage, vol. 62, no. 2, pp. 864–870, 2012.
[2] R. M. Hutchison, T. Womelsdorf, E. a. Allen, P. a. Bandettini, V. D. Calhoun, M. Corbetta, S. Della Penna, J. H. Duyn, G. H. Glover, J. Gonzalez-Castillo, D. a. Handwerker, S. Keilholz, V. Kiviniemi, D. a. Leopold, F. de Pasquale, O. Sporns, M. Walter, and C. Chang, “Dynamic functional connectivity: promise, issues, and interpretations.,” Neuroimage, vol. 80, pp. 360–78, Oct. 2013.
[3] F. Nikolaou, C. Orphanidou, P. Papakyriakou, K. Murphy, R. G. Wise, and G. D. Mitsis, “Spontaneous physiological variability modulates dynamic functional connectivity in resting-state functional magnetic resonance imaging.,” Philos. Trans. A. Math. Phys. Eng. Sci., vol. 374, no. 2067, p. 20150183-, 2016.
[4] G. H. Glover, T. Q. Li, and D. Ress, “Image-based method for retrospective correction of physiological motion effects in fMRI: RETROICOR,” Magn. Reson. Med., vol. 44, no. 1, pp. 162–167, 2000.
[5] M. Kassinopoulos and G. D. Mitsis, “Exploiting the physiological properties of the global signal to correct for fluctuations in BOLD fMRI induced by heart rate and respiratory variations,” Joint Annual Meeting ISMRM-ESMRMB 2018.
[6] J. Muschelli, M. B. Nebel, B. S. Caffo, A. D. Barber, J. J. Pekar, and S. H. Mostofsky, “Reduction of motion-related artifacts in resting state fMRI using aCompCor,” Neuroimage, vol. 96, pp. 22–35, 2014.
[7] G. Salimi-Khorshidi, G. Douaud, C. F. Beckmann, M. F. Glasser, L. Griffanti, and S. M. Smith, “Automatic denoising of functional MRI data: Combining independent component analysis and hierarchical fusion of classifiers,” Neuroimage, vol. 90, pp. 449–468, 2014.
[8] R. M. Birn, M. D. Cornejo, E. K. Molloy, R. Patriat, T. B. Meier, G. R. Kirk, V. A. Nair, M. E. Meyerand, and V. Prabhakaran, “The Influence of Physiological Noise Correction on Test–Retest Reliability of Resting-State Functional Connectivity,” Brain Connect., vol. 4, no. 7, pp. 511–522, Sep. 2014.
[9] S. Zhu, Z. Fang, S. Hu, Z. Wang, and H. Rao, “Resting State Brain Function Analysis Using Concurrent BOLD in ASL Perfusion fMRI,” PLoS One, vol. 8, no. 6, p. e65884, Jun. 2013.
[10] L. Parkes, B. Fulcher, M. Yücel, and A. Fornito, “An evaluation of the efficacy, reliability, and sensitivity of motion correction strategies for resting-state functional MRI,” Neuroimage, vol. 171, no. July 2017, pp. 415–436, 2018.
[11] D. C. Van Essen, S. M. Smith, D. M. Barch, T. E. J. Behrens, E. Yacoub, and K. Ugurbil, “The WU-Minn Human Connectome Project: An overview,” Neuroimage, vol. 80, pp. 62–79, 2013.
[12] S. Urchs, J. Armoza, Y. Benhajali, J. St-Aubin, P. Orban, and P. Bellec, “MIST: A multi-resolution parcellation of functional brain networks,” MNI Open Res., vol. 1, no. 0, p. 3, 2017.
[13] J. D. Power, K. A. Barnes, A. Z. Snyder, B. L. Schlaggar, and S. E. Petersen, “Spurious but systematic correlations in functional connectivity MRI networks arise from subject motion,” Neuroimage, vol. 59, no. 3, pp. 2142–2154, 2012.
Figures