0914
Effect of physiological correction on residual motion in resting-state fMRI1Rotman Research Institute, University of Toronto, Toronto, ON, Canada, 2Medical biophysics, University of Toronto, Toronto, ON, Canada
Synopsis
There remain significant residual motion effects in the resting-state fMRI signal after motion correction, motion censoring, and motion regression. Due to the residual motion in the BOLD signal, use of data-driven nuisance regressors for physiological noise correction can potentially be effective in removing the residual motion. The aim of the current study is to investigate the effect of different regressors on residual motion. Our data show that the residual motion is removed by aCompCor and GSR. We recommend the output of the preprocessing pipelines be correlated against framewise motion to ensure any residual motion is removed prior to subsequent analysis.
Introduction
In a study of physiological correction for resting-state fMRI (rs-fMRI) connectivity we found that there remain significant residual motion effects in the BOLD signal after preprocessing using motion correction and motion censoring. A variety of data-driven physiological correction techniques derive nuisance regressors from the BOLD signal. Since there remains significant residual motion in the BOLD signal, use of nuisance regressors for physiological noise correction can potentially be effective in removing the residual motion. The aim of the current study is to investigate the effect of different regressors on the residual motion.Methods
Data acquisition
Fifteen healthy volunteers were scanned using a Siemens TIM Trio 3T scanner (Erlangen, Germany) using a resting-state GE-EPI sequence limiting the acquisition to 7 oblique axial slices over the bilateral sensorimotor areas (TR=323ms). External cardiac and respiratory signals were recorded. Written consent was obtained according to institutional ethics.
Preprocessing
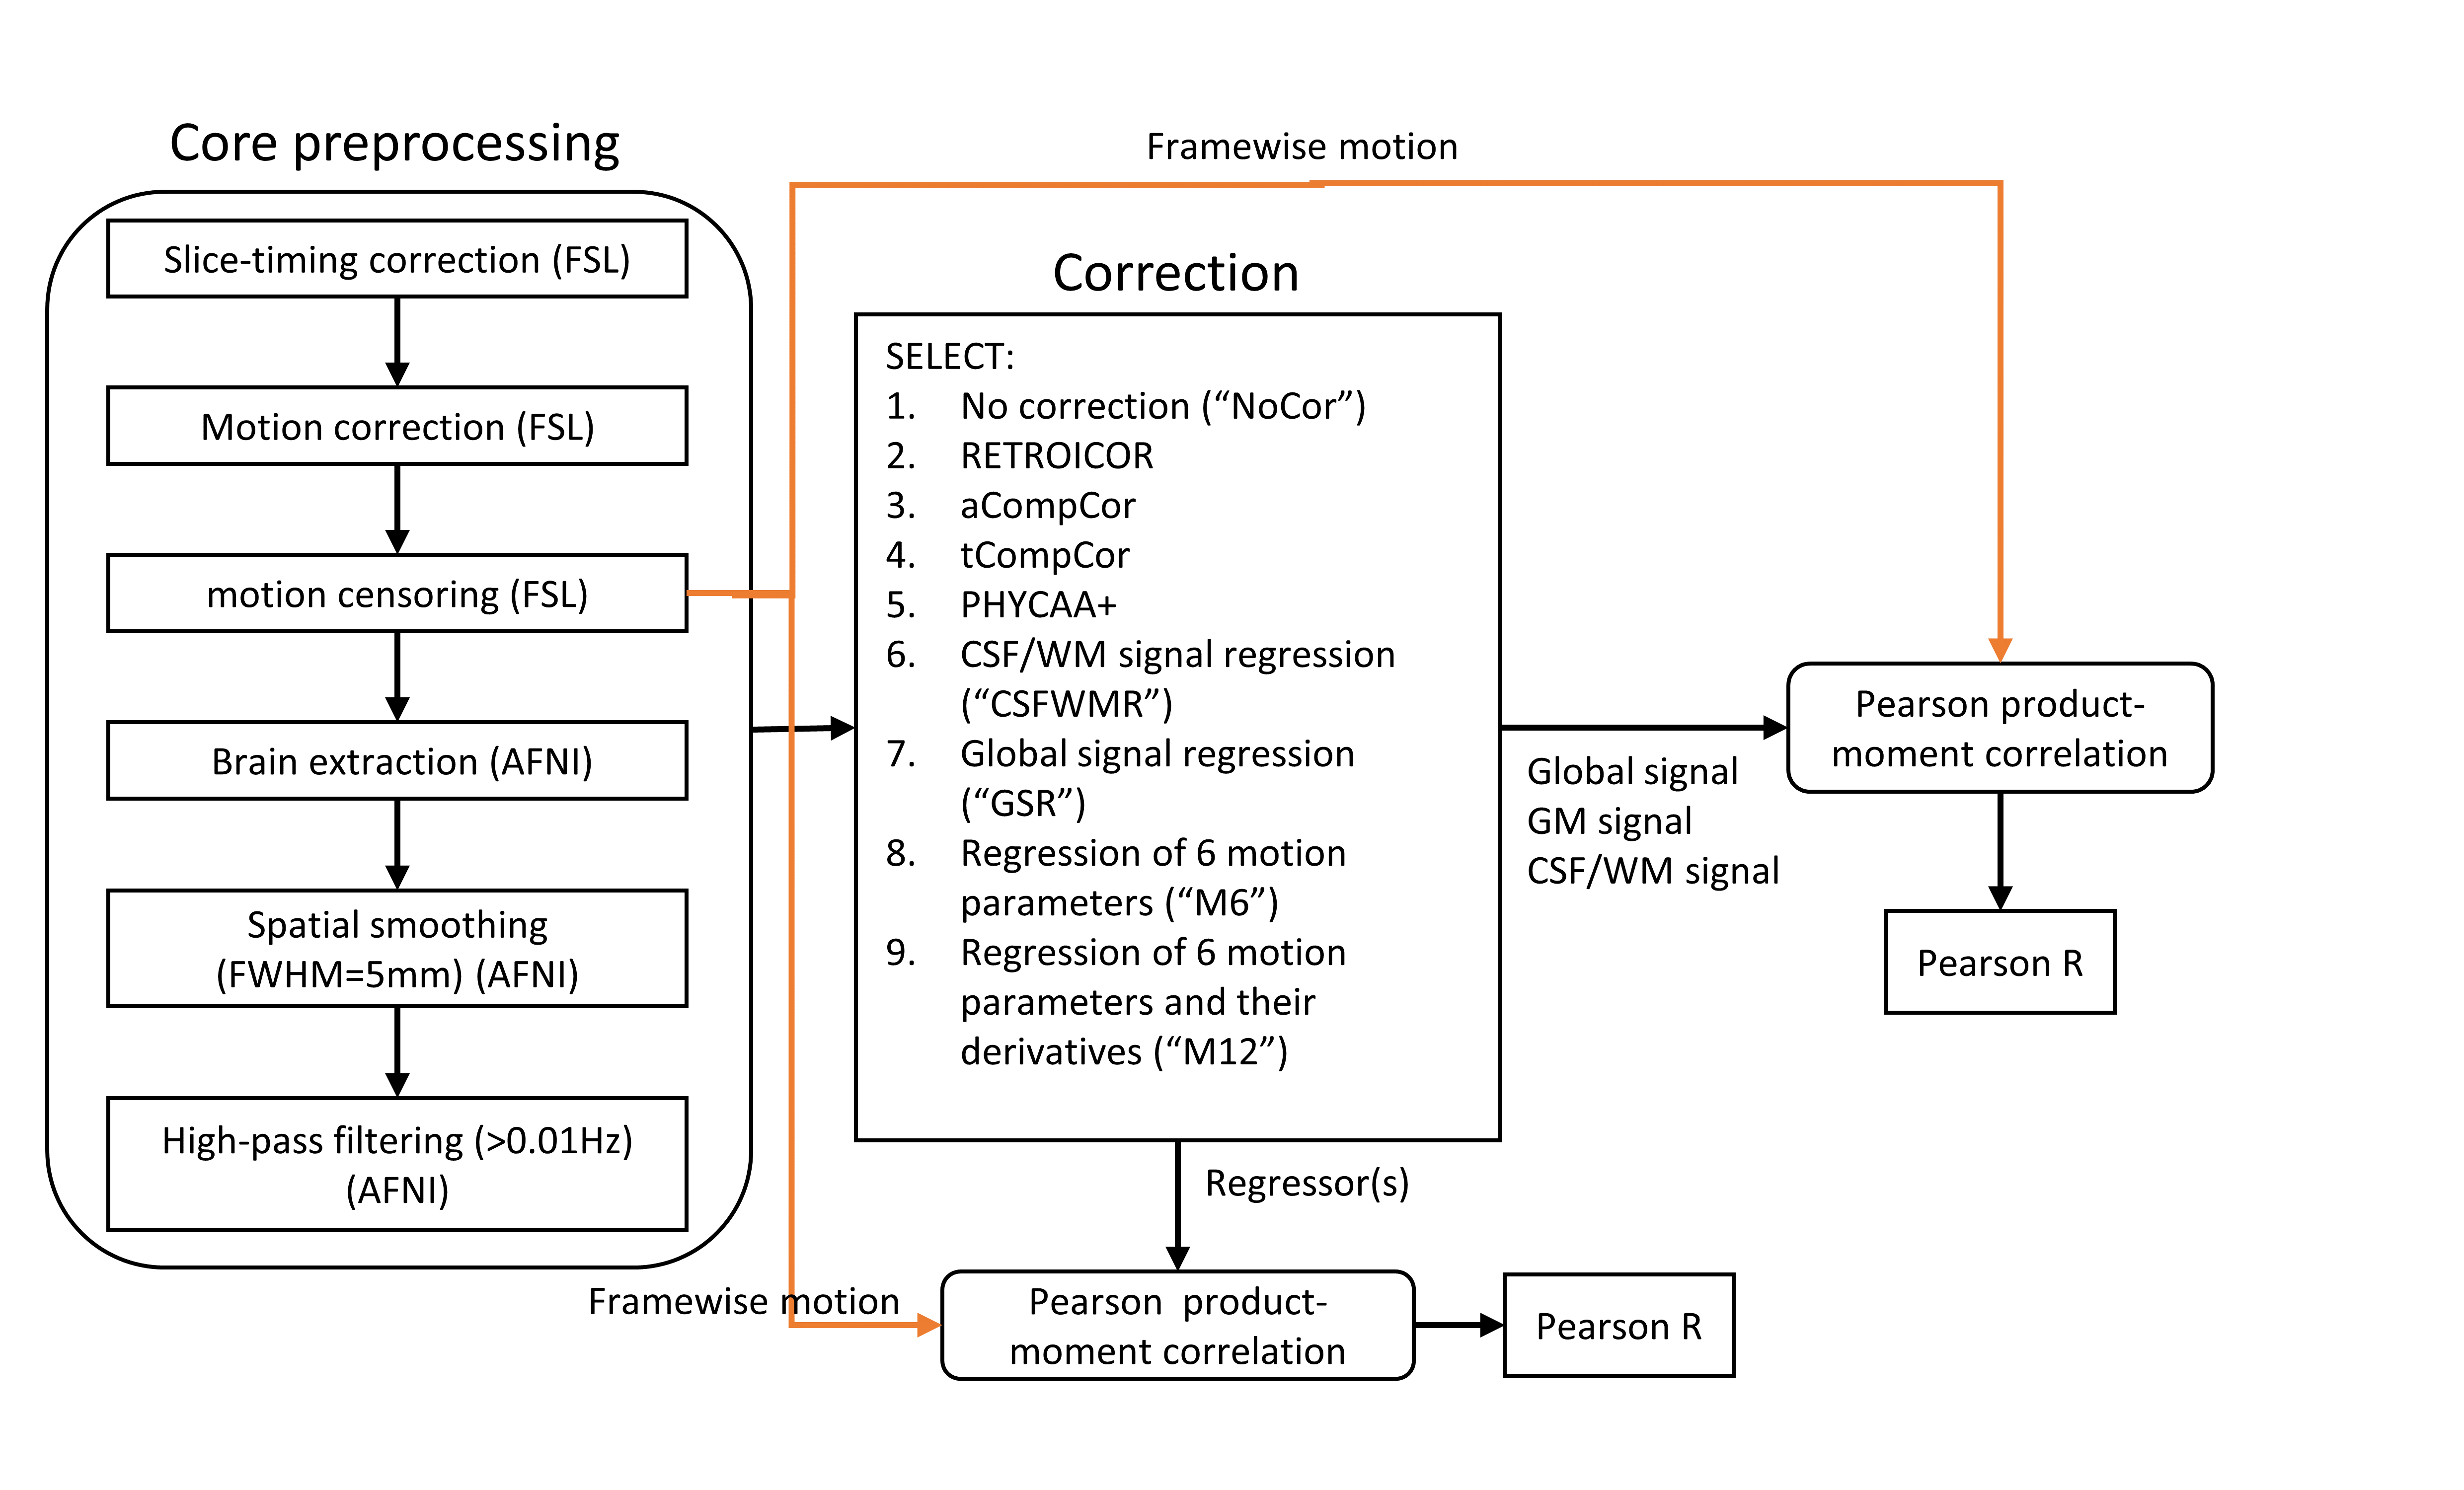
rs-fMRI preprocessing involved core preprocessing followed by different correction methods, amounting to a total of nine pipelines including no correction (“NoCor”), RETROICOR1, aCompCor2, tCompCor2, PHYCAA+3, CSF-WM regression (“CSFWMR”)4–8, global signal regression (“GSR”)9–11, regression of six rigid-body motion parameters ("M6R"), and regression of the six rigid-body motion parameters and their derivatives ("M12R"), as outlined in Fig.1.
Motion-related analysis
Framewise motion was quantified using FSL tool fsl_motion_outliers based on the RMS intensity difference to the reference middle volume (REFRMS)12. The relation between framewise motion and "regressors" and the mean gray matter (GM) and the mean CSF-WM signals was quantified for each subject using Pearson correlation. Significance of findings was assessed by bootstrapping.
Results
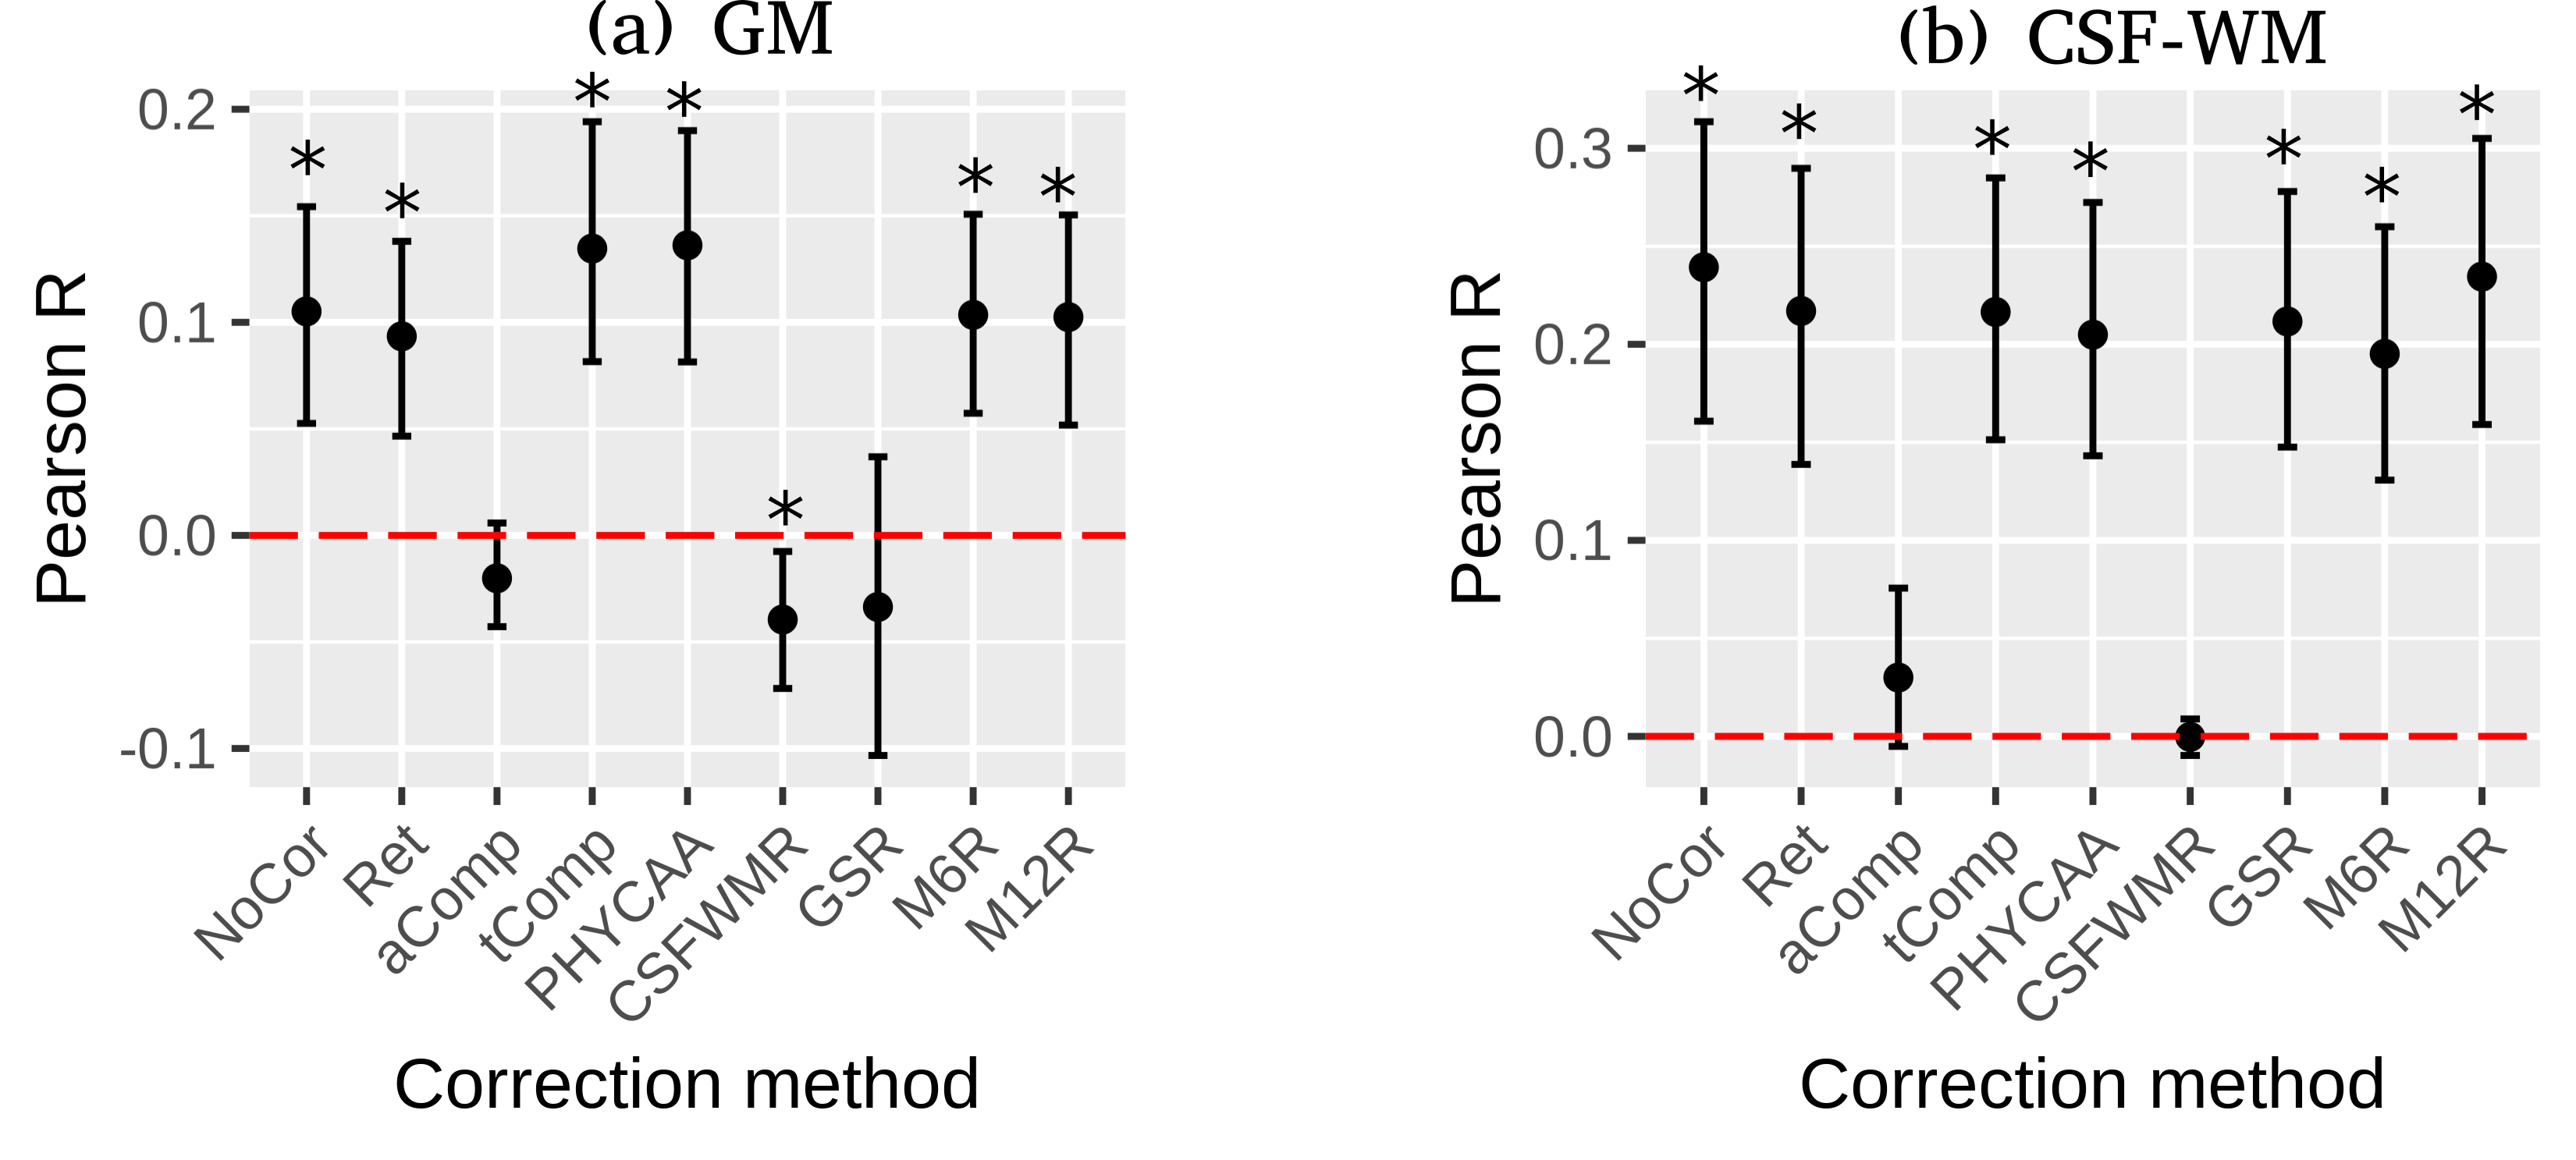
Bootstrapped confidence intervals suggest there remains significant positive correlation between the mean GM signal and REFRMS after RETROICOR, tCompCor, PHYCAA+, CSFWMR, M6R, and M12R (Fig.2(a)). Lack of significant correlation between the mean GM signal and REFRMS after aCompcor (95%-CI=[-0.043,0.0059]), and GSR (95%-CI=[-0.10,0.037]) suggest that these corrections can remove the residual motion in GM. CSFWMR, on the other hand, results in significant negative correlation between the mean GM signal and REFRMS (Fig.2(a)). Moreover, GSR does not remove framewise motion in CSF-WM (Fig.2(b)).
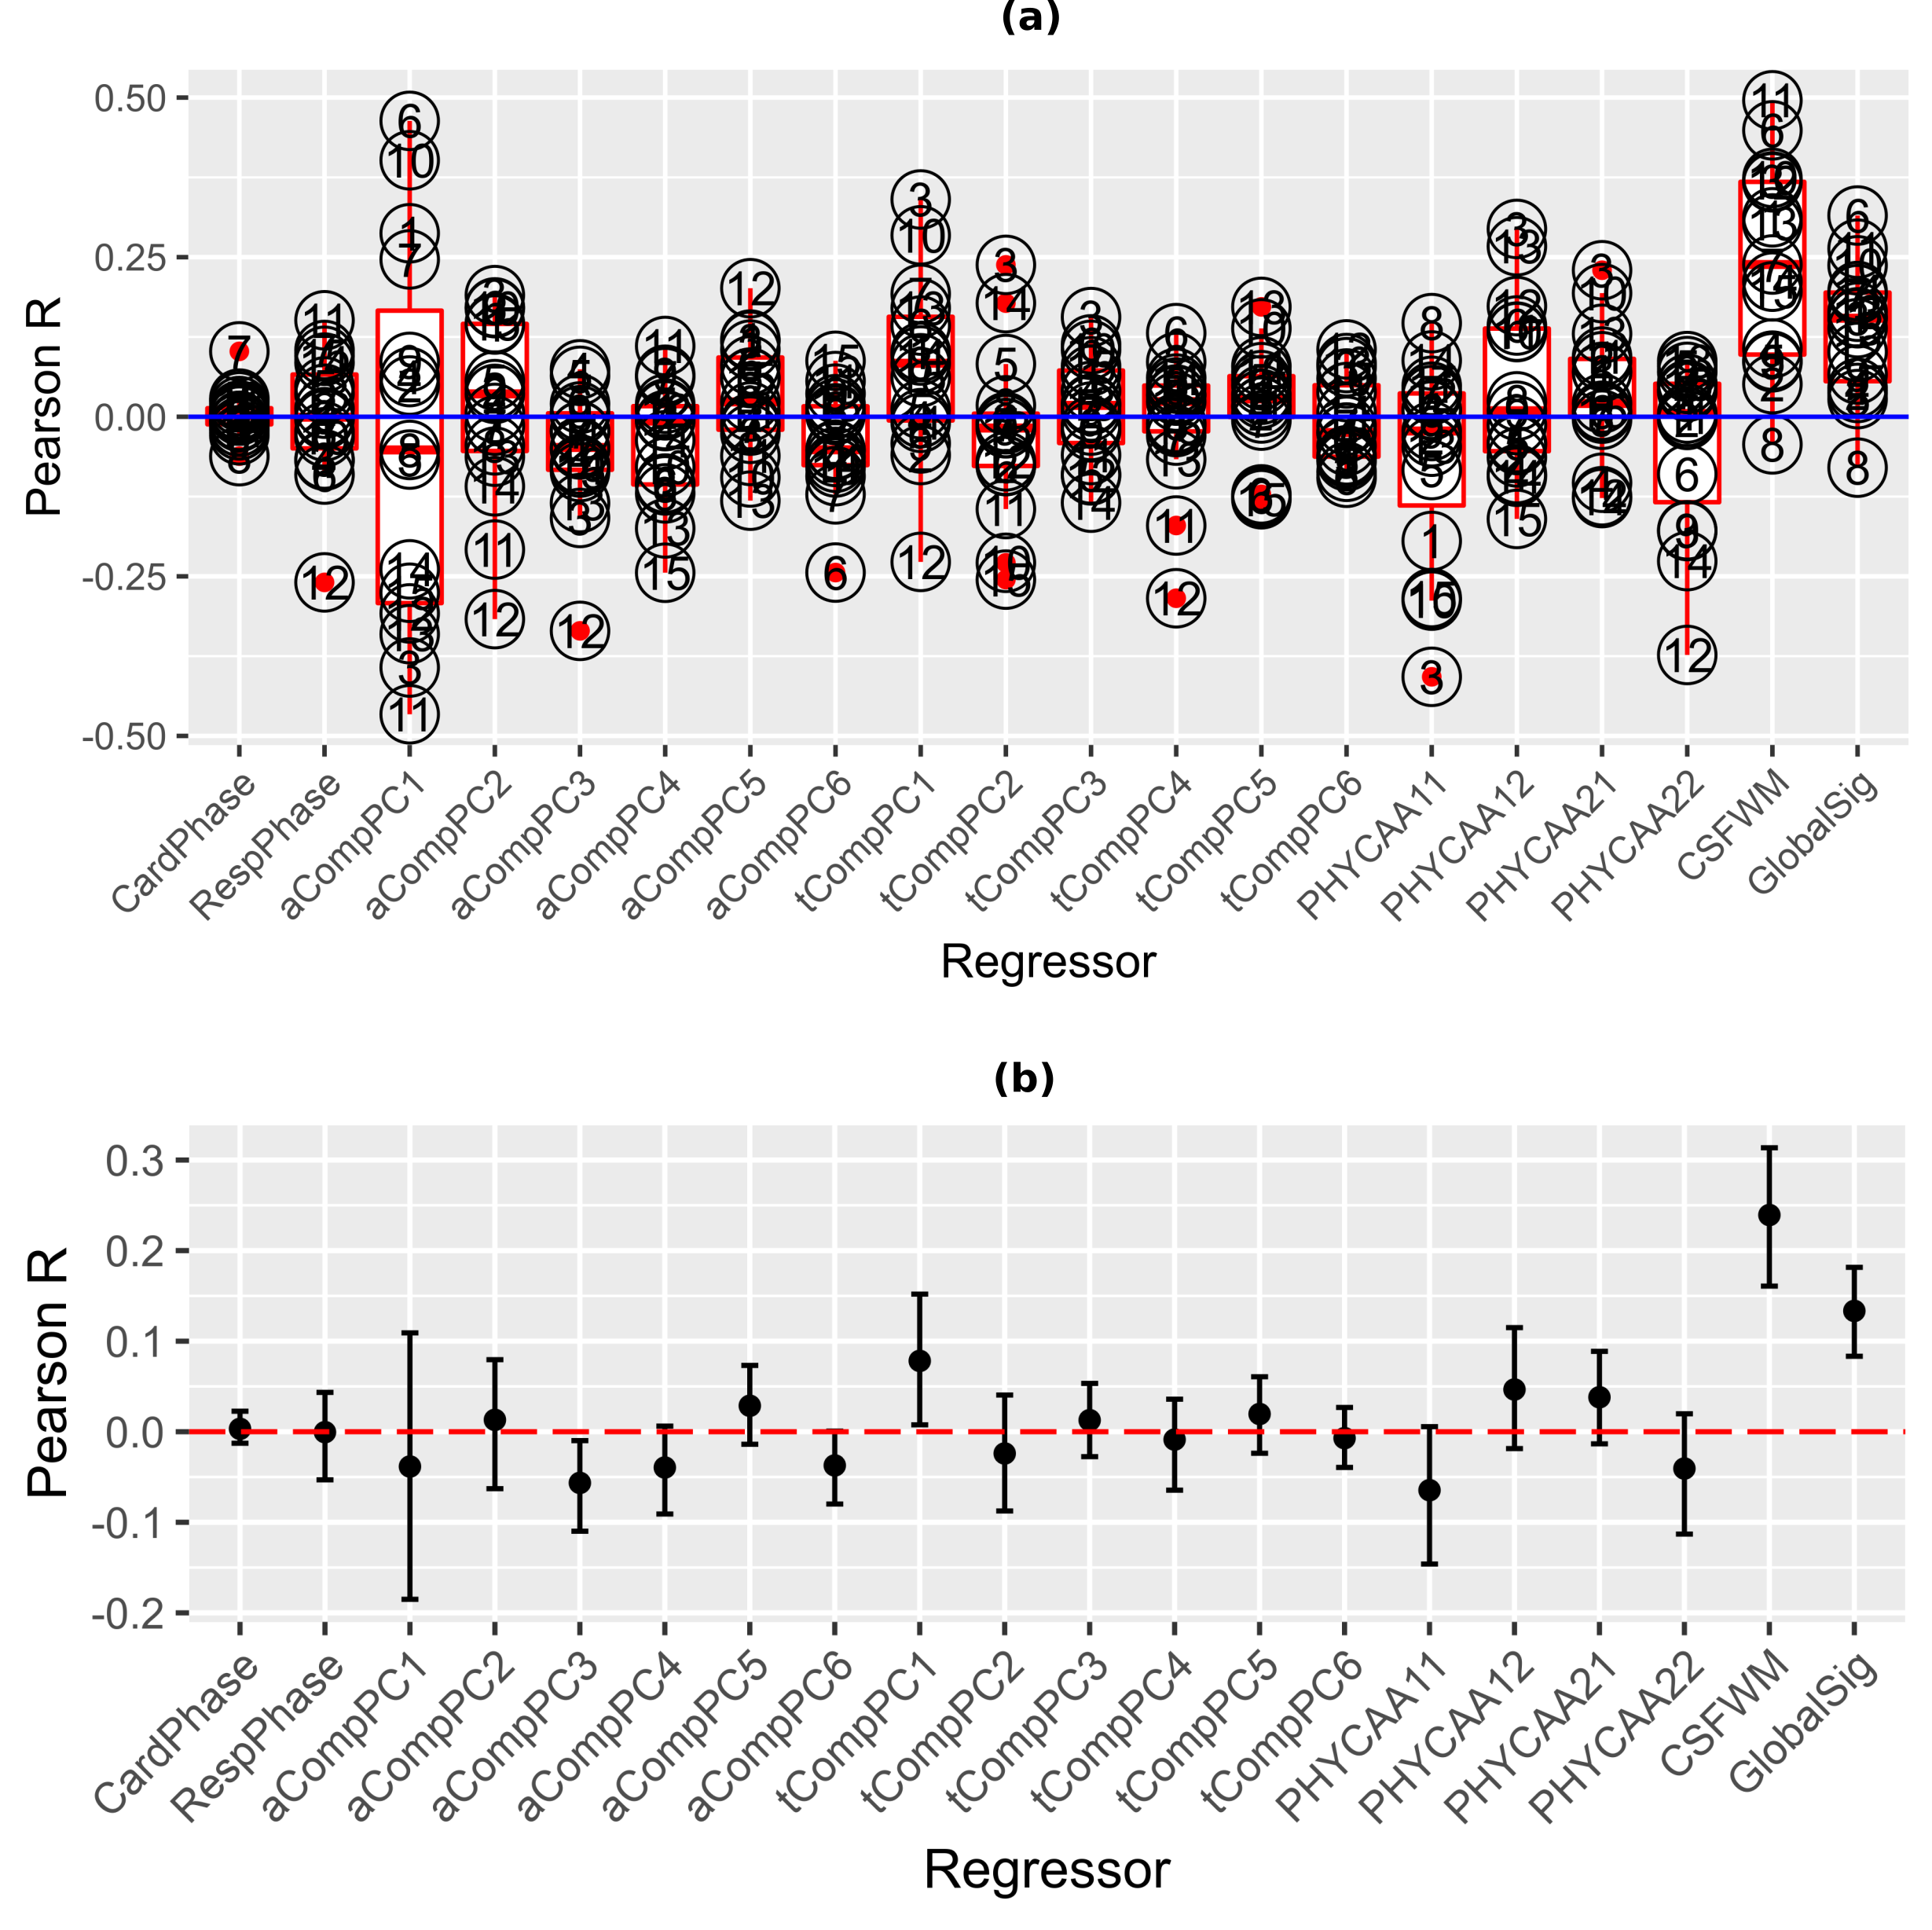
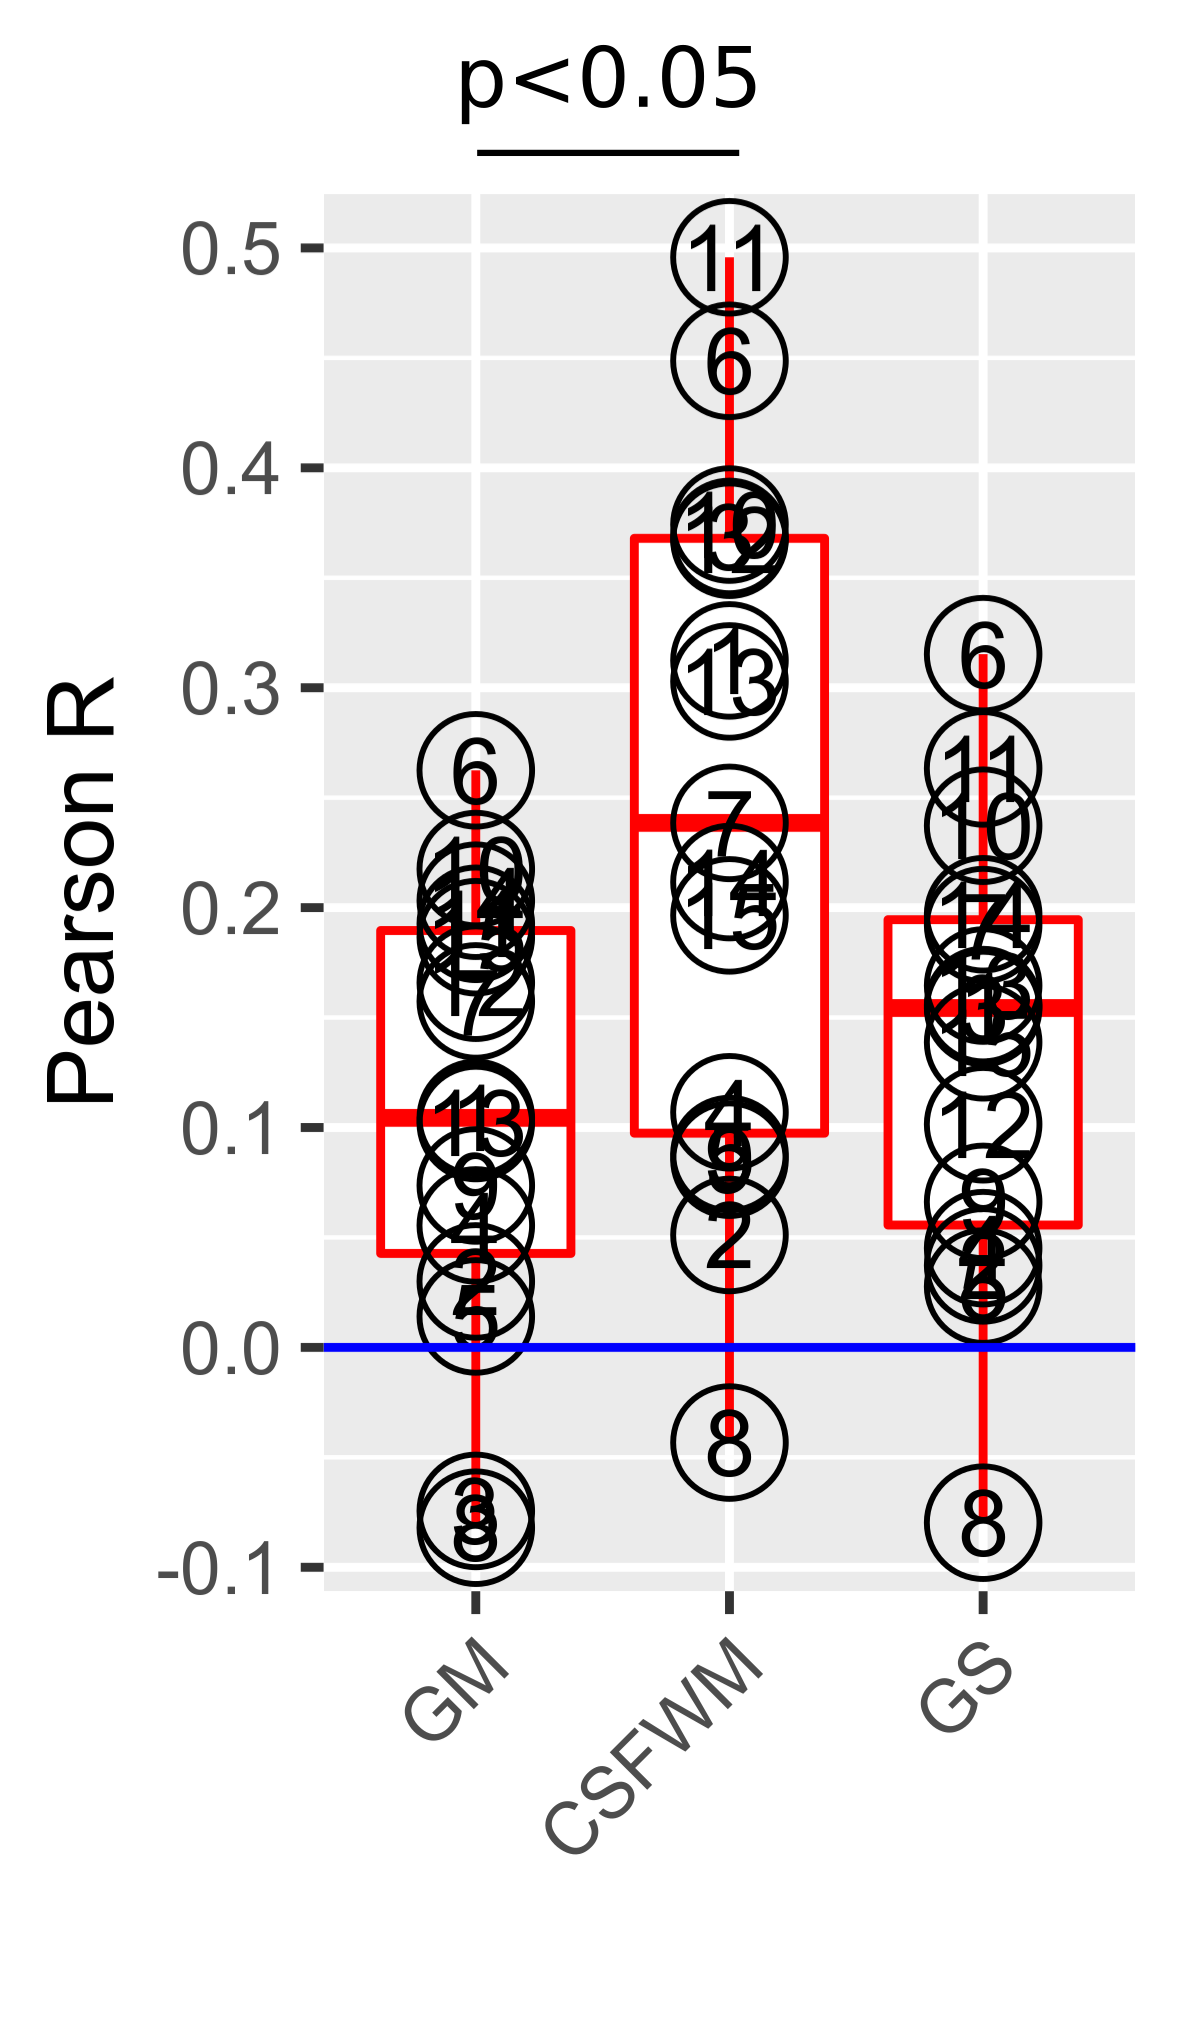
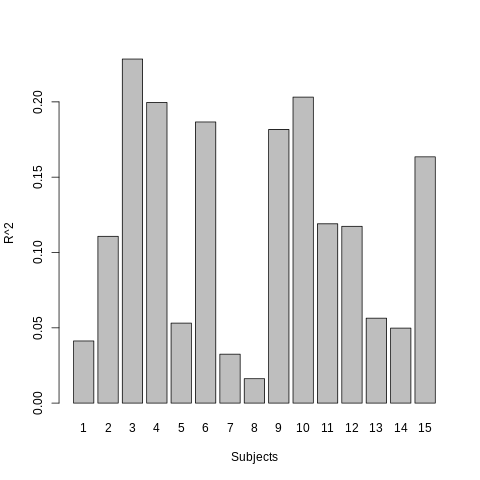
There is a significant positive correlation between REFRMS and mean CSF-WM and global signals (Fig.3), with the former correlation being significantly higher than that between REFRMS and mean GM (two-sample t-test, p<0.05) (Fig.4). Limited variance in REFRMS is explained by the six motion parameters (group-level average 12%) (Fig.5).
Similar results were obtained using frame displacement (FD) as metric for framewise motion (not reported due to space limitations).
Discussion
The observation that the CSF-WM signal is more correlated with REFRMS than the GM signal indicates a higher fractional variance explained by REFRMS in the CSF-WM signal than in the GM signal, which can be attributed to the relative absence of neuronal processes (that have very different temporal features than motion) in CSF-WM. Consequently, CSFWMR results in significant negative correlation of the GM signal with REFRMS (over-correction) (Fig.2(a)). Moreover, while GSR removes the residual motion in GM, there remains significant correlation with REFRMS in CSF-WM after GSR (Fig.2(b)), which can also be attributed to the higher fractional variance explained by motion in the CSF-WM signal than in the global signal (Fig.4). This is consistent with Power et al.’s study showing that CSF-WM regression is not effective in removing motion effects while they can be effectively removed by GSR13.
While aCompCor PCs do not show significant group-level correlation with REFRMS (Fig.3(b)), PC1 shows strong positive correlation with REFRMS for some subjects and strong negative correlation for some other subjects (Fig.3(a)). This indicates that lack of group-level correlation is (at least in PC1) due to the arbitrary signs of the PCs rather than true lack of correlation, explaining the efficacy of aCompCor in removing motion (Fig.2).
While respiration can induce bulk head motion, our data do not show strong correlation between cardiac/respiratory signals and framewise motion, explaining the inefficacy of RETRORICOR in removing the residual motion. tCompCor and PHYCAA+ presume to specifically target physiological noise and the observation that they cannot remove residual motion is consistent with that presumption.
Counter-intuitively, limited variance in the framewise motion is explained by the motion parameters (Fig.5), explaining the observation that M6R and M12R cannot remove the residual motion.
Conclusion
Motion confounds may remain after motion correction, motion censoring, and motion regression. We recommend that the output of the preprocessing pipeline be correlated against framewise motion to ensure any residual motion is removed prior to any subsequent analysis of the BOLD signal. Our data show that the residual motion in GM can be effectively removed by aCompCor and GSR.Acknowledgements
No acknowledgement found.References
1. Glover, G. H., Li, T.-Q. & Ress, D. Image-based method for retrospective correction of physiological motion effects in fMRI: RETROICOR. Magn. Reson. Med. 44, 162–167 (2000).
2. Behzadi, Y., Restom, K., Liau, J. & Liu, T. T. A Component Based Noise Correction Method (CompCor) for BOLD and Perfusion Based fMRI. Neuroimage 37, 90–101 (2007).
3. Churchill, N. W. & Strother, S. C. PHYCAA+: An optimized, adaptive procedure for measuring and controlling physiological noise in BOLD fMRI. NeuroImage 82, 306–325 (2013).
4. Anderson, J. S. et al. Network Anticorrelations, Global Regression, and Phase-shifted Soft Tissue Correction (PSTCor). Hum Brain Mapp 32, 919–934 (2011).
5. Hallquist, M. N., Hwang, K. & Luna, B. The Nuisance of Nuisance Regression: Spectral Misspecification in a Common Approach to Resting-State fMRI Preprocessing Reintroduces Noise and Obscures Functional Connectivity. Neuroimage 0, 208–225 (2013).
6. Jo, H. J. et al. Effective Preprocessing Procedures Virtually Eliminate Distance-Dependent Motion Artifacts in Resting State FMRI. Journal of Applied Mathematics (2013). doi:10.1155/2013/935154
7. Jo, H. J., Saad, Z. S., Simmons, W. K., Milbury, L. A. & Cox, R. W. Mapping Sources of Correlation in Resting State FMRI, with Artifact Detection and Removal. Neuroimage 52, 571–582 (2010).
8. Weissenbacher, A. Correlations and anticorrelations in resting-state functional connectivity MRI: A quantitative comparison of preprocessing strategies. Neuroimage 47, 1408–1416 (2009).
9. Liu, T. T., Nalci, A. & Falahpour, M. The global signal in fMRI: Nuisance or Information? NeuroImage 150, 213–229 (2017).
10. Murphy, K. & Fox, M. D. Towards a consensus regarding global signal regression for resting state functional connectivity MRI. Neuroimage 154, 169–173 (2017).
11. Power, J. D., Plitt, M., Laumann, T. O. & Martin, A. Sources and implications of whole-brain fMRI signals in humans. NeuroImage 146, 609–625 (2017).
12. Power, J. D., Barnes, K. A., Snyder, A. Z., Schlaggar, B. L. & Petersen, S. E. Spurious but systematic correlations in functional connectivity MRI networks arise from subject motion. Neuroimage 59, 2142–2154 (2012).
13. Power, J. D. et al. Methods to detect, characterize, and remove motion artifact in resting state fMRI. Neuroimage 84, (2014).
Figures