0907
Characterizing Hierarchical Spatial Variations of the Brain: A Novel Analysis Framework to Study Dynamic Brain Function1The Mind Research Network, Albuquerque, NM, United States, 2Department of Psychiatry and Behavioral Sciences, University of New Mexico, Albuquerque, NM, United States, 3Department of Psychiatry, University of North Carolina, Chapel Hill, NC, United States, 4Department of Psychiatry, University of California San Francisco, San Francisco, CA, United States, 5San Francisco VA Medical Center, San Francisco, CA, United States, 6Department of Psychiatry and Biobehavioral Sciences, University of California Los Angeles, Los Angeles, CA, United States, 7Department of Psychiatry, University of Minnesota, Minneapolis, MN, United States, 8School of Medicine, Yale University, New Haven, CT, United States, 9Department of Psychiatry and Human Behavior, University of California Irvine, Irvine, CA, United States, 10Department of Psychology, Georgia State University, Atlanta, GA, United States, 11Department of Psychiatry, University of Iowa, Iowa, IA, United States, 12Clinical Translational Neuroscience Laboratory, Department of Psychiatry and Human Behavior, University of California Irvine, Irvine, CA, United States, 13Department of Electrical and Computer Engineering, University of New Mexico, Albuquerque, NM, United States
Synopsis
A novel, data-driven analysis framework was proposed to characterize the spatial variation of brain function. This framework utilizes the concept of a functional hierarchy and encapsulates the spatiotemporal variations of brain functional domains from its associated high-order intrinsic connectivity networks. The results show spatial fluidity behavior of functional domains, including a broad spectrum of changes in regional associations from strong coupling to complete decoupling. Interestingly, such spatial variations drive the interactions between functional domains, showing concurrent evaluation in time. Our results further highlight that the captured spatial dynamics can serve as potential biomarkers for patients with schizophrenia.
Introduction
In the recent times, there has been a growth in studies utilizing fMRI to study brain dynamics. Understanding the brain dynamics means capturing temporal as well as spatial changes. However, most previous studies have focused only on capturing the temporal variations among fixed spatial nodes. Here, we introduce a novel approach that captures the spatial dynamics by modeling the brain as a hierarchical functional architecture, in which lower levels of the hierarchy have higher functional homogeneity and less dynamic behavior compare to higher levels. Results highlight the spatial evolution of functional domains (FDs) over time and dynamic interplay between them. We further found that patients with schizophrenia (SZ) show transient reductions in functional activity and state connectivity across several FDs, particularly the subcortical domain. Our proposed analysis framework can provide a new insight into how the brain changes its organizations over time.Methods
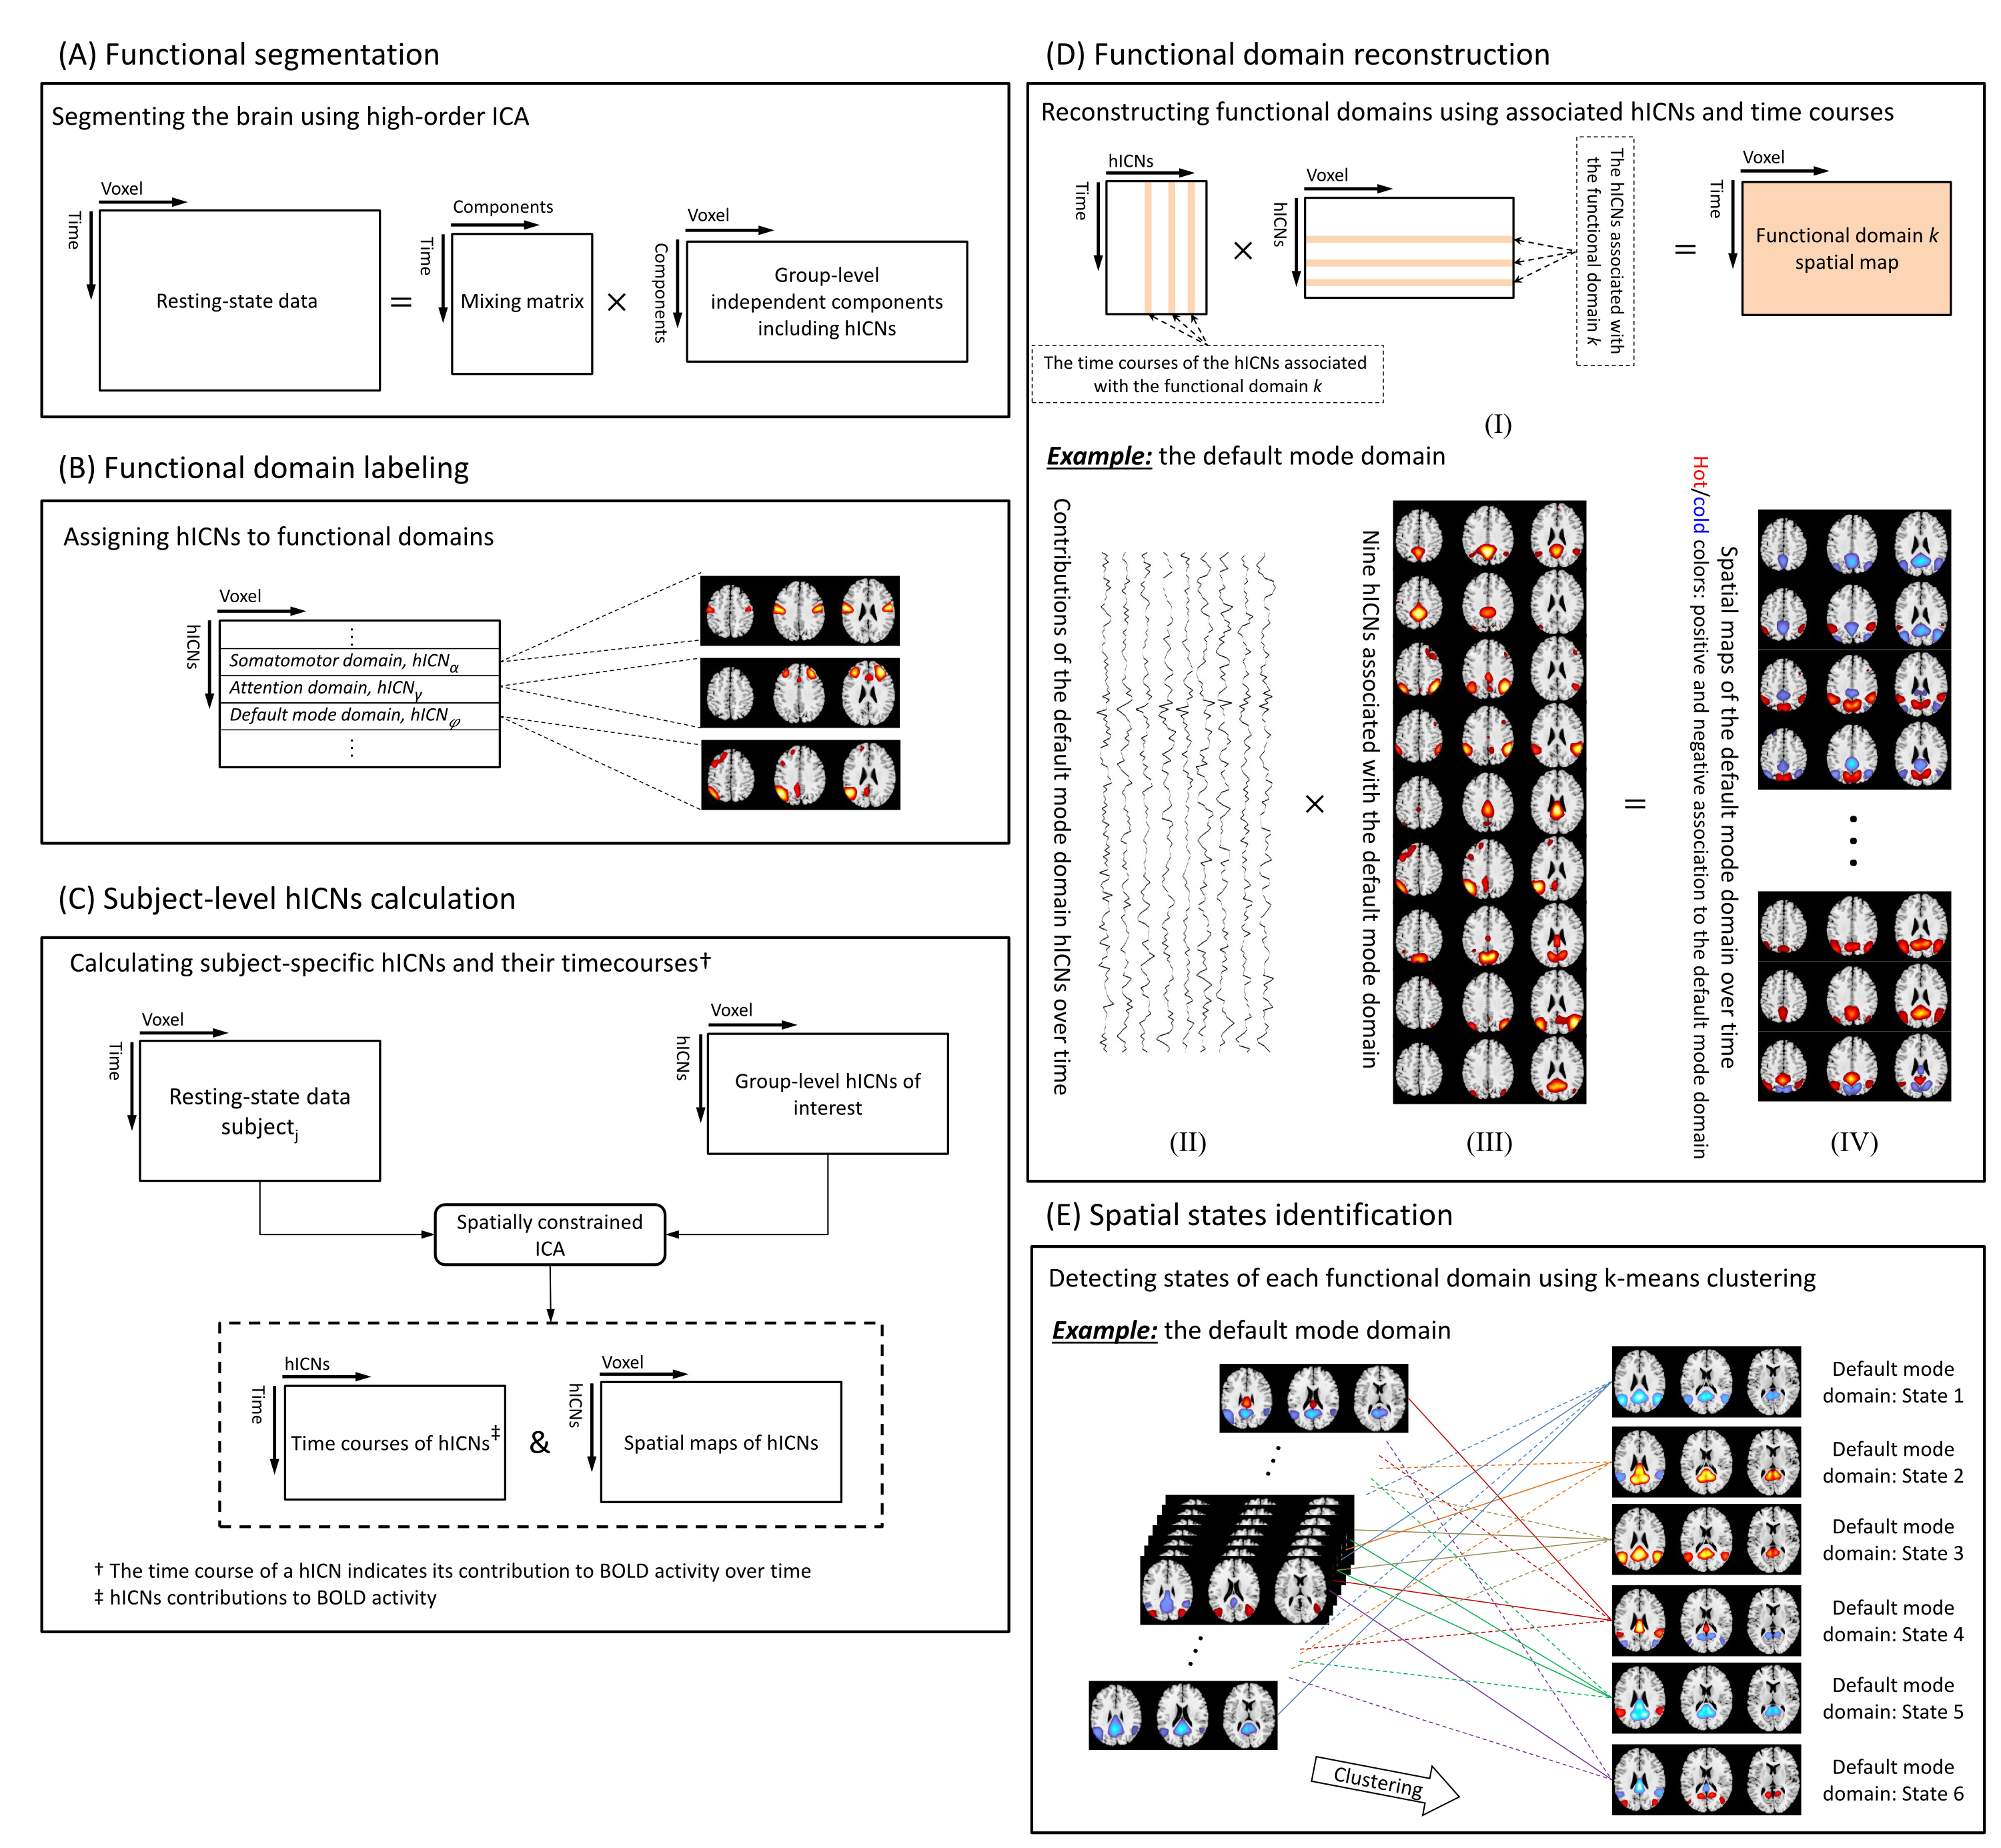
Figure 1 illustrates the flowchart of the proposed spatial dynamic framework. Resting-state fMRI dataset was collected from 7 imaging sites across the United States including 163 healthy controls (HCs) and 146 age- and gender-matched SZ were used in the present study. After common preprocessing steps1, 2, a high-order independent component analysis (model order = 200) was applied to calculate high-order intrinsic connectivity networks (hICNs) as functional units. hICNs were categorized into nine FDs. For each FDk, k = 1 to 9, we constructed its dynamic spatial patterns (V × T) using a linear combination of the spatial maps (SMs, V × Ck) and time-courses (TCs, Ck × T) of the associated hICNs, where V is the number of voxels, T is the number of time points and Ck is the number of hICNs in FDk. A k-means clustering was conducted on the spatial dynamic patterns of each FD, with the cluster size determined by the elbow criterion, to capture reoccurring spatial states of each FD. Finally, we calculated the level of concurrency between FDs’ states using a coincidence index and used the Newman modularity detection approach to characterize the functional modules (FMs). FMs are defined as a set of states that reoccur together more often than with others in a distinguishable manner. The group comparison analysis was conducted by comparing the dynamic measures obtained from the above framework between SZ and HC.Results
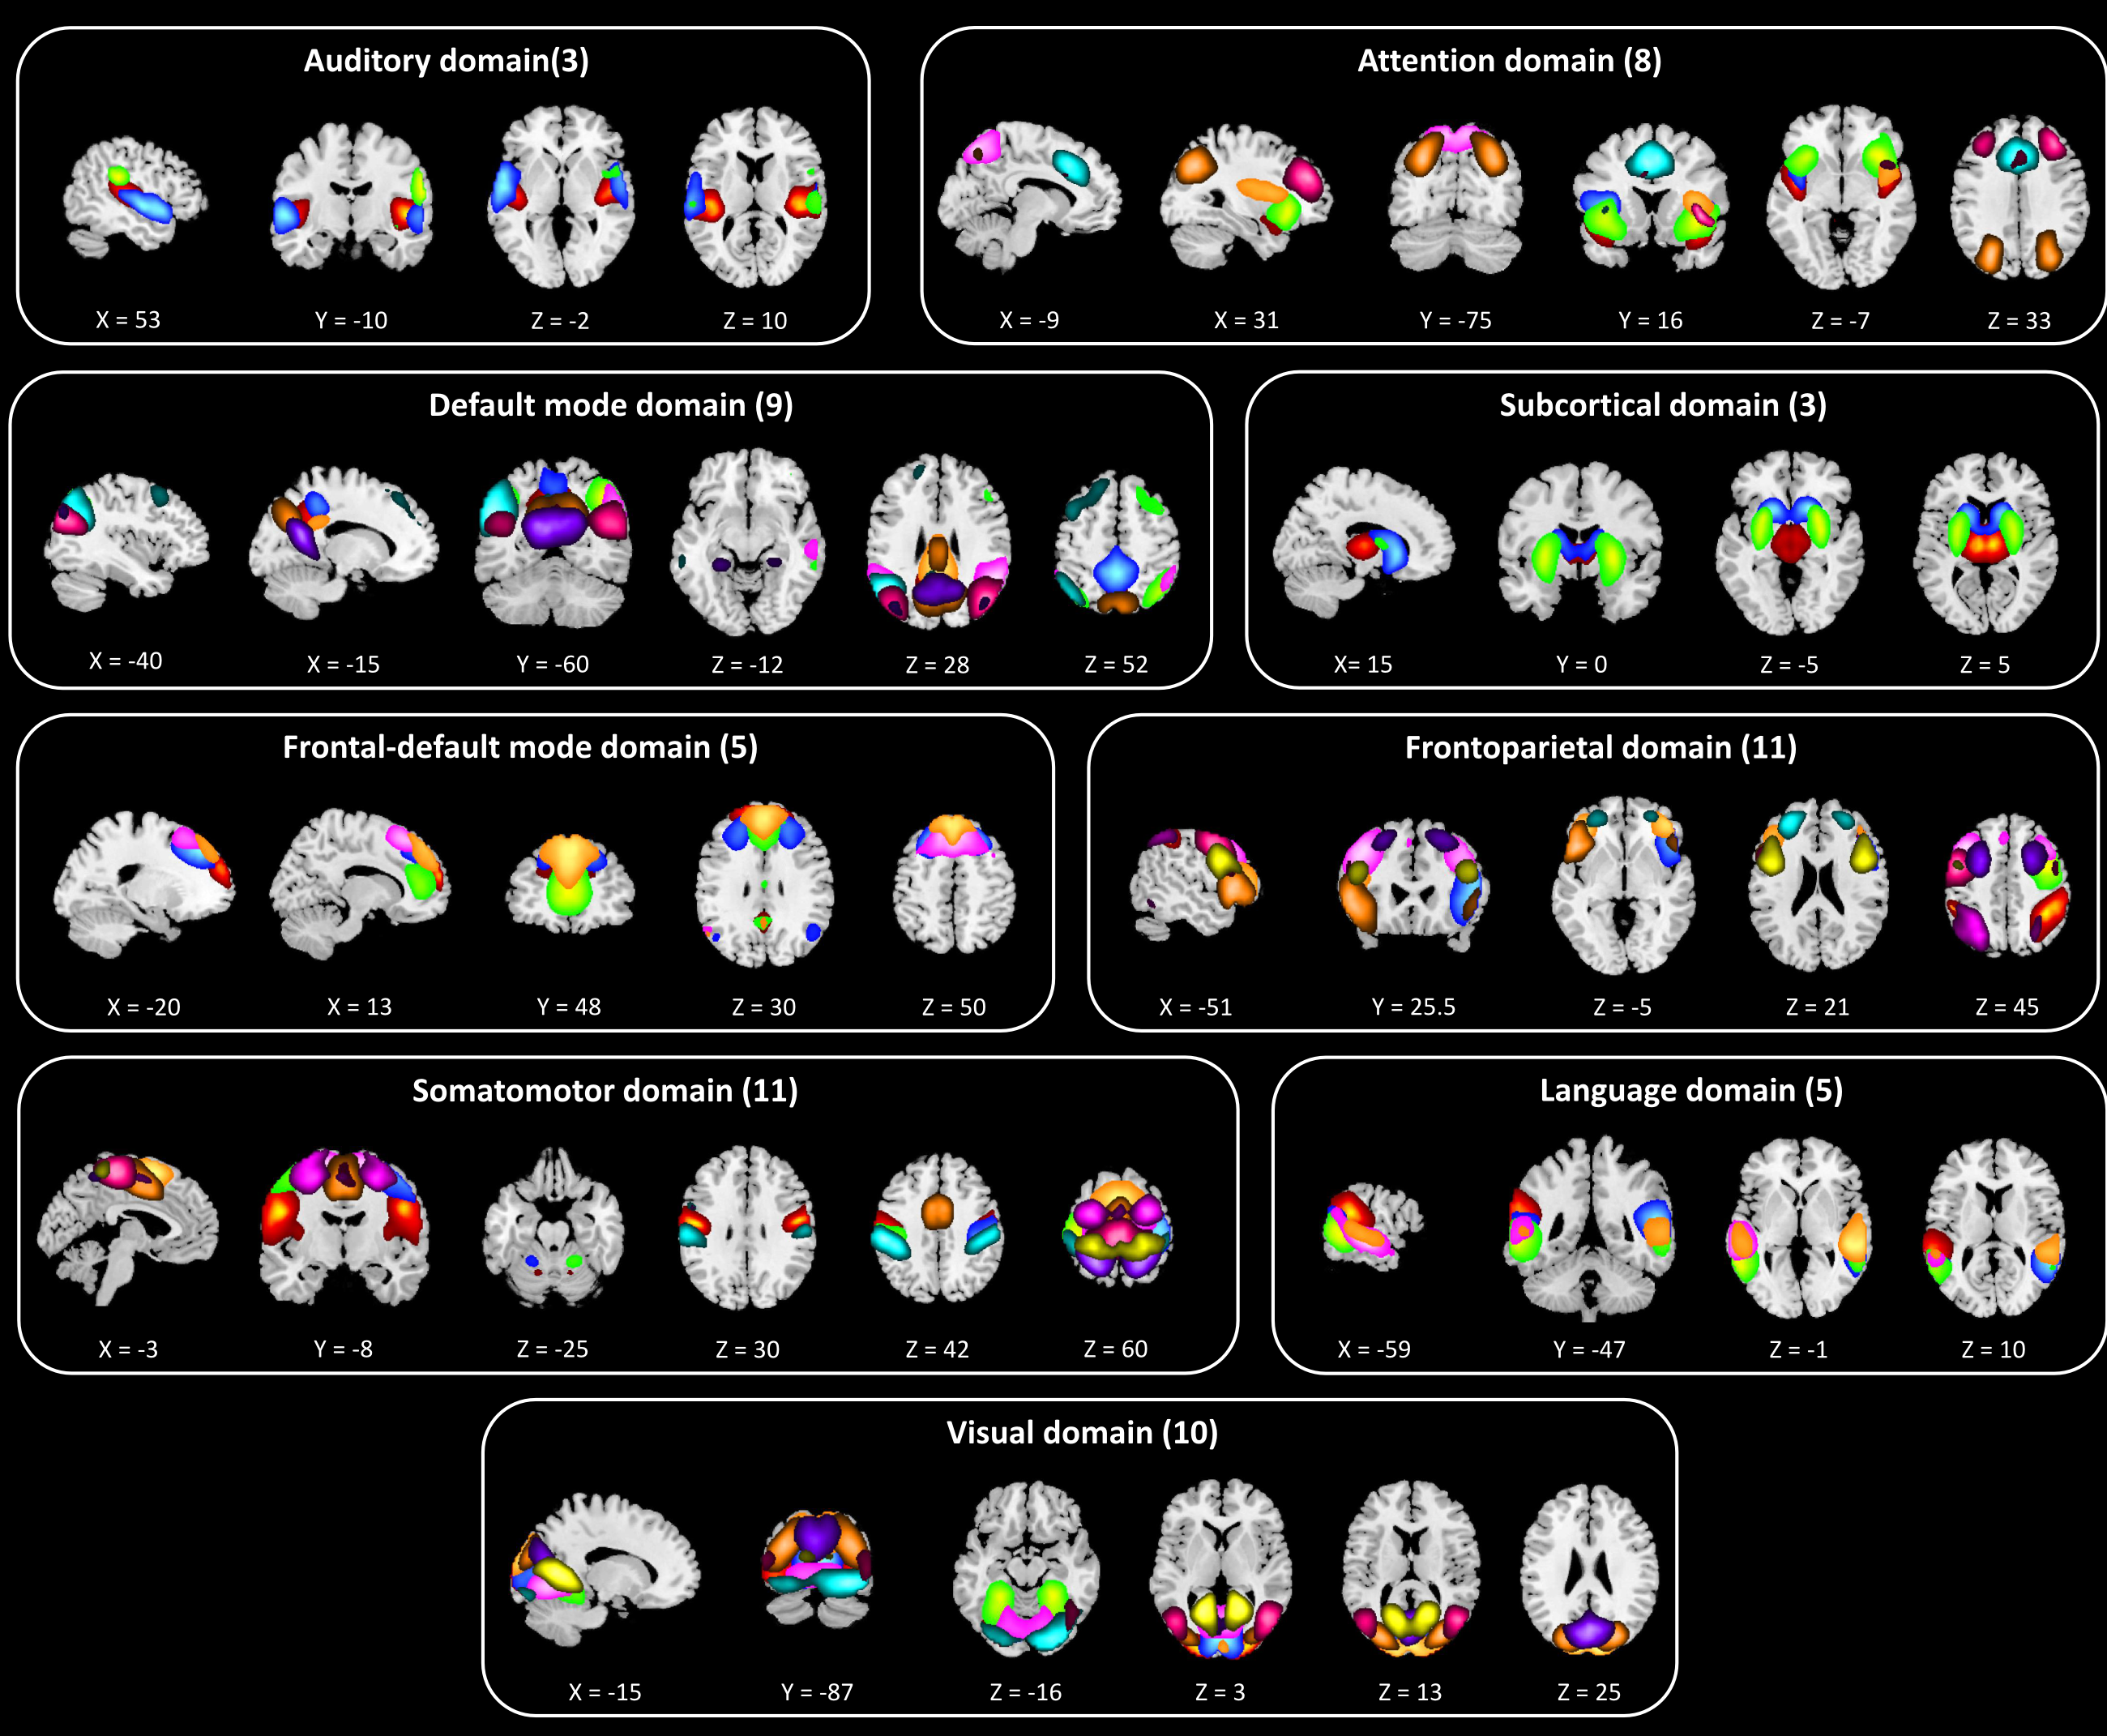
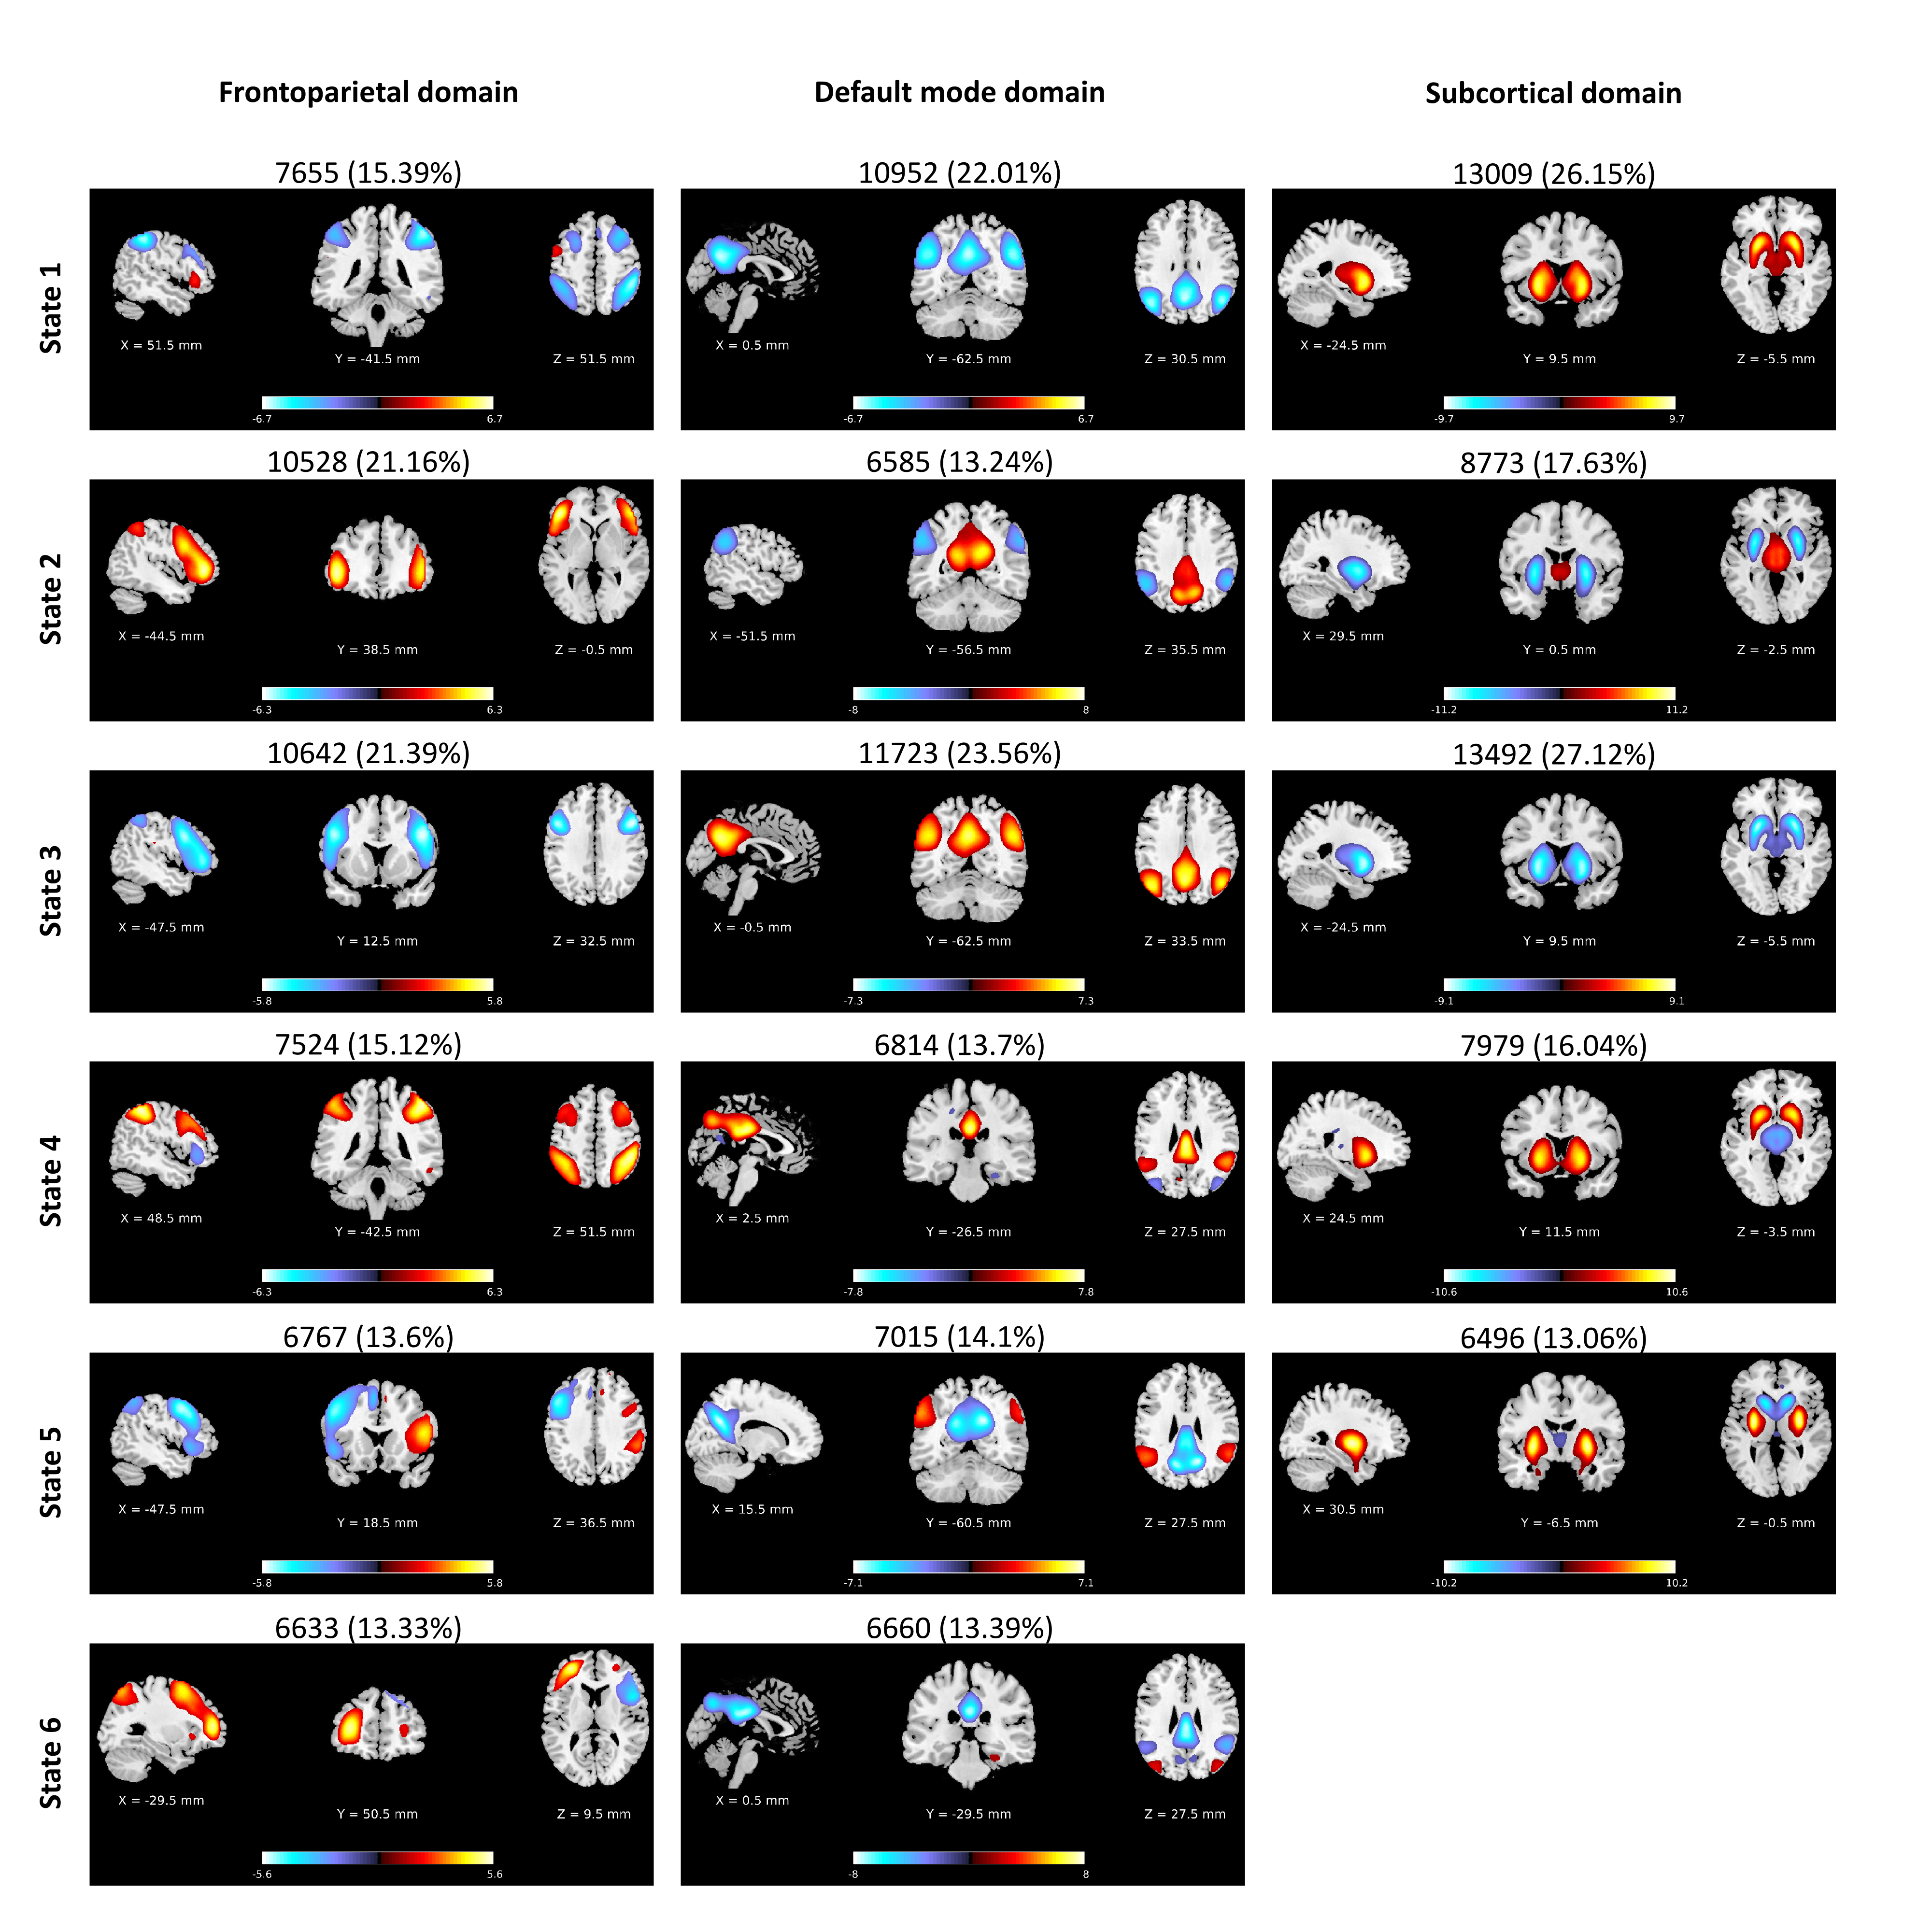
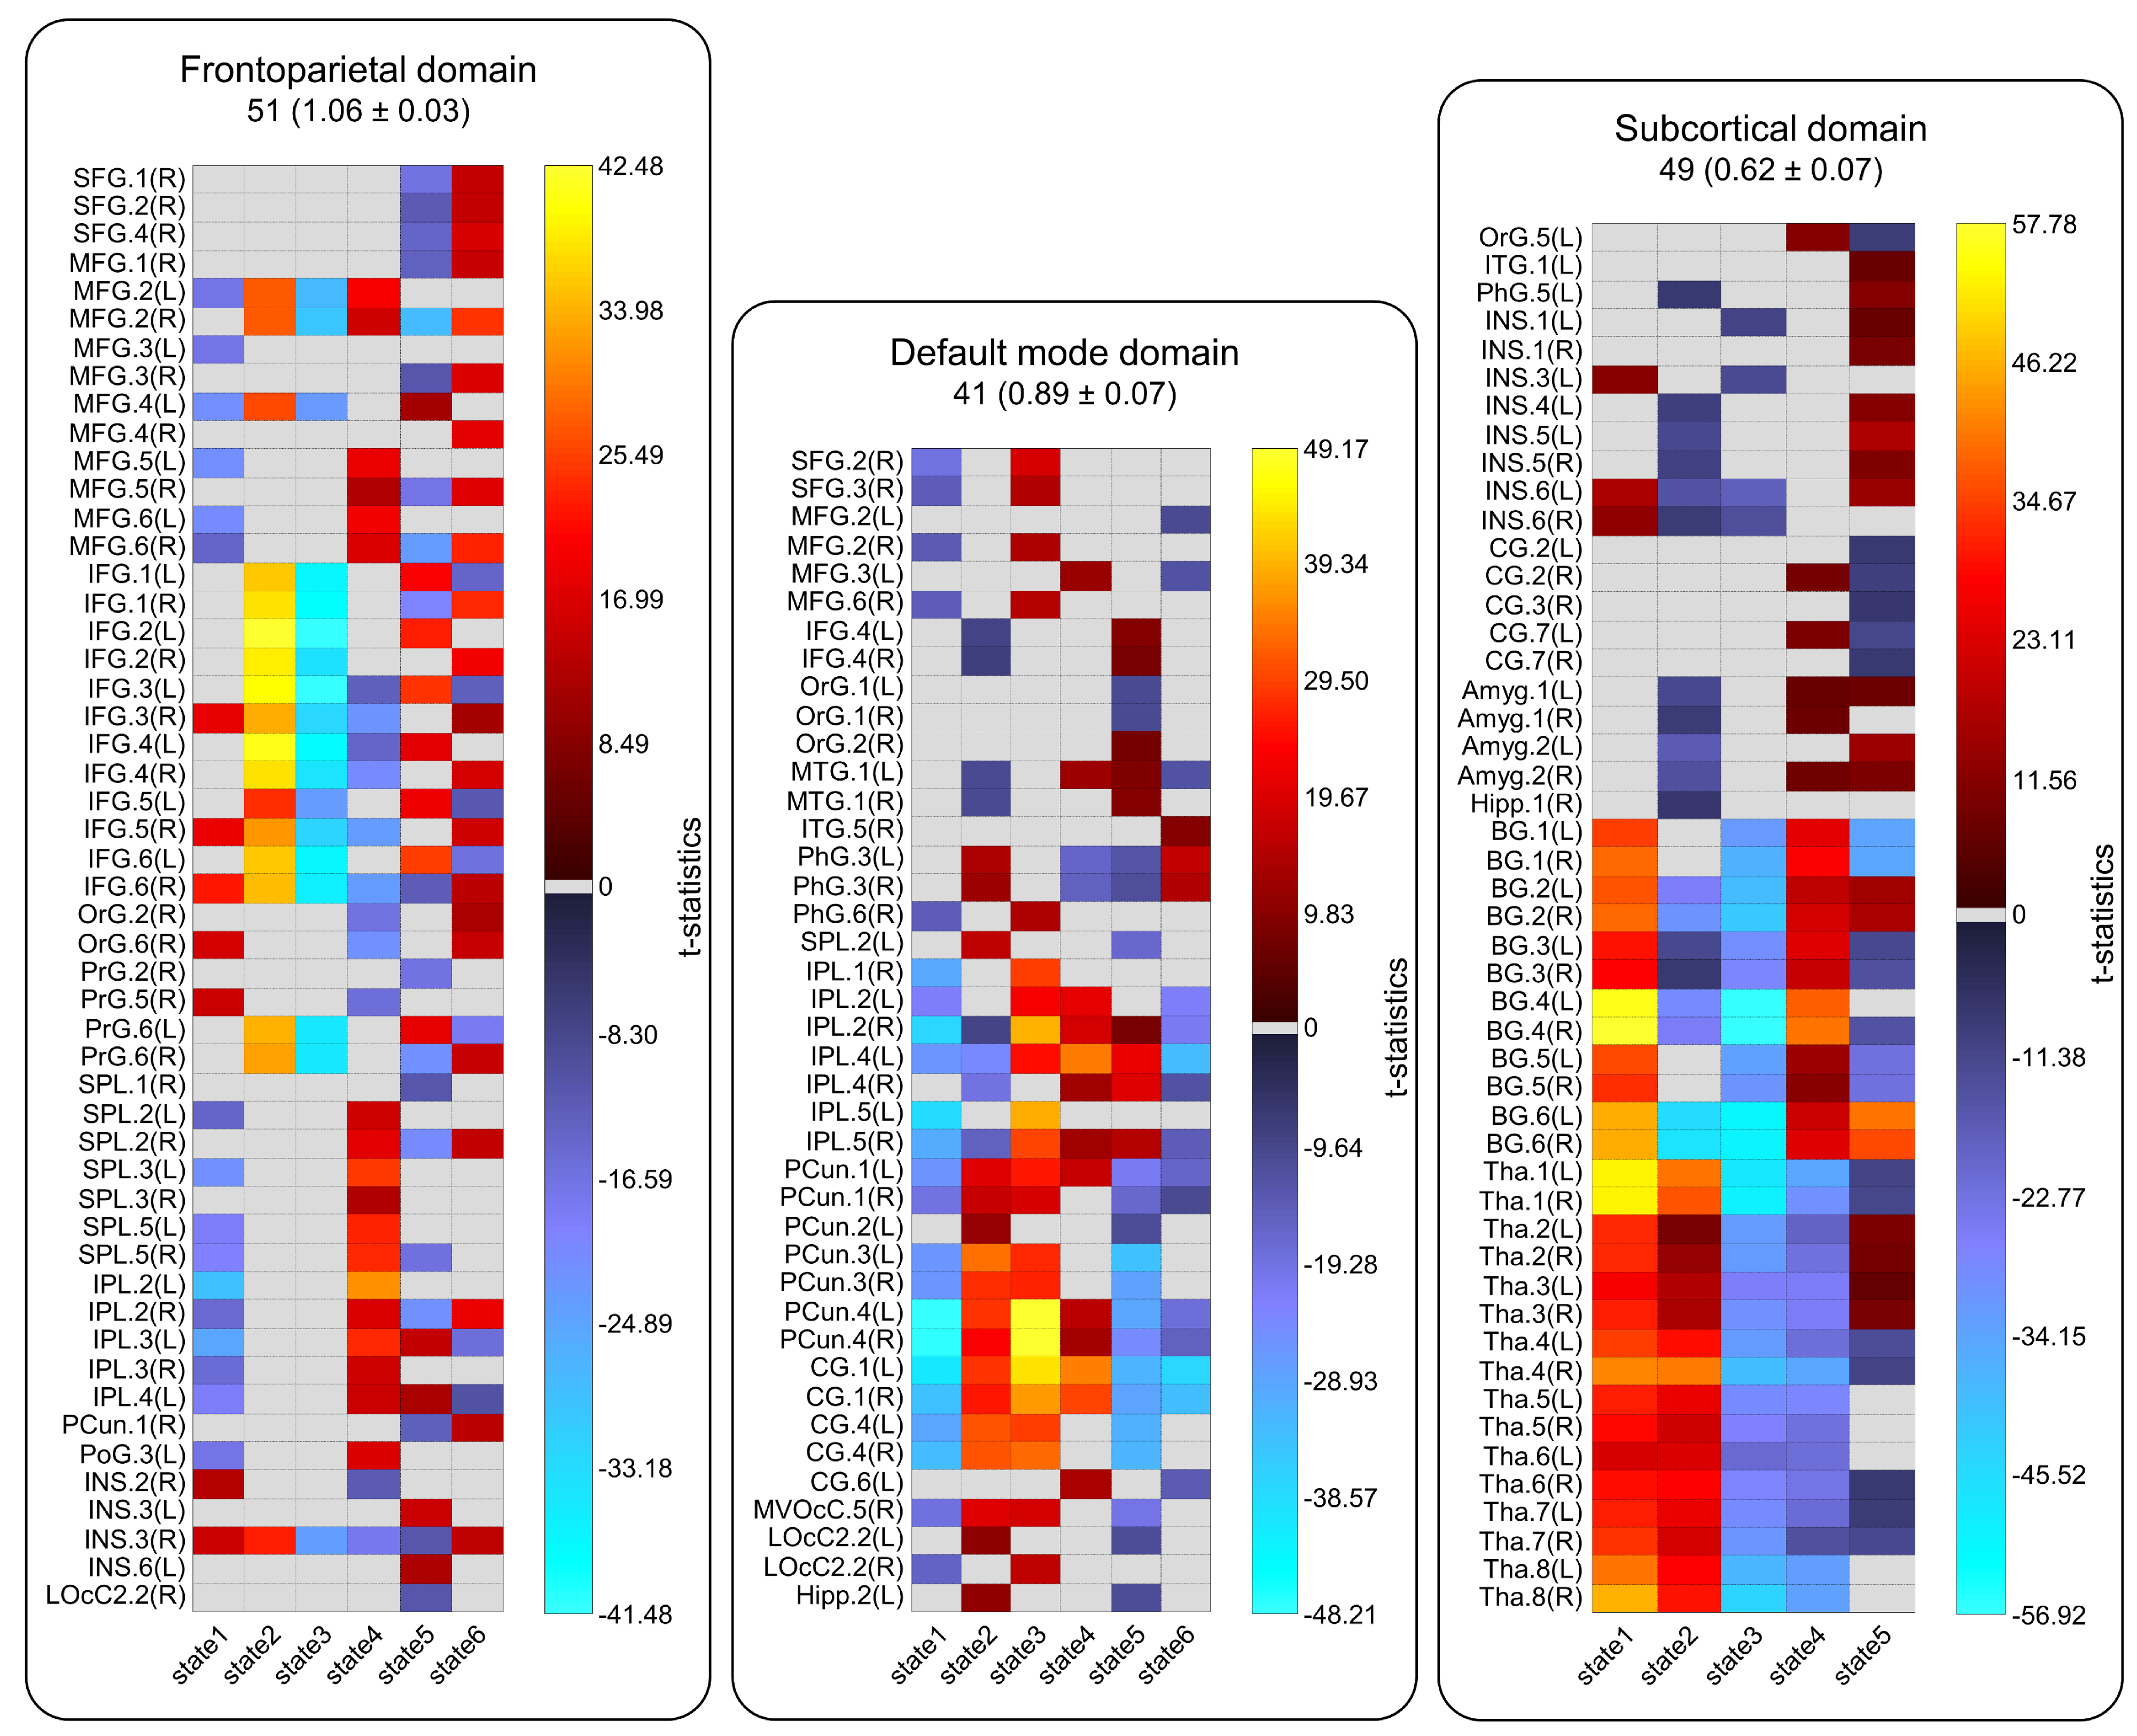
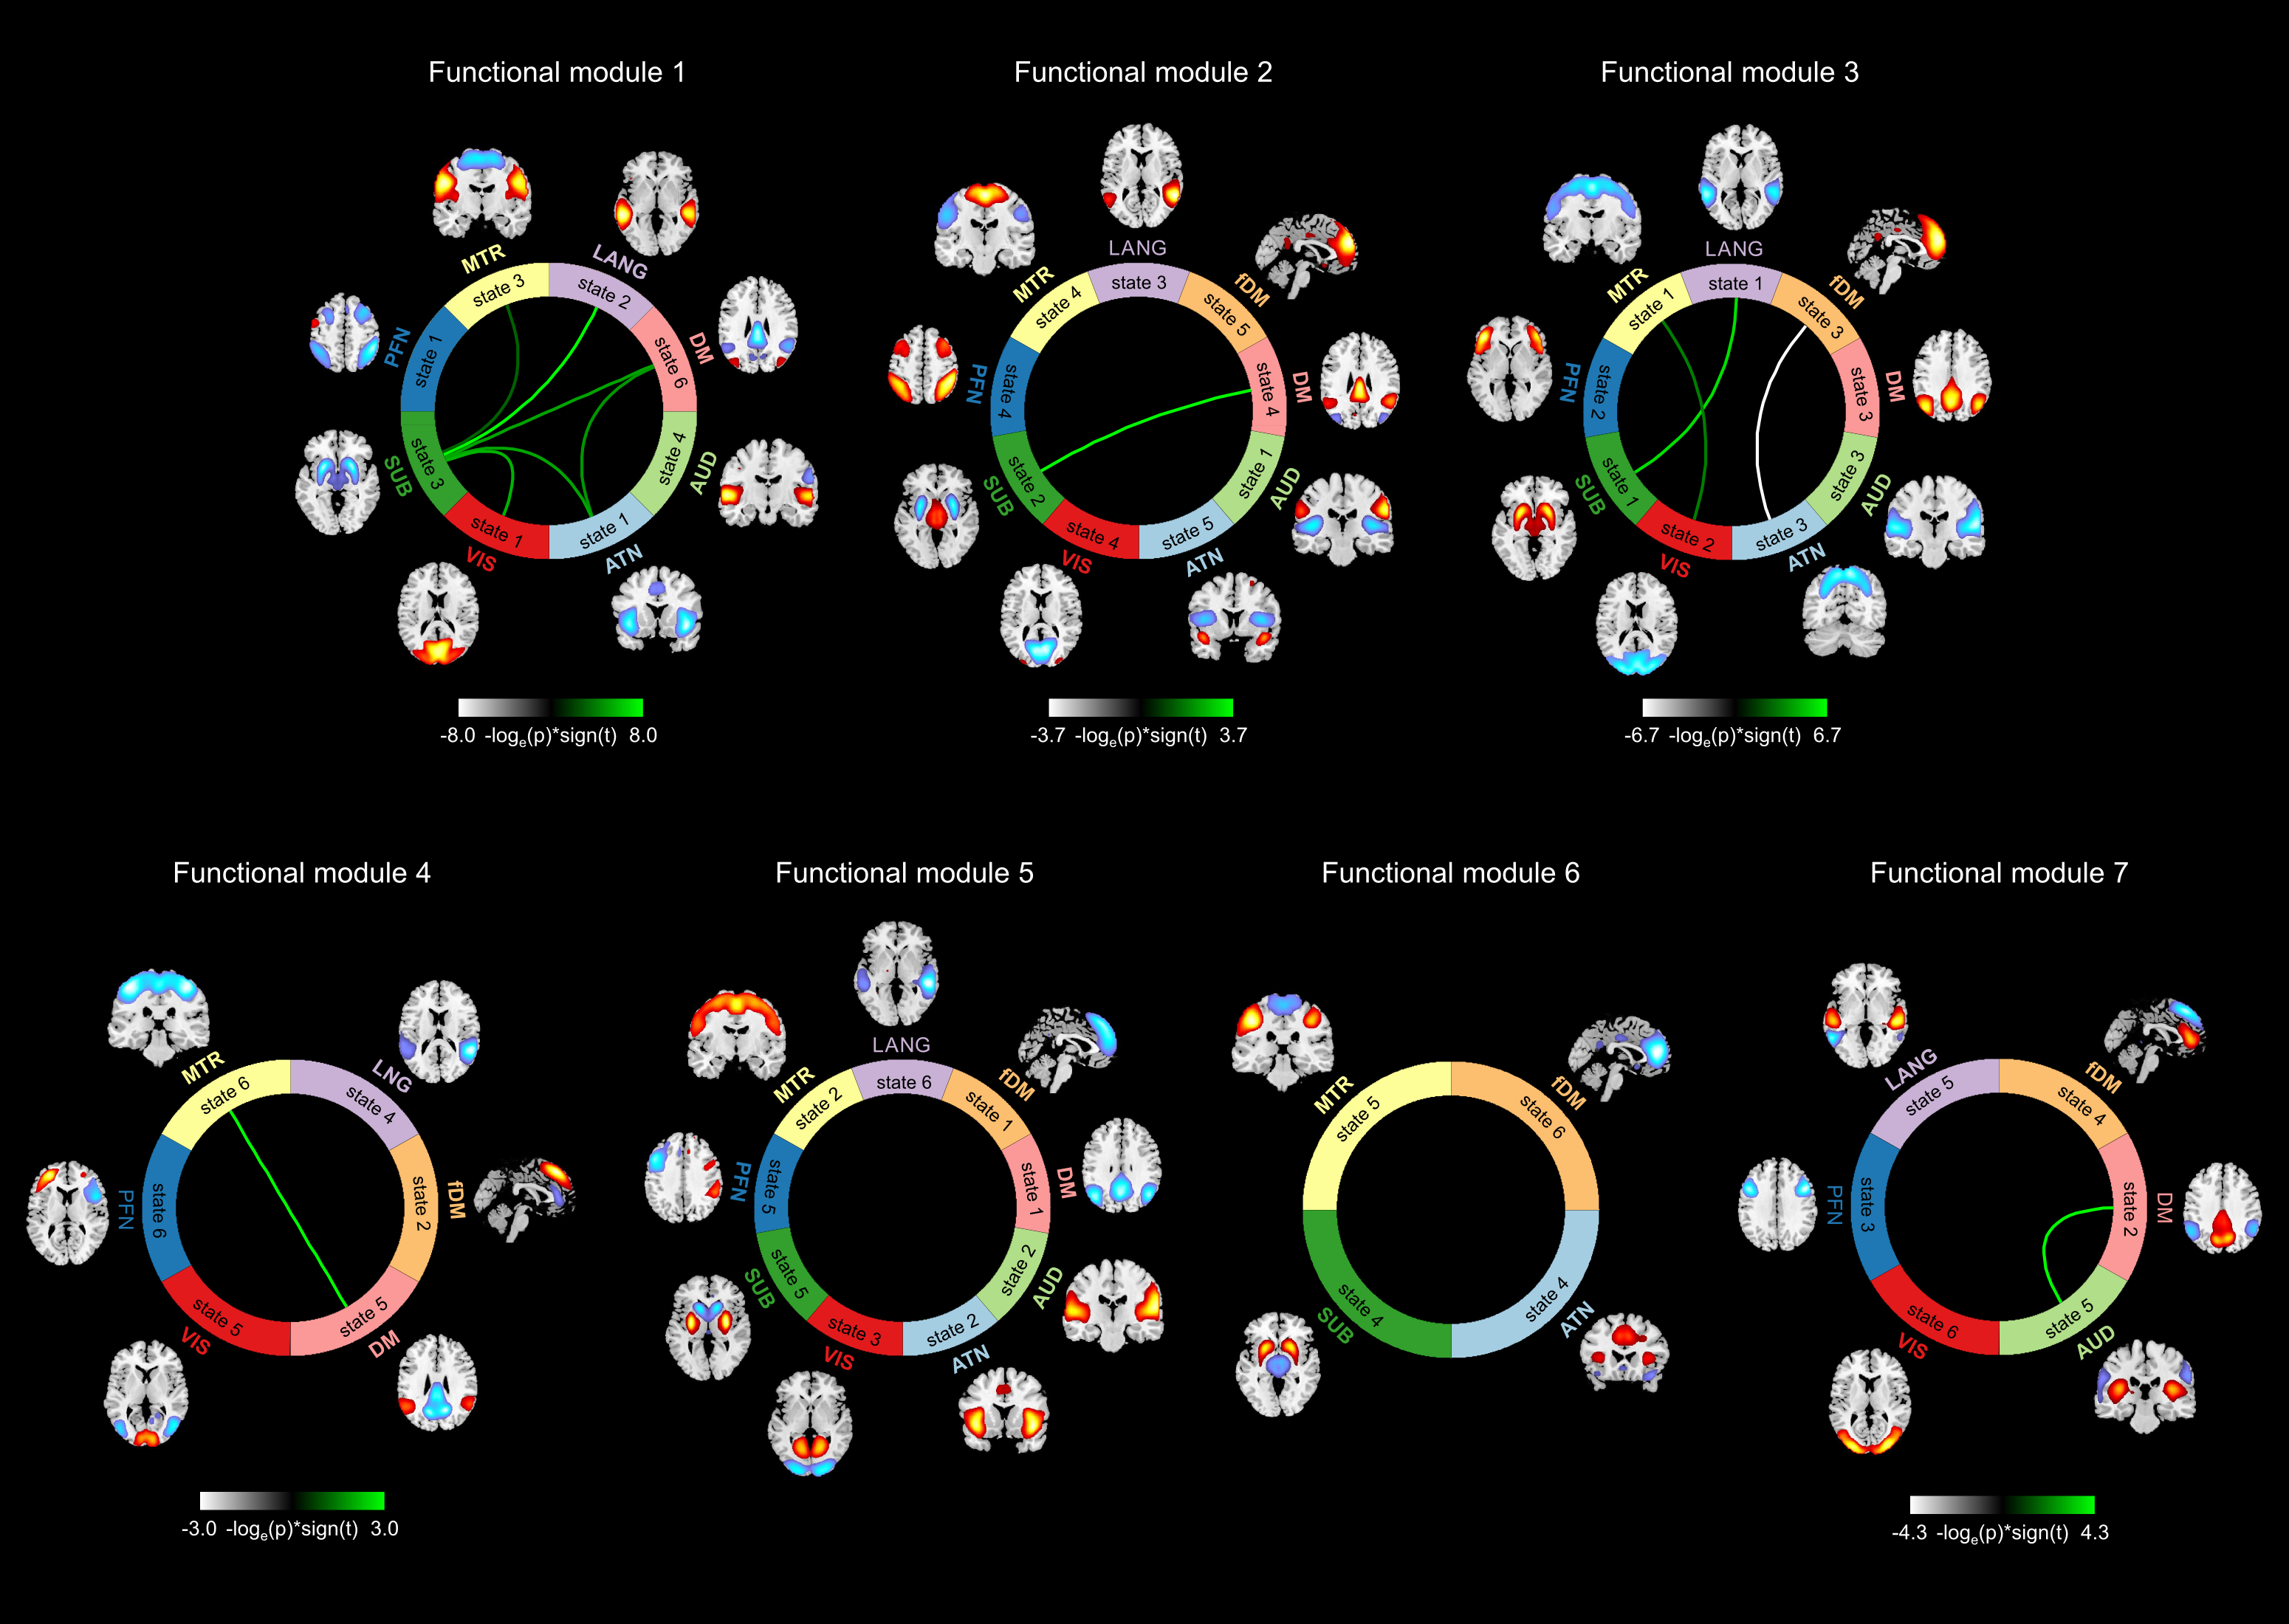
Sixty-five out of 200 components were selected as cortical and subcortical hICNs and categorized into nine FDs (Figure 2). The spatial domain states of FDs shows distinct spatial patterns, and their occurrence rates range from 10% to 25% (Figure 3). The results highlight that FDs are spatially fluid, and there is changes in regions’ memberships and the strengths of their associations to FDs over time (Figure 4). For example, CG4 (cingulate gyrus subregion 4) is positively associated with the default mode in State 2 and 3 (presented in hot color), negatively associated with the default mode at States 1 and 5 (presented in cold), and becomes dissociated at States 4 and 6 (presented in gray). The variability index which represents the overall variability of each FD shows maximum and minimum variations in the frontoparietal and subcortical domains, respectively. We also observed distinct reoccurring patterns (FMs) in the temporal coherence (coupling) between states of FDs (Figure 5). Statistical comparison revealed reductions in functional activity and connectivity in several FDs including reduction in functional state connectivity within FM1 (Figure 5).Discussion and Conclusion
We introduced a novel framework for analyzing the spatial dynamics of the brain. The results provide strong evidence that functional organizations evolve spatially over time including a broad spectrum of changes in regional associations from strong coupling to complete decoupling. These variations may explain the inconsistencies observed in previous static analyses regarding regions’ memberships to brain functional organizations. Our results also demonstrate that using predefined atlases might not be enough because it ignores the spatial variations of the functional regions. The voxels within each region of interest are not likely to consistently covariates with each other across time, implying that the definition of atlases should also be dynamic in time. Our further analysis reveals the ability of the approach to obtain new information of the brain function and detect alterations among patients with SZ. Taken together, the proposed framework might help to improve our understanding of brain dynamics by avoiding the assumption of fixed functional nodes.Acknowledgements
This work was supported by grants from the National Institutes of Health grant numbers 2R01EB005846, R01REB020407, and P20GM103472; and National Science Foundation (NSF) grant 1539067 to Dr. V.D. Calhoun; and the National Institute of Mental Health grant number R01MH058262 and the Department of Veterans Affairs Senior Research Career Scientist award I01 CX0004971 to Dr. J.M. Ford.References
1. Damaraju E, Allen EA, Belger A, et al. Dynamic functional connectivity analysis reveals transient states of dysconnectivity in schizophrenia. NeuroImage: Clinical 2014;5:298-308.
2. Fu Z, Tu Y, Di X, et al. Characterizing dynamic amplitude of low-frequency fluctuation and its relationship with dynamic functional connectivity: an application to schizophrenia. Neuroimage Sep 20 2017.
Figures