0904
Segmentation of Brain Metastatic Lesions in Magnetic Resonance Imaging using Deep Learning1Athinoula A. Martinos Center for Biomedical Imaging, Charlestown, MA, United States, 2Department of Radiology, Brigham and Women’s Hospital, Boston, MA, United States, 3Massachusetts General Hospital, Boston, MA, United States, 4Stephen E. and Catherine Pappas Center for Neuro-Oncology, Massachusetts General Hospital, Boston, MA, United States
Synopsis
Magnetic resonance imaging
plays a key role in assessing the efficacy of treatment for patients with brain
metastases by enabling neuroradiologists to track lesions sizes across time
points. However, manual segmentation of multiple time-points is prohibitively time-consuming,
thus precluding its use in current clinical workflow. In this study, we develop
a deep learning approach to automatically segment metastatic lesions, and demonstrate
that our predicted segmentation has high agreement with the gold-standard manual
segmentation.
Purpose
Radiographic response assessment is the one of the backbones for assessing tumor response in patients with brain metastases (BM)1. In current clinical practice, patients with BM receive surgery, radiation, and/or chemotherapy, and undergo magnetic resonance (MR) scans at regular intervals throughout their therapy. To assess efficacy of the current treatment regimen, neuroradiologists track individual lesion sizes across time points2. If BM enlarge overtime, a different treatment option may be needed. However, as some patients can have more than 10 lesions, manual delineation of all metastatic lesions is prohibitively time-consuming. As a result, most radiographic response criteria restrict response to a select number of target lesions. This fails to capture the full extent of the disease burden and can miss changes over time in individual tumors. In addition, manual segmentation is subject to large amounts of inter-rater variability and BM can range from less than 0.1 mL (i.e. micro-metastases) to greater than 10.0 mL while having varied shapes/structures (from spherical to highly irregular), making consistent outlining challenging3. To overcome these challenges and enable applications in a clinical setting, we propose a robust deep learning approach to automatically segment all BM seen on MR to better capture the entire intracranial disease burden.Methods
Imaging: This study was conducted following approval from the Massachusetts General Hospital (MGH) Institutional Review Board. We prospectively acquired multi-sequence MR imaging from 77 patients (total of 163 timepoints) with brain metastases from MGH and the Dana Farber Institute with T1 pre-contrast, T1 post-contrast, T2, and FLAIR sequences. We also acquired expert segmentations of brain metastases for all patients from a neuroradiologist with 10+ years of experience. All images were registered to T2 space and resampled to 1 mm isotropic resolution. Other pre-processing included skull-stripping, N4 bias correction, and zero-mean intensity normalization. Analysis: We split our data into training (60 patients, 127 timepoints), validation (9 patients, 18 timepoints), and testing (8 patients, 18 timepoints) sets. For each timepoint in the training set, we extracted 40 patches of size 32x32x32 voxels (with left-right flipping used for data augmentation). We used the Nestorov Adaptive Moment Estimation (NADAM) optimizer with an initial learning rate of 10-6 to train a patchwise 3D fully convolutional U-Net4. We implement our neural network using DeepNeuro, a software package for machine learning in neuroimaging5. Due to the heavy class imbalance between normal tissue and BM, we used a weighted cross-entropy loss function where each voxel labeled as normal tissue was weighted down by a factor of 10 and all misclassifications performed by the network were weighted up by a factor of 5. Agreement between manual and automatic methods was assessed via the Dice similarity measure and lesion detection rate (percentage of lesions that are correctly labeled by the network).Results
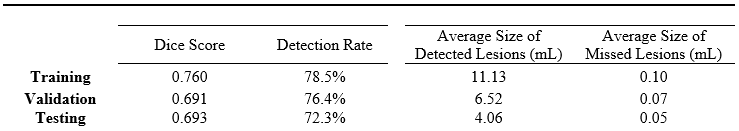
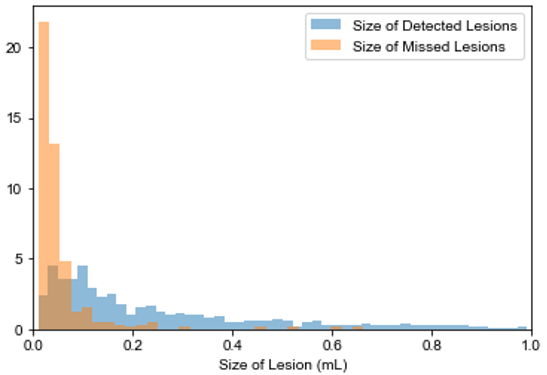
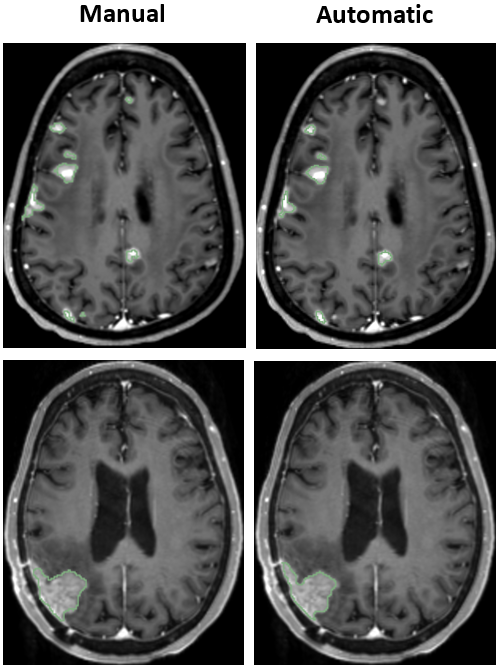
For BM segmentation, we report a mean dice score of 0.760, 0.691, and 0.693 and a mean detection rate 78.5%, 76.4%, and 72.3% on our training, validation, and testing sets respectively. Our entire results are summarized in Table 1. In particular, we note that micro-metastases (average size less than 0.10 mL) are difficult to segment and are occasionally missed. Figure 1 shows this relationship between detection and size of lesion. Representative axial slices of the segmentation performed by our U-Net is illustrated in Figure 2. A 3D rendering of the segmented metastatic lesions for one patient is presented in Figure 3.Discussion
In this study, we demonstrate that a fully automated, deep learning technique can be used to segment brain metastases in MR, enabling detailed volumetric measurements of individual lesions. We observe a tendency of our network to not segment micrometastases, especially small dural lesions located at the peripheries of the brain. We believe this is due to the similarity in shape, size and MR intensity of brain micrometastases and blood vessels. Nevertheless, a high detection rate coupled with accurate segmentations for detected lesions allows for longitudinal tracking of BM. This has implications in radiographic response assessment, and establishes an important step towards enabling its application in the clinical workflow.Conclusion
We demonstrate the potential for deep learning based techniques to aid in treatment response for brain metastases patients, by enabling fast and accurate lesion volumetric measurements.Acknowledgements
This project was supported by a training grant from the NIH Blueprint for Neuroscience Research (T90DA022759/R90DA023427) and the National Institute of Biomedical Imaging and Bioengineering (NIBIB) of the National Institutes of Health under award number 5T32EB1680 to K. Chang and J. Patel. The content is solely the responsibility of the authors and does not necessarily represent the official views of the National Institutes of Health.
This publication was supported from the Martinos Scholars fund to K. Hoebel. Its contents are solely the responsibility of the authors and do not necessarily represent the official views of the Martinos Scholars fund.
This study was supported by National Institutes of Health grants U01 CA154601, U24 CA180927, and U24 CA180918 to J. Kalpathy-Cramer and R01CA211238 to E. Gerstner.
We would like to acknowledge the GPU computing resources provided by the MGH and BWH Center for Clinical Data Science.
This research was carried out in whole or in part at the Athinoula A. Martinos Center for Biomedical Imaging at the Massachusetts General Hospital, using resources provided by the Center for Functional Neuroimaging Technologies, P41EB015896, a P41 Biotechnology Resource Grant supported by the National Institute of Biomedical Imaging and Bioengineering (NIBIB), National Institutes of Health.
References
1. Lin N, et al. Response assessment criteria for brain metastases: proposal from the RANO group. The Lancet Oncology 2015; 16(6): e270-e278. doi:10.1016/S1470-2045(15)70057-4.
2. Soffietti R, et al. Imaging clinical end points in brain metastases trials. CNS Oncology 2017; 6(4): 243-246. doi:10.2217/cns-2017-0017.
3. Bauknecht H, et al. Intra- and Interobserver variability of linear and volumetric measurements of brain metastases using contrast-enhanced magnetic resonance imaging. Investigative Radiology 2010; 45(1): 49-56. doi:10.1097/RLI.0b013e3181c02ed5.
4. Çiçek Ö, et al. 3D U-Net: Learning dense volumetric segmentation from sparse annotation. MICCAI 2016; 424-432. doi:10.1007/978-3-319-46723-8_49.
5. Beers A, et al. DeepNeuro: an open-source deep learning toolbox for neuroimaging. 2018. http://arxiv.org/abs/1808.04589.
Figures