0903
A Brain Morphometric MRI Study on Patients with Suprasellar Tumors: Preoperative and Postoperative AssessmentQingping Chen1,2, Jianyou Ying3, Zhentao Zuo1,2,4, Rui Wang3, Taoyang Yuan3, Lu Jin3, Chuzhong Li3, Songbai Gui3, Peng Zhao4, Chunhui Liu5, and Yazhuo Zhang3,5,6,7
1State Key Laboratory of Brain and Cognitive Science, Institute of Biophysics, Chinese Academy of Sciences, Beijing, China, 2Sino-Danish College, University of Chinese Academy of Sciences, Beijing, China, 3Beijing Neurosurgical Institute, Capital Medical University, Beijing, China, 4The Innovation Center of Excellence on Brain Science, Chinese Academy of Sciences, Beijing, China, 5Department of Neurosurgery, Beijing Tiantan Hospital, Capital Medical University, Beijing, China, 6Beijing Institute for Brain Disorders Brain Tumor Center, Beijing, China, 7China National Clinical Research Center for Neurological Diseases, Beijing, China
Synopsis
It has been reported that suprasellar tumors affect patients’ visual field and visual functional network. In this study, longitudinal brain morphometric assessment was performed pre- and post-operation based on 13 suprasellar tumors patients. The gray matter volume of rectus increases, but insular, caudate, and putamen decrease after
Introduction
Suprasellar tumors are the fourth most common intracranial tumors, resulting in many symptoms, such as endocrine problems, headache, and depression. As the suprasellar tumor grows, it will compress optic nerve and optic chiasm, leading to visual field defects1, 2. Resting state fMRI researches demonstrated the regional homogeneity was reduced in suprasellar tumors patients in visual cortex3. However, there is no brain structure morphology study on suprasellar tumors yet. We are wondering whether the suprasellar tumors would cause the morphological variation in frontal cortex nearby suprasellar tumors and visual cortex or not. MRI Voxel-Based Morphometry (VBM)4 as one of the most powerful tools can non-invasively explore the structural changes across the whole brain. In this study, the longitudinal morphometry of suprasellar tumors patients at preoperation was compared with that at postoperation using VBM.Methods
13 suprasellar tumors patients (8 females, 46.46±6.59 years) were scanned at Siemens prisma 3.0T MRI scanner (Siemens healthnieer, Erlangen, Germany) with a commercial 64-channel coil. They were given written informed consent prior to the study. The consent and protocol were approved by the IRB of the local hospital. The patients were scanned 3 times, before operation, 1 week and 1 month after operation. T1w images were acquired with 3D sagittal MPRAGE sequence (resolution of 0.8mm isotropic, FOV of 256mm*240mm, TI/TR/TE = 1000/2400/2.22ms, flip angle 8°, bandwidth = 220 Hz/px, iPAT = 2). The longitudinal voxel- and surface-based morphometry (VBM and SBM) were performed using CAT12 software (http://www.neuro.uni-jena.de/cat/) and SPM12 software (https://www.fil.ion.ucl.ac.uk/spm/software/spm12/), both implemented in Matlab (The Mathworks Inc., USA). Then the data was smoothed with a Gaussian kernel of 8 mm (FWHM) for VBM, and 15mm for SBM. Finally, Data underwent automated quality assurance implemented in CAT12. ROI analysis was also performed in Matlab.Results
In Fig.1A, whole brain VBM analysis indicated that GM volume in the rectus at 1 month postoperation was significantly larger than preoperation (p<0.05, FDR corrected). One way ANOVA analysis was performed on rectus region (see Fig.1B). There were significant main effects among different states of suprasellar tumors (F(2) = 55.10, p<0.0001). Paired t-test results showed the GM volume in rectus at postoperation was significantly larger than before operation (t(12) = 8.611, p<0.001 for 1 week; t(12) = 7.692, p<0.001 for 1 month). In bilateral insula, caudate and putamen, the GM volume at postoperative 1 month was significantly higher than at preoperation (see Fig.2A). ROI analysis showed there were significant main effects among the preoperative and postoperative states (F(2) = 27.65, p<0.0001 for left insular; F(2) = 7.125, p<0.0001 for right insular). In Fig.2B, paired t-test results showed that the GM volume of bilateral insula at postoperation was significantly smaller than at preoperation (t(12) = 8.815, p<0.001 for 1 week, and t(12) = 9.868, p<0.0001 for 1 month in left insula; t(12) = 6.996, p<0.001 for 1 week, and t(12) = 7.738, p<0.001 for 1 month in right insula). Fig.3A presented a significant correlation between chiasmal lift length and GM volume of insula before operation (r2 = 0.409, p<0.05). And there was also a significant correlation between the course of suprasellar tumors and GM volume of left insula at postoperative 1 month (r2 = 0.319, p<0.05, see Fig.3B). The course of suprasellar tumors is the time patients have suffered this disease. Fig.4 presented surface thickness SBM analysis at 1 month postoperation versus preoperation (p<0.001, cluster-level-corrected). In left medial-temporal lobe (t(24) = 5.19), left insular (t(24) = 4.15) and bilateral ACC(t(24) = 4.26 for left ACC; t(24) = 4.37 for right ACC), the surface thickness was significantly thicker at 1 month postoperation than at preprocession. However, in the dorsal ACC (t(24) = 4.22) and right temporal-occipital fusiform (t(24) = 4.51), the surface thickness was significantly thinner at 1 month postoperation.Discussion and Conclusion
Suprasellar tumors significantly change cerebral morphology, especially in rectus, insula, caudate and putamen, which may be caused by the compression of suprasellar tumors in the sellar region. In addition, the suprasellar tumors could suppress the optic nerve and optic chiasma, which can lead to the alterations of surface thickness in the high-level visual cortex, such as fusiform gyrus. The deformation-based morphometric analysis will help us understand how suprasellar tumors reshape brain anatomy in the future.Acknowledgements
This work was supported in part by the Ministry of Science and Technology of China (2015CB351701), the National Natural Science Foundation of China (31730039, 81871350), National Major Scientific Instruments and Equipment Development Project (ZDYZ2015-2), Chinese Academy of Sciences Strategic Priority Research Program B grants (XDBS01000000), and Beijing Municipal Science & Technology Commission (Grant No.Z171100000117002).References
- Molitch, M. E. (2014). Nonfunctioning pituitary tumors. Handbook of Clinical Neurology. https://doi.org/10.1016/B978-0-444-59602-4.00012-5.
- Liu, J. K. (2018). Suprasellar Tumors (Part 2). Journal of Neurological Surgery, Part B: Skull Base. https://doi.org/10.1055/s-0038-1639376.
- Song, G., Qiu, J., Li, C., Li, J., Gui, S., Zhu, H., & Zhang, Y. (2017). Alterations of regional homogeneity and functional connectivity in pituitary adenoma patients with visual impairment. Scientific Reports. https://doi.org/10.1038/s41598-017-13214-5.
- Ashburner, J., & Friston, K. J. (2000). Voxel-based morphometry - The methods. NeuroImage. https://doi.org/10.1006/nimg.2000.0582.
Figures

Fig. 1. Statistical results of VBM
analysis and ROI analysis in rectus. A) Results of VBM analysis of suprasellar
tumors patients 1 month after operation were compared with preoperation (p<0.05,
FDR corrected). The GM volume 1 month after operation of rectus (colored area) is
significantly larger than preoperation. B) ROI analysis of rectus, the
GM volume before operation (Pre), 1 week after operation (1W), 1 month after operation
(1M). The GM volume of rectus
at postoperation was significantly larger than that at preoperation (** p<0.01).

Fig. 2. Statistical results of VBM analysis and ROI analysis in insula. A) Results of VBM analysis of suprasellar tumors patients before operation were compared with 1 month after operation (p<0.05, FDR corrected). The GM volume at 1 month postoperation of insula, caudate and putamen (the colored areas) were significantly smaller than preoperation. B) Results of ROI analysis. The GM volume of left (L) insula and right (R) insular before operation (Pre), 1 week after operation (1W), and 1 month after operation (1M). The GM volume of insula after operation was significantly smaller than that before operation (*** p<0.001).

Fig.3. The relationship between chiasmal lift length and GM volume of rectus, and between course of suprasellar tumors and GM volume of left insula. A) Correlation between chiasmal lift length and GM volume of rectus before operation (Pearson’s coefficient r2 = 0.409, p<0.05). B) Correlation between course of suprasellar tumors and GM volume of left insula 1 month after operation (Pearson’s coefficient r2 = 0.319, p<0.05). The course of suprasellar tumors is the time patients have suffered from suprasellar tumors.
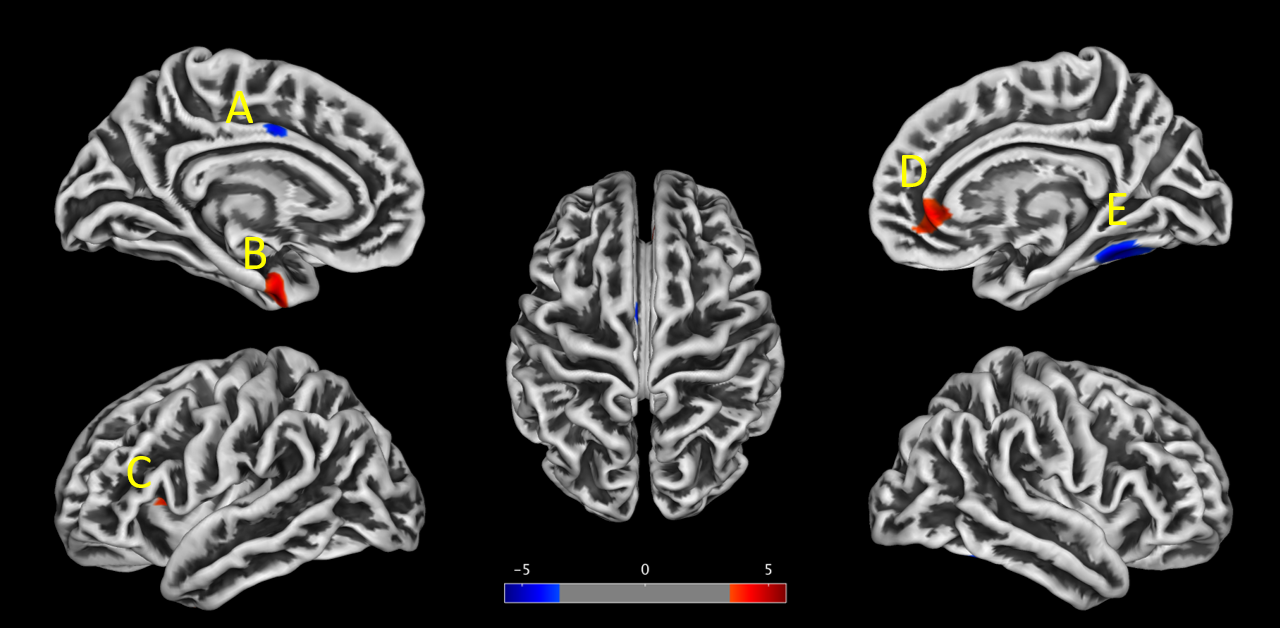
Fig.4. Results of SBM analysis of suprasellar tumors patients 1
month after operation was compared with before operation (p<0.001, cluster level corrected). The figure showed the surface
thickness 1 month after surgery was significantly thicker than before operation
(red areas), or significantly smaller than before operation (blue areas). (A) Medial
temporal lobe; (B) Dorsal anterior cingulate cortex; (C) Left insula; (D) Right
anterior cingulate cortex; (E) Right fusiform gyrus.