0901
Voxelwise correlation between vascular parameters obtained with ASL and DSC as predictor of IDH-mutation status in non-enhancing glioma1Department of Radiology & Nuclear Medicine, Erasmus Medical Centre, Rotterdam, Netherlands, 2Department of Neurosurgery, Erasmus Medical Centre, Rotterdam, Netherlands, 3Department of Neurology, Erasmus MC, Rotterdam, Netherlands, 4Department of Pathology, Erasmus MC, Rotterdam, Netherlands
Synopsis
Previous studies have shown good correlation between ASL and DSC vascular parameters as predictors of glioma grade, indication an option to omit DSC imaging in light of the recent finding of gadolinium deposition in the brain. However, in general these comparative studies were conducted before the recent update of the World Health Organisation classification of brain tumours. This study shows the potential of voxelwise correlations of vascular parameters obtained with ASL and DSC as predictors of IDH-mutation status in non-enhancing glioma and highlights that IDH-mutation status should be included in comparative studies of ASL and DSC vascular parameters in glioma.
Introduction
Dynamic susceptibility contrast (DSC) based measurement of cerebral blood volume (CBV) can be used as predictor of glioma grade and progression-free and overall survival1. Arterial spin labelling (ASL) allows for measurements of cerebral blood flow (CBF) without the use of exogenous contrast agents. Previous studies have shown good correlation between ASL and DSC vascular measurements as predictors of glioma grade2, indicating an option to omit DSC imaging in light of the recent finding of gadolinium deposition in the brain. However, the majority of these comparative studies were conducted before the introduction of the recently updated World Health Organisation classification of brain tumours3, in which molecular diagnosis has become pertinent for glioma classification. One such classification factor is whether or not there is a mutation in the isocitrate dehydrogenase (IDH) encoding gene, which has recently been shown related to the vascular phenotype of glioma with more angiogenic profiles corresponding to more aggressive IDH-wildtype glioma4. Here we investigate the effect of IDH-mutation status on the correlation between ASL and DSC-based perfusion measurements.Methods
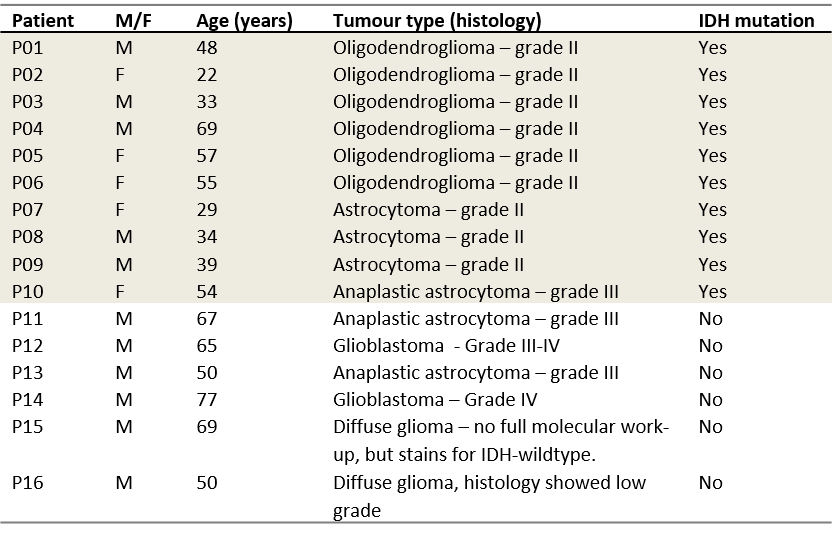
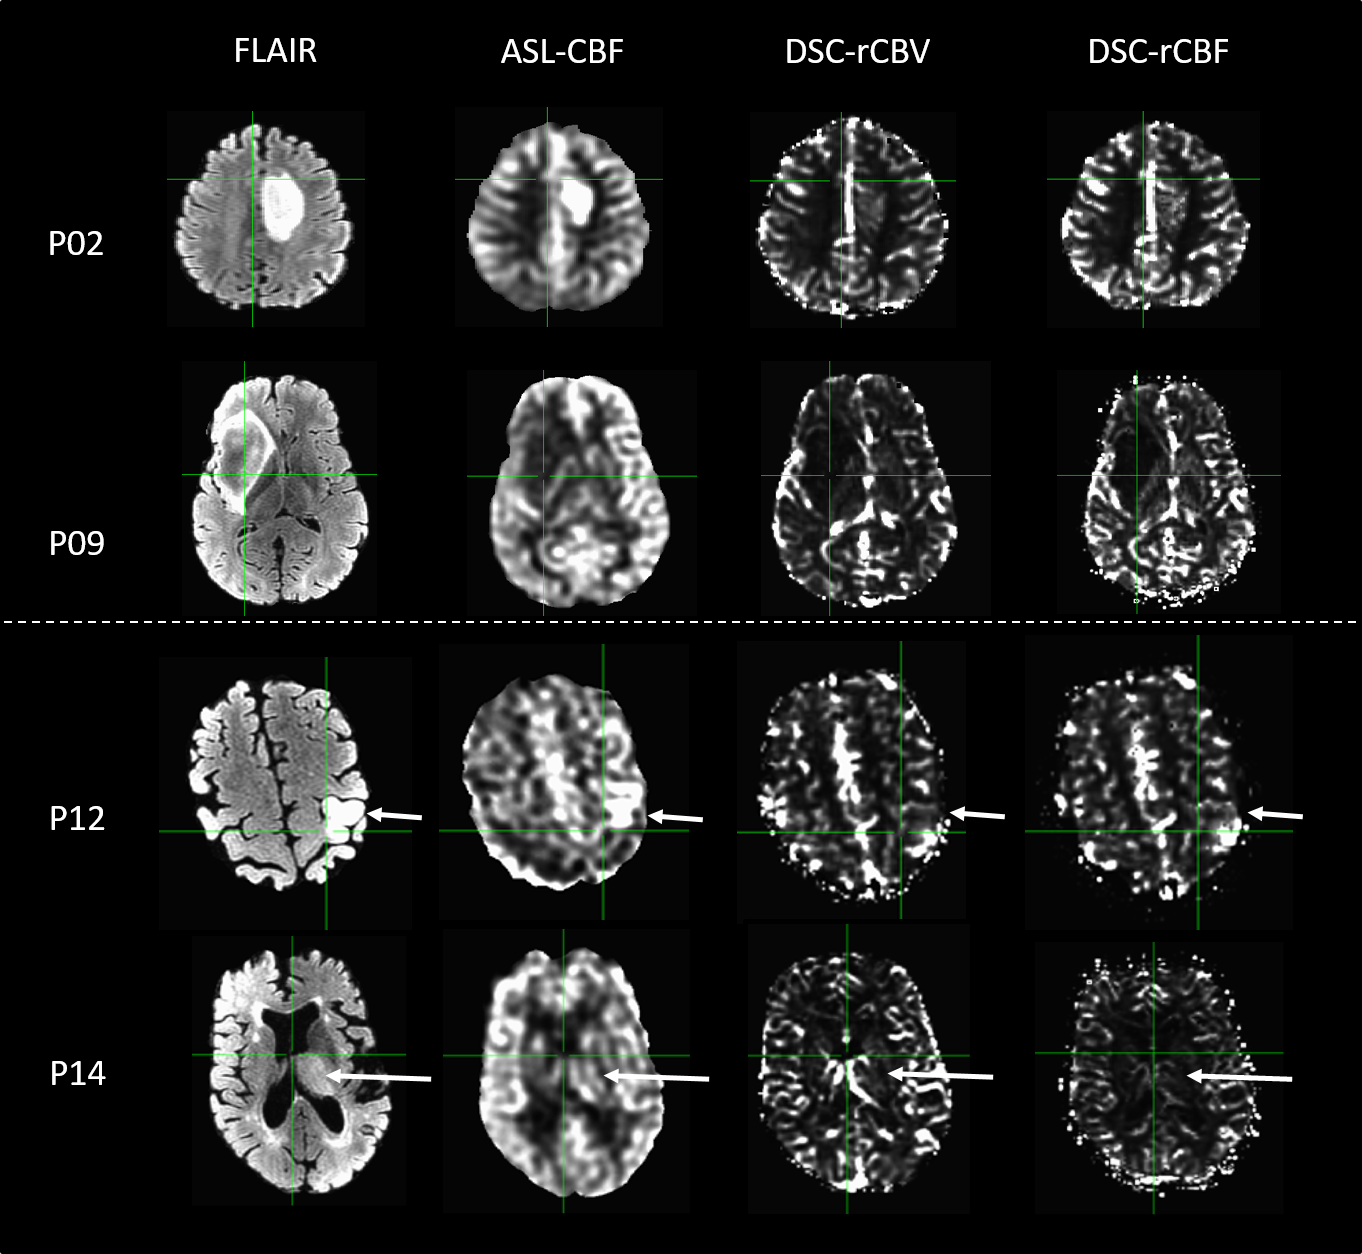
Sixteen patients with non-enhancing glioma and confirmed IDH-mutation status (next generation sequencing, 6 IDH-wildtype and 10 IDH-mutated) are included within this study. Patient characteristics are stated in Table 1. Patients underwent 3T MRI scanning (GE, Milwaukee, WI, USA) with a standardised brain tumour imaging protocol extended with advanced imaging. Image acquisition included 3D sagittal CUBE FLAIR (0.8x0.8 mm2 in plane resolution, slice thickness 1.6mm, TR/TE/TI= 6.1ms/2.1ms/1897ms ), 3D spiral pseudocontinuous ASL with time-encoded labelling ( 7 effective label delays from 0.8 to 2 s, reconstruction matrix 128x128x42, resolution 1.9x1.9x3.5 mm3), and 2D DSC imaging (122 TRs, TR/TE 1500m/18.6ms, 15 slices, voxel size: 1.875 x 1.875 x 4 mm3) in which a bolus of 7.5ml of gadolinium-based contrast agent (Gadovist, Bayer, Leverkussen, GE) was injected. A pre-load bolus of equal size was given approximately 5 minutes prior to DSC imaging.
DSC images were motion corrected (mcflirt in FSL, version 5.0.9, Oxford, UK) and linearly registered to the FLAIR images (flirt in FSL). Relative CBV (rCBV) maps were calculated via previously described methods5. In addition, relative CBF maps were calculated with verbena in FSL, which uses a Bayesian framework for fitting rCBF6. Transit time corrected CBF maps were calculated from the pCASL imaging series, based on previously described methods7 and linearly registered to the FLAIR images.
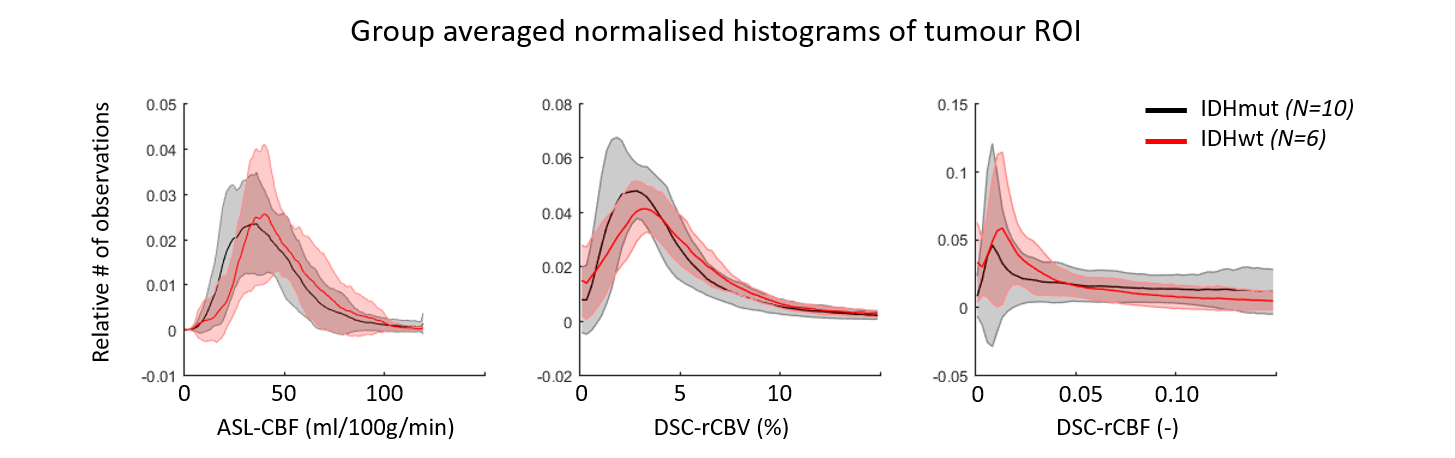
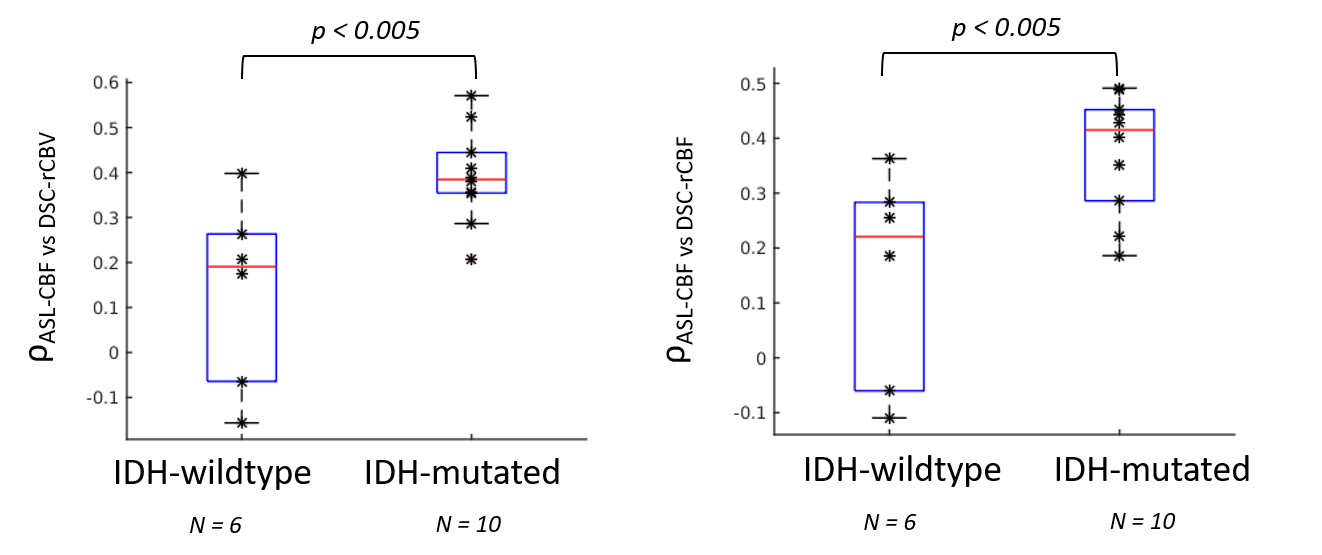
The glioma region of interest (ROI) was determined via manual segmentation of the hyperintense FLAIR region. Normalised histograms were calculated across the ROI to investigate differences in ASL-CBF, DSC-rCBV, and DSC-rCBF between IDH-mutated and IDH-wildtype tumours. Voxel-wise Pearson’s linear correlation coefficients (ρ) within this ROI were calculated between ASL-CBF and DSC-rCBV, and between ASL-CBF and DSC-rCBF.
Results
The normalised histograms (Figure 1) indicate that IDH-wildtype glioma has higher values for ASL-CBF, DSC-rCBV, and DSC-rCBF than IDH-mutated glioma. IDH-wildtype glioma has a significantly lower ρASL-CBF vs DSC-rCBV and ρASL-CBF vs DSC-rCBF than IDH-mutated glioma (0.14 ± 0.21 and 0.15 ± 0.19 compared to 0.39 ± 0.11 and 0.38 ± 0.11, respectively, two-sample t-tests p < 0.005, Figures 2 & 3).
Discussion
To the best of our knowledge this study is the first to indicate that IDH-mutation status of non-enhancing glioma may affect the correlation between ASL-CBF and DSC-rCBF/rCBV. The decreased correlation between ASL and DSC-based vascular parameters in IDH-wildtype gliomas may be due to the more angiogenic phenotype in these more aggressive tumours, including irregular vasculature such as larger and leaky vessels8. This in turn can lead to arteriovenous shunting of blood, which will result in overestimation of perfusion in ASL due to presence of labelled water in the venous vasculature9.
This works shows the potential of voxelwise correlations of ASL-CBF and DSC-rCBF/DSC-rCBV as predictor of IDH-mutation status in non-enhancing glioma and highlights that IDH-mutation status should not be neglected when performing comparative studies of ASL and DSC perfusion parameters in glioma. Future work includes expansion of the current patient cohort (part of the ongoing iGENE study) and matching the MRI vascular parameters with their histological counterparts in targeted biopsies of glioma tissue.
Acknowledgements
No acknowledgement found.References
- Law, M. et al. Gliomas: Predicting Time to Progression or Survival with Cerebral Blood Volume Measurements at Dynamic Susceptibility-weighted Contrast-enhanced Perfusion MR Imaging. Radiology (2008). doi:10.1148/radiol.2472070898
- Grade, M. et al. A neuroradiologist’s guide to arterial spin labeling MRI in clinical practice. Neuroradiology (2015). doi:10.1007/s00234-015-1571-z
- Louis, D. N. et al. The 2016 World Health Organization Classification of Tumors of the Central Nervous System: a summary. Acta Neuropathologica 131, 803–820 (2016).
- Zhang, L. et al. IDH mutation status is associated with distinct vascular gene expression signatures in lower-grade gliomas. Neuro. Oncol. (2018). doi:10.1093/neuonc/noy088
- Kellner, E. et al. MR evaluation of vessel size imaging of human gliomas: Validation by histopathology. J. Magn. Reson. Imaging 42, 1117–1125 (2015).
- Chappell, M. A., Mehndiratta, A. & Calamante, F. Correcting for large vessel contamination in dynamic susceptibility contrast perfusion MRI by extension to a physiological model of the vasculature. Magn. Reson. Med. 74, 280–290 (2015).
- Dai, W., Shankaranarayanan, A. & Alsop, D. C. Volumetric measurement of perfusion and arterial transit delay using hadamard encoded continuous arterial spin labeling. Magn. Reson. Med. 69, 1014–1022 (2013).
- Conroy, S., Wagemakers, M., Walenkamp, A. M. E., Kruyt, F. A. E. & den Dunnen, W. F. A. Novel insights into vascularization patterns and angiogenic factors in glioblastoma subclasses. J. Neurooncol. (2017). doi:10.1007/s11060-016-2269-8
- Wolf, R. L., Wang, J., Detre, J. A., Zager, E. L. & Hurst, R. W. Arteriovenous shunt visualization in arteriovenous malformations with arterial spin-labeling MR imaging. Am. J. Neuroradiol. 29, 681–687 (2008).
Figures