0900
Basal ganglia iron deposition as a biomarker of brain tumor severity1Radiology, Medical College of Wisconsin, Milwaukee, WI, United States, 2Biomedical Engineering, Medical College of Wisconsin, Milwaukee, WI, United States, 3Biophysics, Medical College of Wisconsin, Milwaukee, WI, United States
Synopsis
This study utilized quantitative susceptibility mapping (QSM) to investigate basal ganglia iron deposition in 27 patients diagnosed with gliomas. Basal ganglia QSM values of patients with glioblastomas were found to be higher than those of patients with tumors of lower grades, suggesting that iron deposition in the basal ganglia may serve as a biomarker of brain tumor severity.
Introduction
Gliomas are primary brain tumors that arise from glia, cells that surround and provide a variety of supportive functions for neurons. Since glioblastomas – the most severe subtype of gliomas – develop quickly and have a poor prognosis,1 further research is needed to improve their diagnosis and treatment. Recent interest has focused on the role of iron in tumor pathophysiology, with gliomas altering iron metabolism and transport in ways that result in net iron influx to meet increased cellular demand.2–4 Tissue iron deposition can be measured in vivo using quantitative susceptibility mapping (QSM), a technique that extracts the magnetic susceptibility of tissue from gradient echo phase sequence data generated during an MRI scan.5 This study used QSM to investigate how basal ganglia (BG) iron concentrations may be altered in patients with gliomas.Methods
This IRB-approved study involved 27 patients (16 males and 11 females) diagnosed with gliomas (18 astrocytomas and 9 oligodendrogliomas; 10 grade II, 4 grade III, 13 grade IV) and ranging from 24 to 70 years old. T1, T1+C, T2, T2-FLAIR, and SWAN imaging were collected at 3.0T. QSM maps were reconstructed using VP-QSM,6 and all images were affinely co-registered using IB Delta SuiteTM software (Imaging Biometrics, Milwaukee, WI). Quantitative delta T1 (qDT1) maps7 were created from the difference of standardized T1 and standardized T1+C images, also using IB Delta SuiteTM.
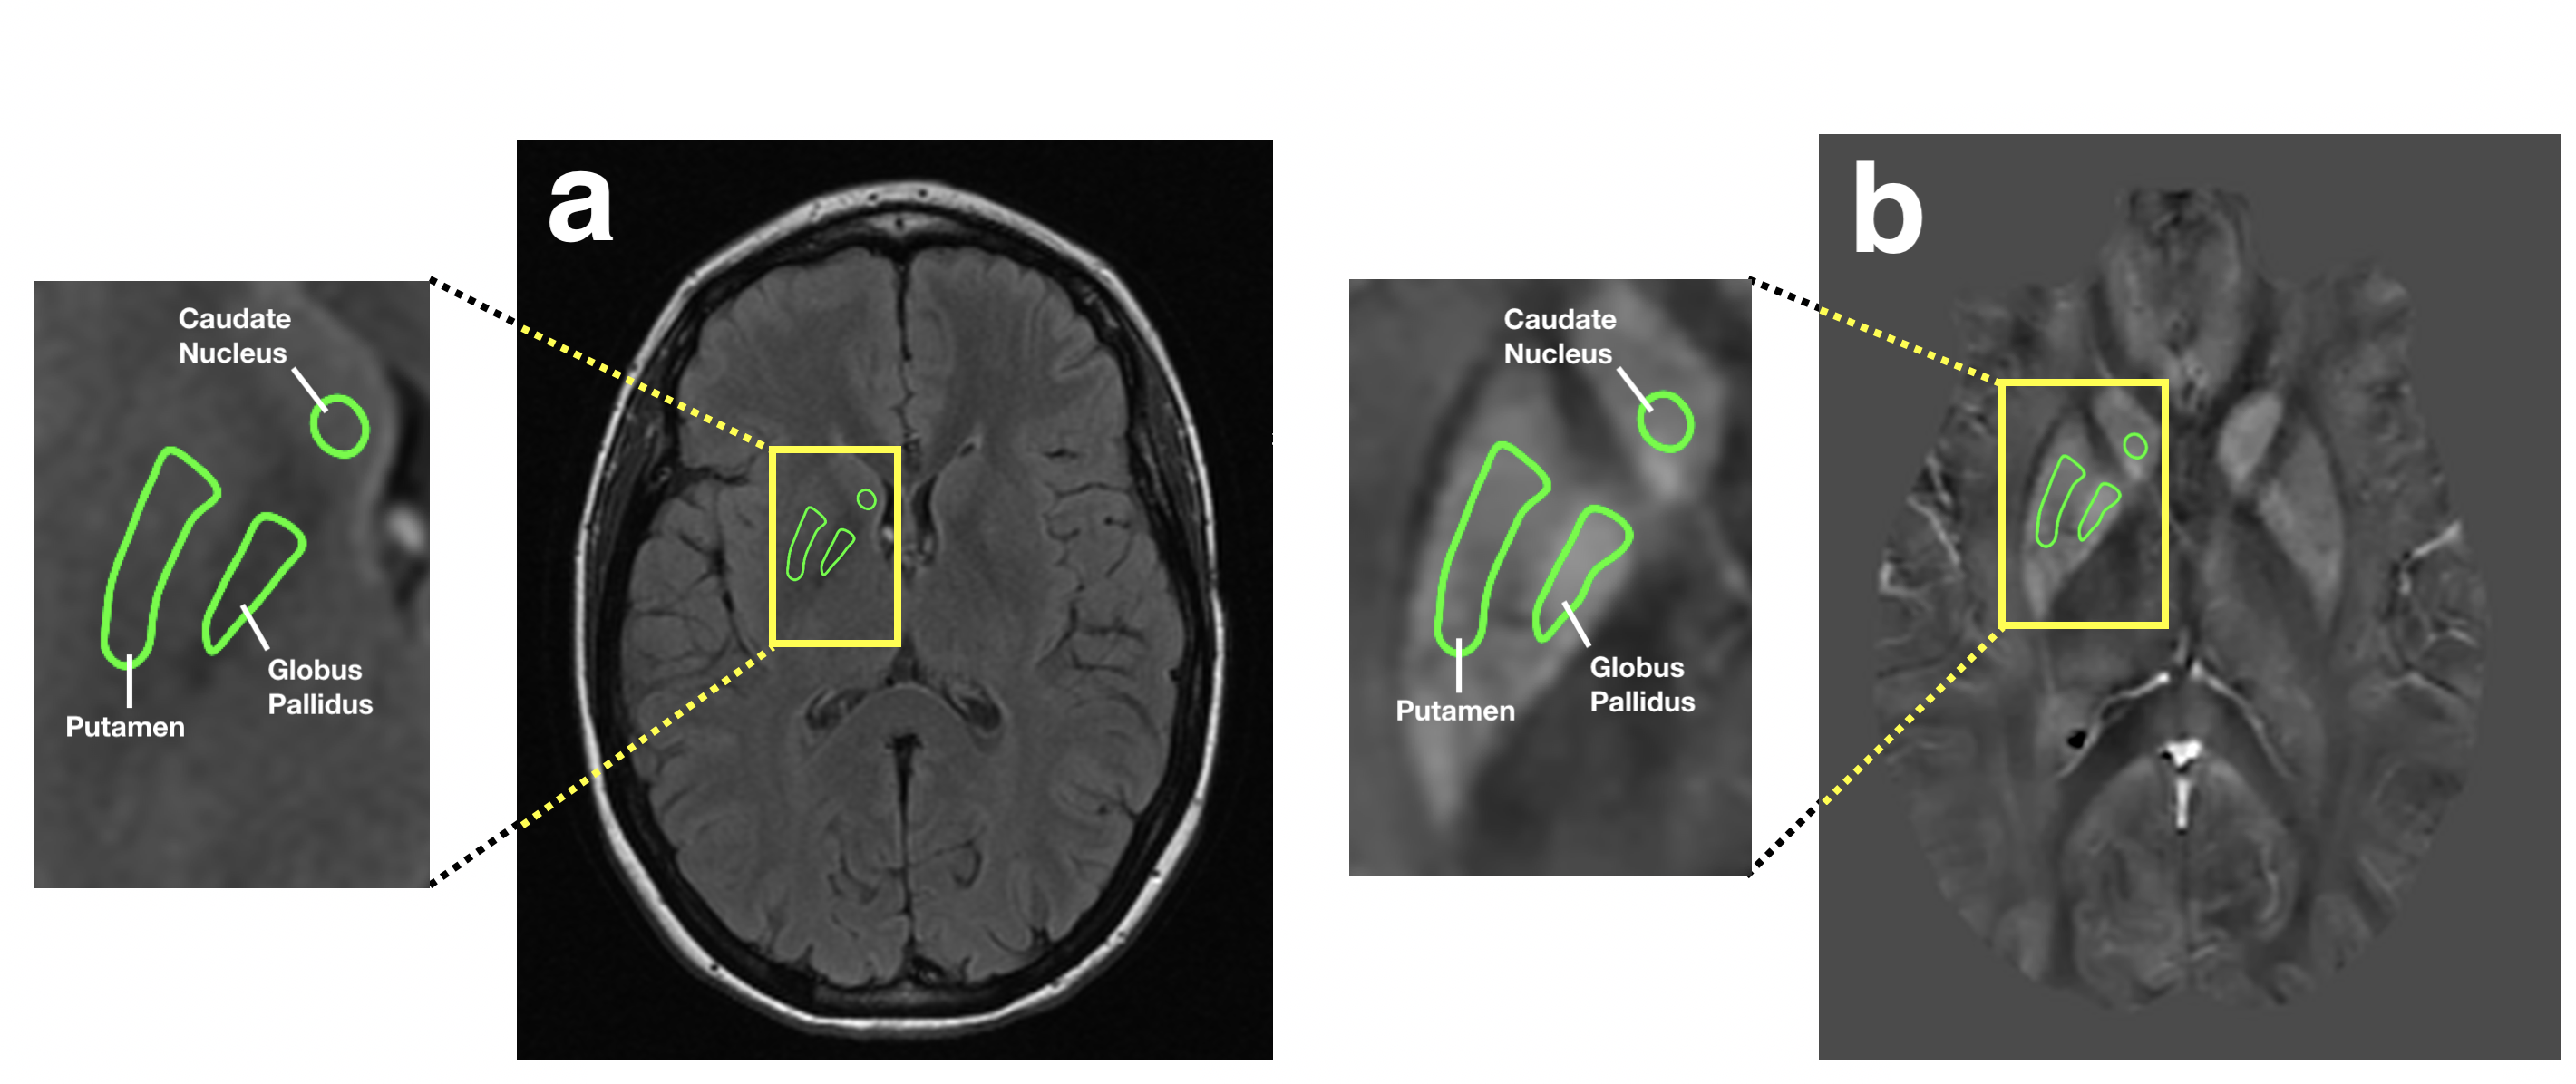
Regions of interest (ROIs) for the caudate, putamen, and globus pallidus were manually drawn on T2 and T2-FLAIR images (Figure 1a), then transferred to their corresponding QSM maps (Figure 1b). Mean voxel intensities for all ROIs were averaged across multiple slices to obtain one QSM value per tissue type per patient. The resulting QSM values for the caudate, putamen, and globus pallidus were further averaged to obtain one overall BG QSM value for each patient.
Two-tailed Mann-Whitney U tests were used to compare BG QSM values between groups of patients based on sex and tumor grade. The overall survival (OS) was compared using Kaplan-Meier analysis.
Results
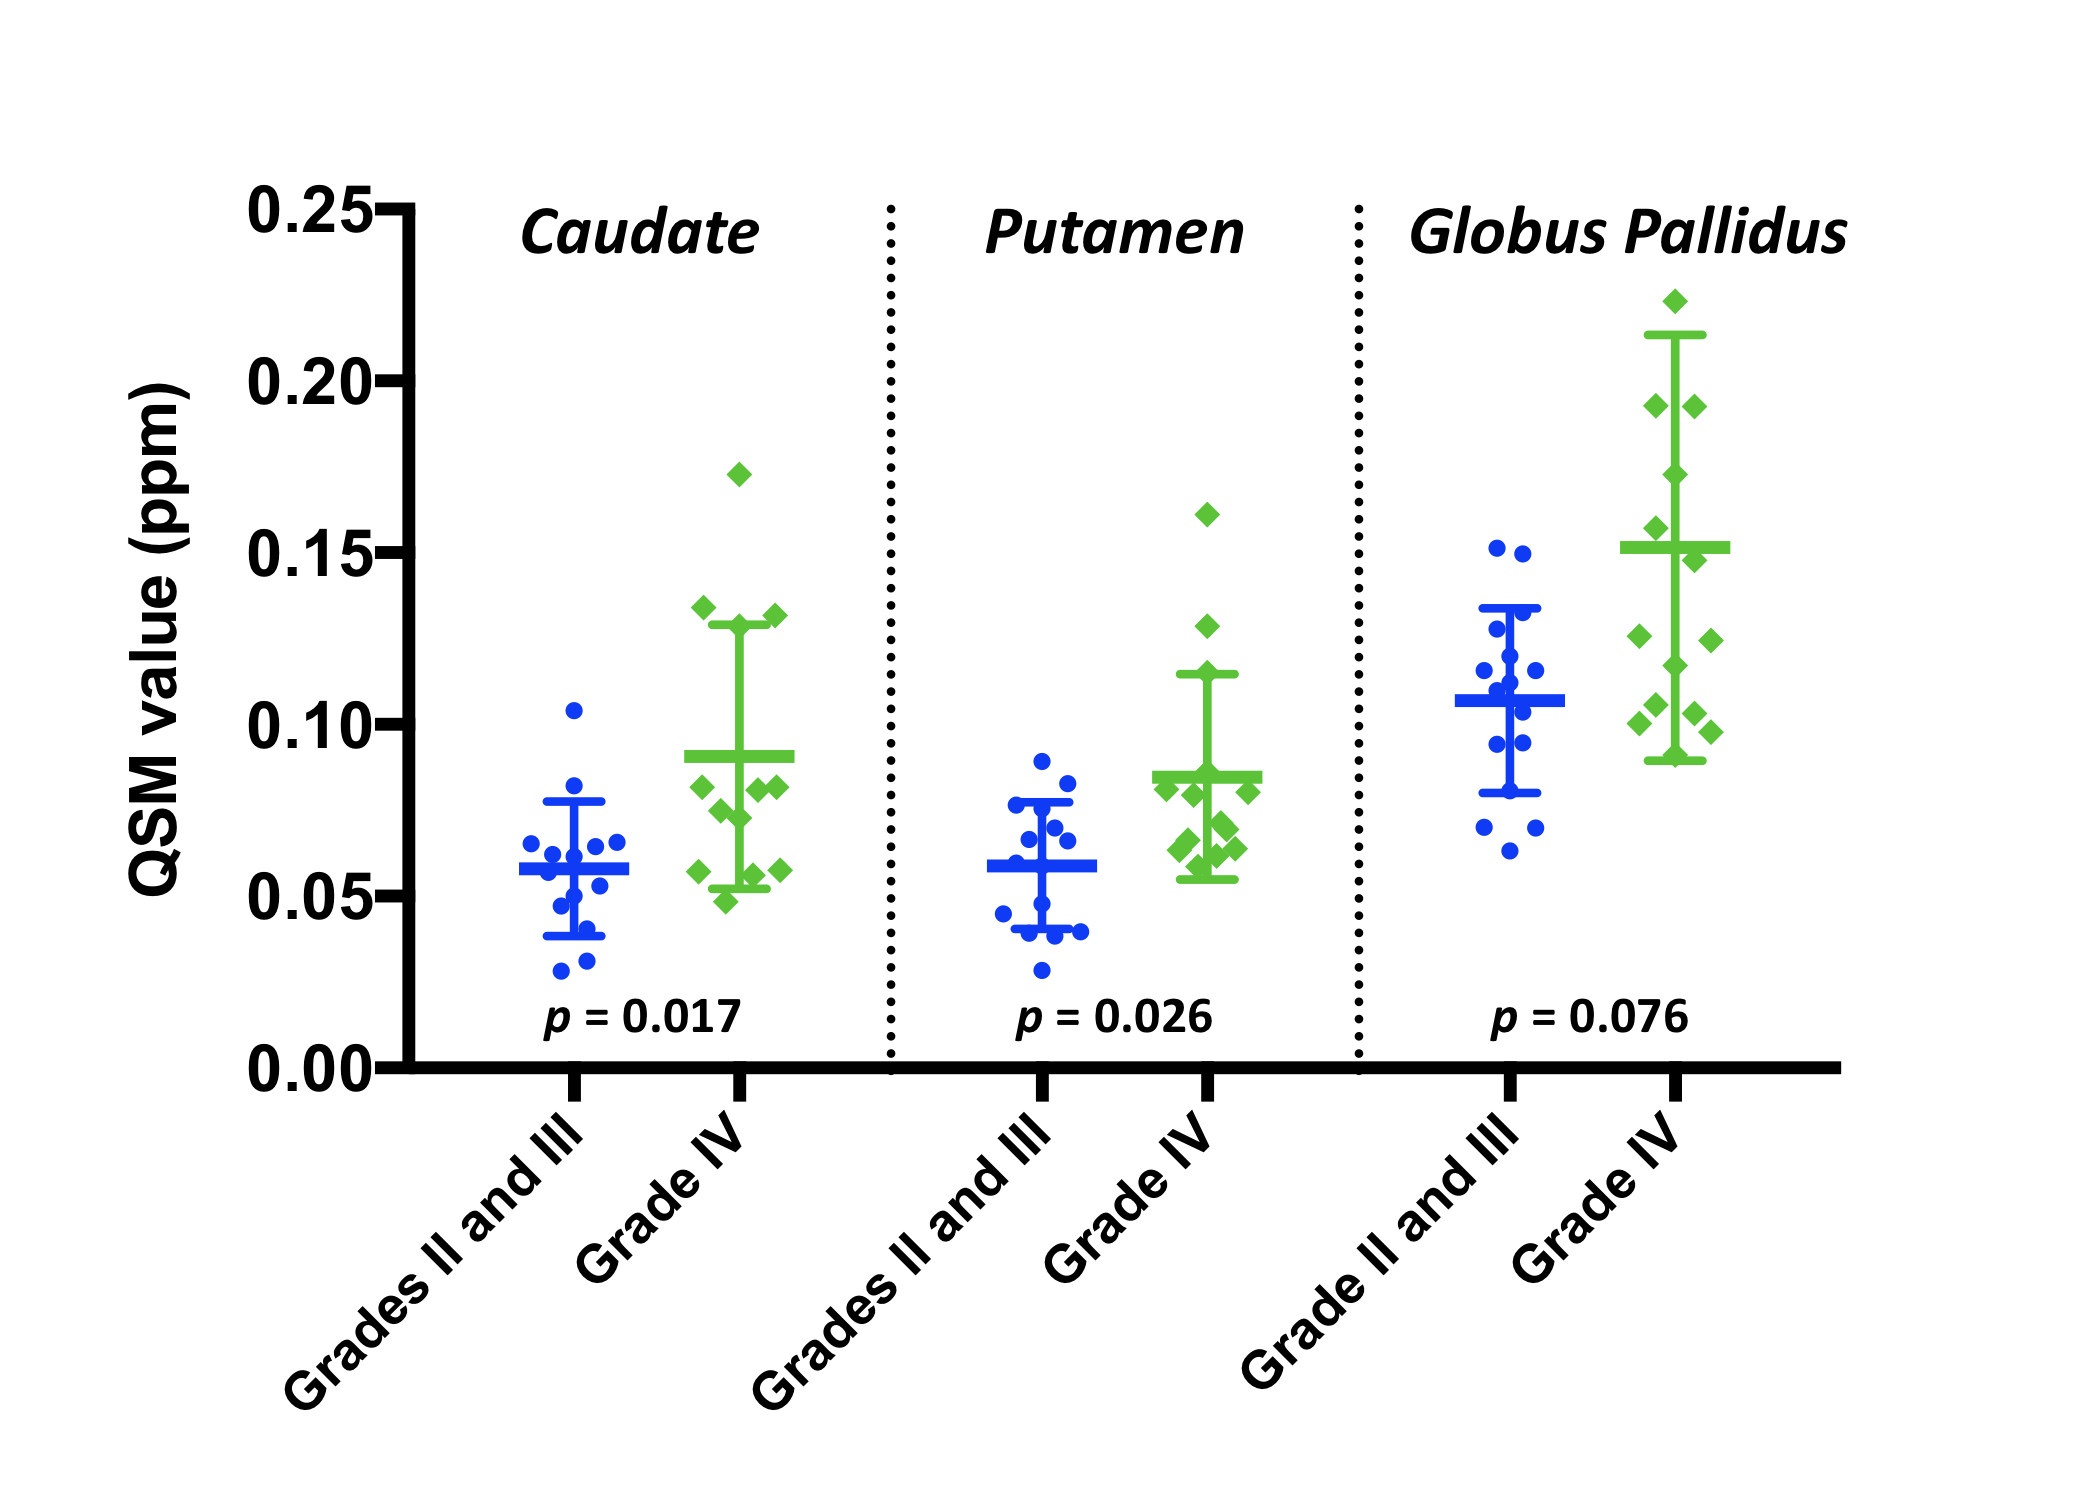
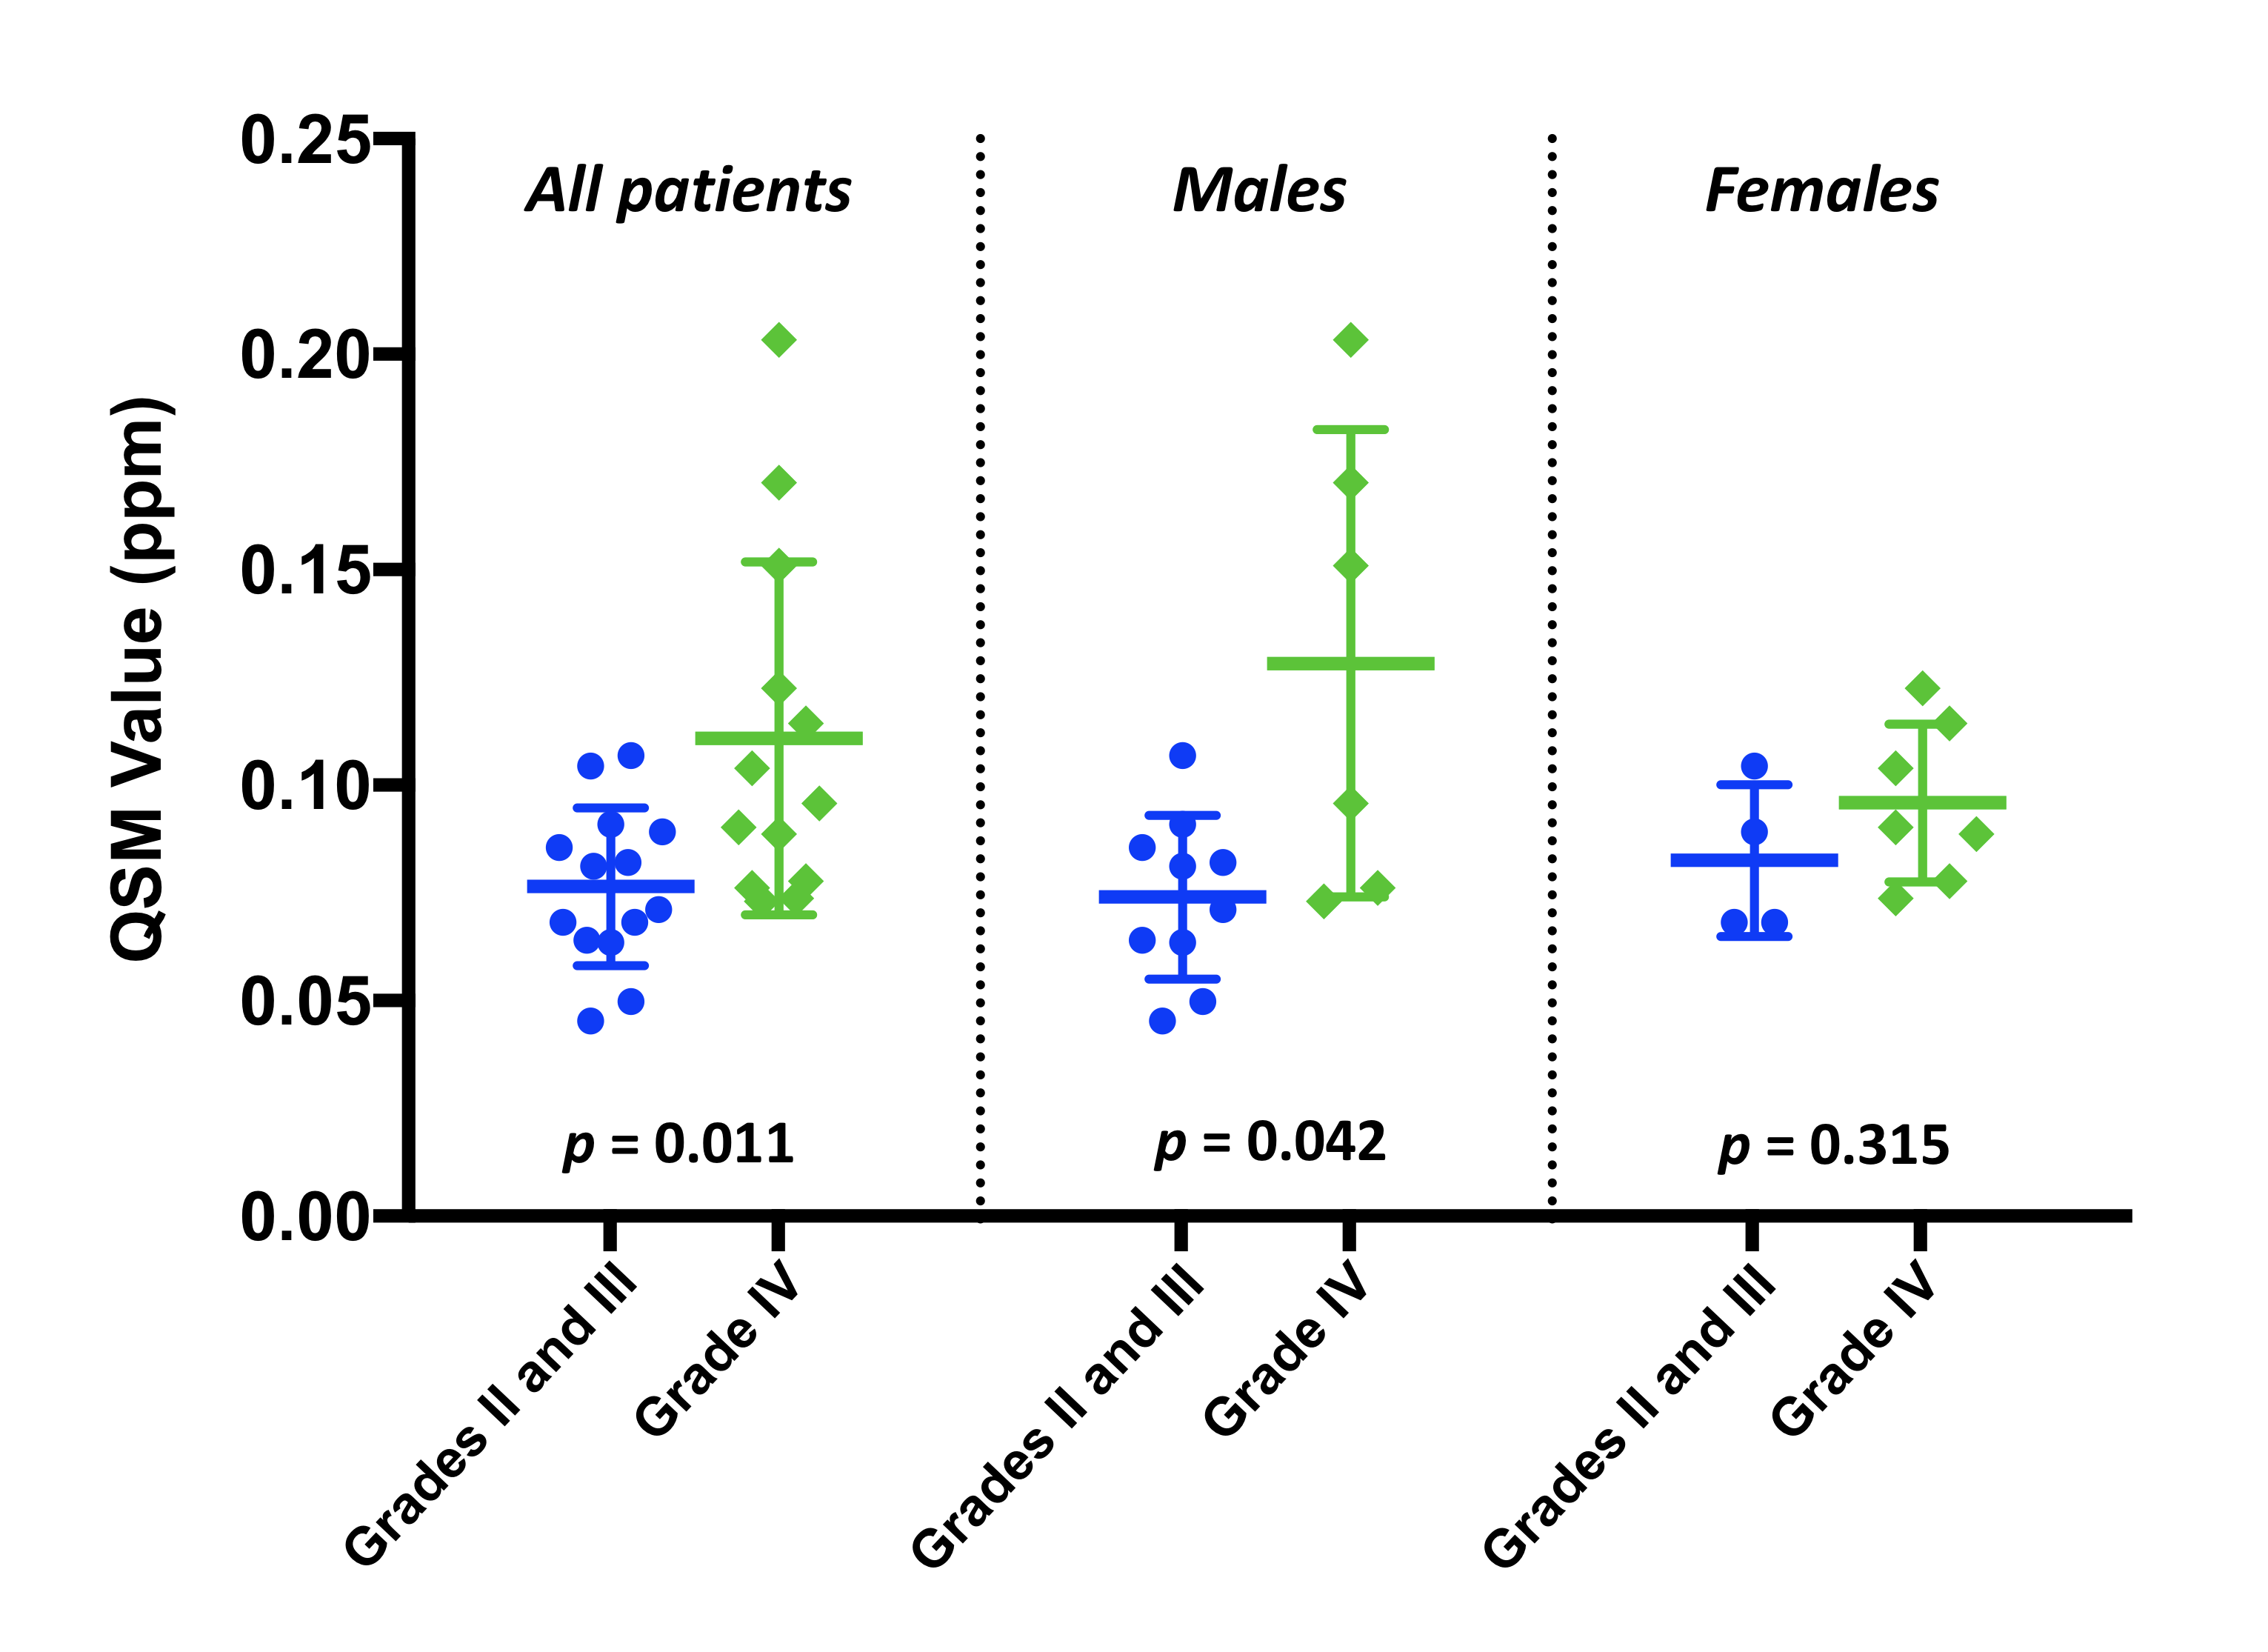
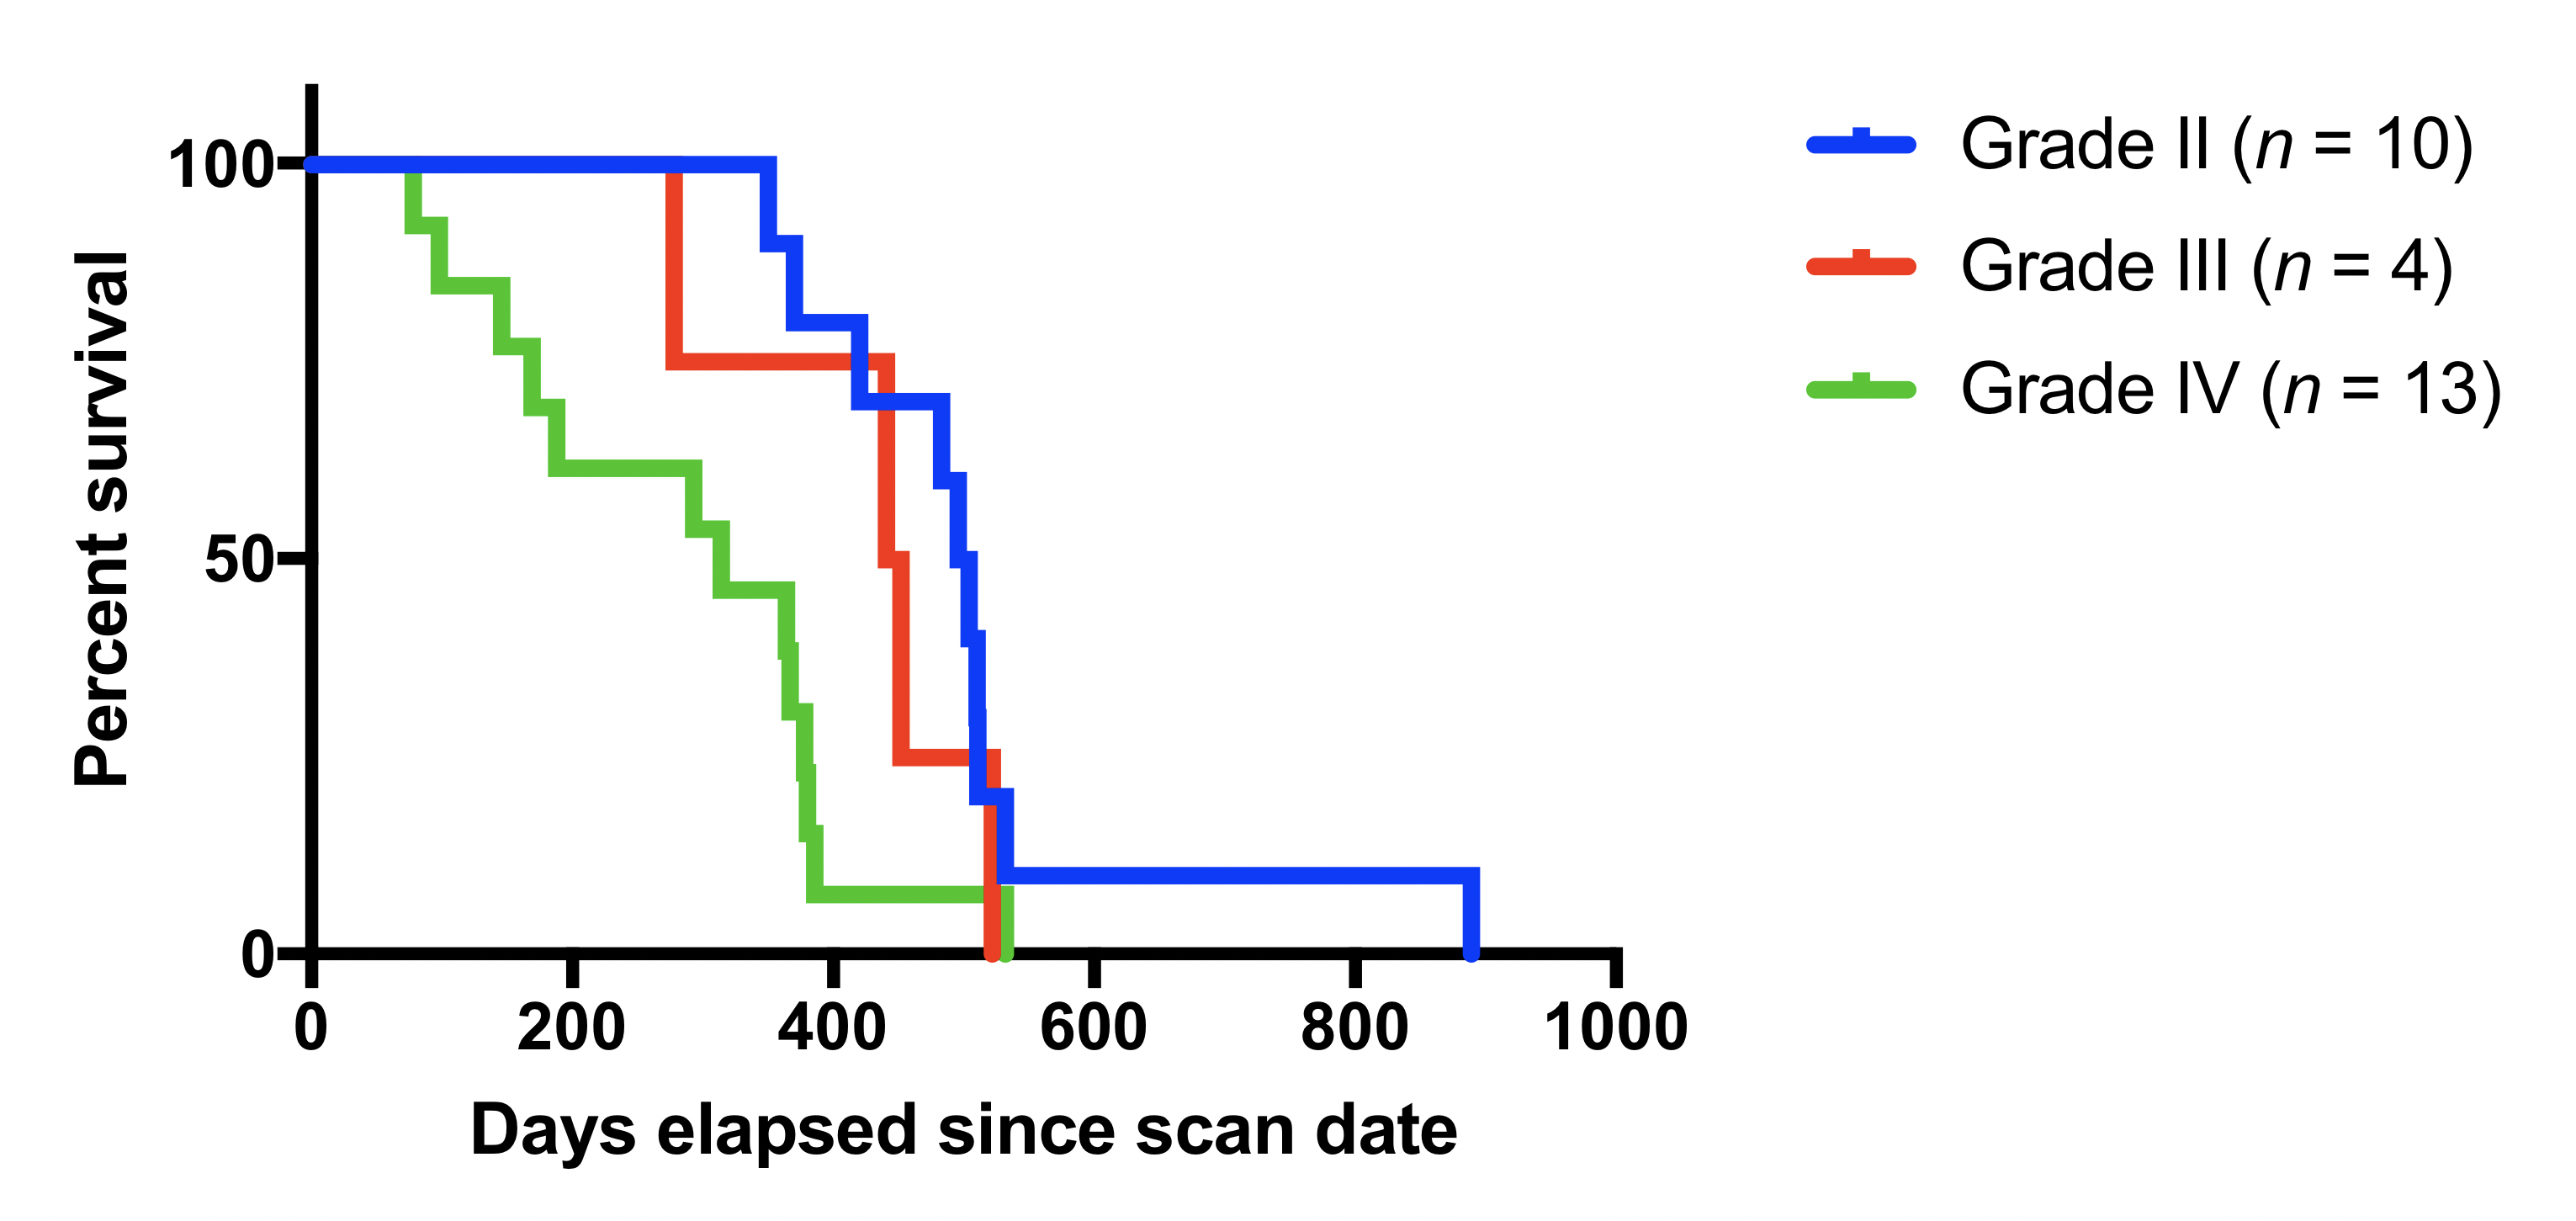
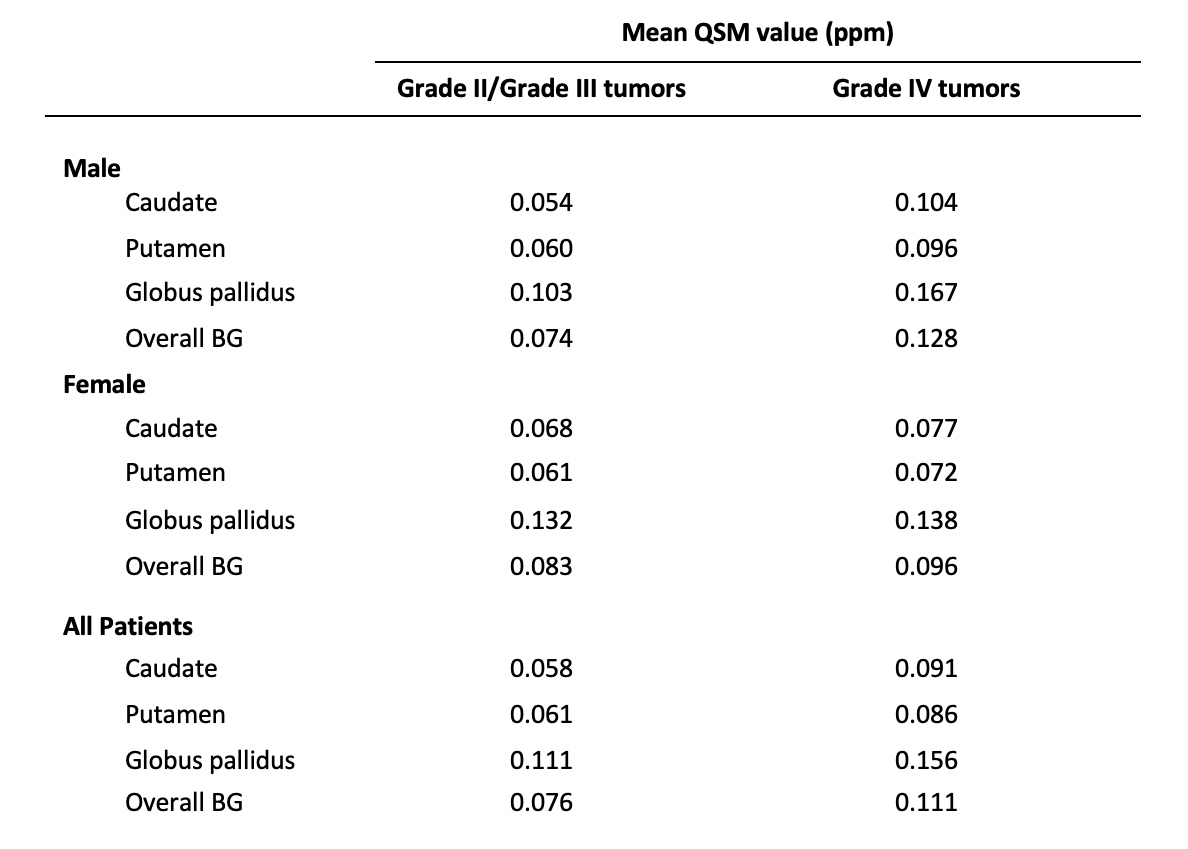
BG QSM values for patients with glioblastomas (World Health Organization grade IV tumors) were higher than for patients with grade II and grade III tumors. These differences were statistically significant for the caudate and putamen (p < 0.05) (Figure 2). Differences in overall averaged BG QSM values were statistically significant in all patients (p < 0.05), but when stratified by gender, this significance was only retained in males (Figure 3). Patients with glioblastomas also experienced significantly reduced survival compared to patients with grade II and grade III tumors (p < 0.05) (Figure 4). Table 1 reports QSM values for individual BG regions.Discussion
While T2-shortening in the basal ganglia of brain tumor patients has been previously reported,8 the lack of specificity in relaxometry-based studies does not allow for specific elements to be identified. The usage of QSM in the present study ascertains that the observed effects are due to iron accumulation. The mechanism of iron delivery, however, remains unclear. Since we observed no contrast in the BG on qDT1 maps, the blood-brain barrier is presumably intact and the direct transfer of iron between plasma and tissue is unlikely. However, high levels of ferritin in the cerebrospinal fluid of patients with glioblastoma9 suggest CSF as an alternate means of iron transport to neural tissue.
A second question is whether the increased BG iron is a direct consequence of tumor development, or if the BG iron deposition promotes greater tumor growth or aggression. To this end, further research may investigate whether increased BG iron levels appear before, during, or after tumor initiation and growth. The gender differences observed in our study also warrant further investigation: it is possible that the higher levels of BG iron observed in males may be related to the higher incidence of glioblastoma in men.10 Finally, we note that due to a lack of available QSM data, no healthy individuals were included in our analysis. Directly comparing the BG QSM values of patients with and without tumors is a logical next step and may be addressed in subsequent work.
Conclusion
This study demonstrates that in patients with severe brain tumors, increased iron trafficking is not limited to neoplastic tissue, but may also occur in healthy brain regions. These results contribute to the understanding of tumor pathophysiology and suggest that basal ganglia iron deposition may be a biomarker of brain tumor severity. Further work may investigate the mechanisms by which this increase in iron occurs.Acknowledgements
We would like to thank the Chasing Chad Foundation for funding and support.References
1. Reardon DA, Rich JN, Friedman HS, Bigner DD. Recent Advances in the Treatment of Malignant Astrocytoma. J Clin Oncol. 2006;24(8):1253-1265.
2. Voth B, Nagasawa DT, Pelargos PE, et al. Transferrin receptors and glioblastoma multiforme: Current findings and potential for treatment. J Clin Neurosci. 2015;22(7):1071-1076.
3. Chitambar CR, Al-Gizawiy MM, Alhajala HS, et al. Gallium Maltolate Disrupts Tumor Iron Metabolism and Retards the Growth of Glioblastoma by Inhibiting Mitochondrial Function and Ribonucleotide Reductase. Mol Cancer Ther. 2018;17(6):1240-1250.
4. Legendre C, Garcion E. Iron metabolism: a double-edged sword in the resistance of glioblastoma to therapies. Trends Endocrinol Metab. 2015;26(6):322-331.
5. Langkammer C, Schweser F, Krebs N, et al. Quantitative susceptibility mapping (QSM) as a means to measure brain iron? A post mortem validation study. Neuroimage. 2012;62(3):1593-1599.
6. Anderson C, Nencka A, Muftuler T, Schmainda K, Koch K. Volume-parcellated quantitative susceptibility mapping. In: Proceedings of the Annual Meeting and Exhibition of the International Society for Magnetic Resonance in Medicine. Singapore; 2016:1108.
7. Bedekar D, Jensen T, Rand S, Malkin M, Connelly J, Schmainda K. Delta T1 Method: An Automatic Post-contrast ROI Selection Technique for Brain Tumors. In: Proceedings of the Annual Meeting and Exhibition of the International Society for Magnetic Resonance in Medicine. Stockholm; 2010:2175.
8. Herynek V, Wagnerová D, Malucelli A, Vymazal J, Sameš M, Hájek M. Alterations in the basal ganglia in patients with brain tumours may be due to excessive iron deposition. Oncol Lett. 2015;9(1):43-46.
9. Sato Y, Honda Y, Asoh T, Oizumi K, Ohshima Y, Honda E. Cerebrospinal fluid ferritin in glioblastoma: Evidence for tumor synthesis. J Neurooncol. 1998;40(1):47-50.
10. Dubrow R, Darefsky AS. Demographic variation in incidence of adult glioma by subtype, United States, 1992-2007. BMC Cancer. 2011;11(1):325.
Figures