0897
Quantification of regional pathophysiology in Glioblastoma Multiforme1Institute of Biomedical Engineering, University of Oxford, Oxford, United Kingdom, 2Wellcome Centre for Integrative Neuroscience, University of Oxford, Oxford, United Kingdom, 3Oxford Institute for Radiation Oncology, University of Oxford, Oxford, United Kingdom, 4Oxford University Hospitals NHS Trust, Oxford, United Kingdom, 5Wellcome Centre for Integrative Neuroscience, university of Oxford, Oxford, United Kingdom, 6Department of Oncology, University of Oxford, Oxford, United Kingdom, 7Nuffield Department of Clinical Neuroscience, University of Oxford, Oxford, United Kingdom
Synopsis
Patients with glioblastoma multiforme (GBM) have extremely poor prognosis due to therapy resistance, aggressiveness, and poor understanding of pathophysiology. Here, we use APT-CEST and ASL MRI to noninvasively probe both pH and perfusion in ten patients with primary GBM, prior to surgical/therapeutic intervention. We observe an overall increase in APT and CBF contrast, consistent with both intracellular alkalosis and angiogenesis. Clustering analysis revealed a strong regional association between pH and CBF in 9/10 patients suggestive of similar spatial disruptions. The ability to image concomitant changes in pH and perfusion may provide a novel way to stratify patients for targeted therapeutics.
Introduction
Glioblastoma multiforme (GBM) is the most prevalent type of adult brain tumour, yet median survival is six months, even with treatment1. Whilst pathophysiology such as hypoxia, acidosis and angiogenesis are known key factors promoting tumour survival and growth, their exact roles are not understood in detail, further contributing to the poor prognosis. Recent MRI and PET findings suggest that regional elevations in perfusion and hypoxia predict poor patient outcome2,3; however, the relationship between acidosis and perfusion has not been explored.
Here we implement two MR methods that have not entered routine clinical application in cancer imaging; Arterial Spin Labeling (ASL) and Amide Proton Transfer Chemical Exchange Saturation Transfer (APT-CEST), to probe the relationship between pH and cerebral blood flow (CBF) in GBM. We hypothesise that angiogenic tumour regions will show a concomitant increase in both APT effect and CBF, which may provide important information for therapeutic stratification.
Methods
Ten patients (4F/6M, 59.9±11.2yrs) with primary occurrence of GBM scheduled for surgical resection were imaged at 3T (Siemens TimTrio) as part of the ongoing IMAGO trial, with approval from South Central – Oxford A Research Ethics Committee (REC:17/SC/0304).
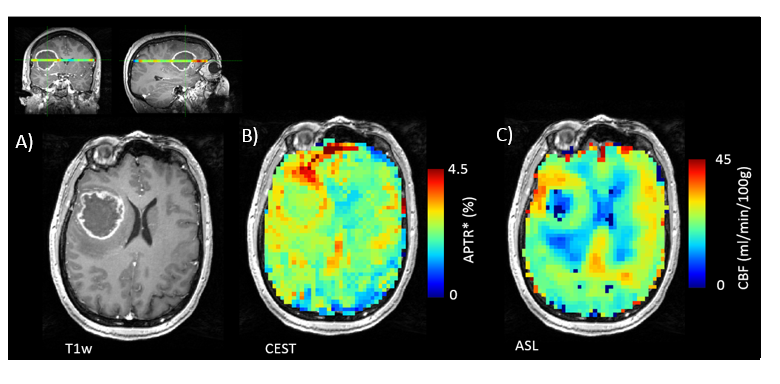
Acquisition: Images included MPRAGE (with/without Gadolinium (Gd-HP-DO3A, ProhanceTM) (TR/TE=1900/3.17ms, 0.7×0.7×1mm), APT-CEST (2s pulsed saturation, each pulse 40ms duration with FA=184°, 50% duty cycle, CW: 0.55µT, 53 saturation frequencies -100:100ppm, TR/TE=5s/27.2ms, 3.4×3.4×5mm, single slice), PCASL MRI (5 PLD, 3.4×3.4×5mm, TR/TE =5484/14ms)4, and T1 map acquired with the VFA technique (FA’s=5-25°, TR/TE=20/3.67ms, 1.7×1.7×5 mm).
Image Analysis: APT effect size was quantified using the APTR* metric from a Bayesian model-based analysis, assuming 3 pools (water, amide, NOE/MT), and voxelwise measured T1 values were used as prior information5,6. CBF was quantified using BASIL7, assuming the general kinetic model8. To assess regional changes, tumour and contralateral normal appearing white matter (NAWM) ROI’s were manually defined on the Gd-enhanced MPRAGE (ITK-SNAP9), and linearly registered to resulting APTR* and CBF maps in Quantiphyse10. CBF and APTR* contrast were calculated for each subject, defined as mean tumour signal normalized by NAWM. Tumours showing enhancing rim/non-enhancing core structure on the Gd-enhanced MPRAGE were further manually segmented into enhancing/non-enhancing ROI’s, with additional rim and core contrast (normalized to NAWM) calculated. To systematically assess sub-regional results across all subjects, k-means clustering11 was subsequently applied to APTR* within the Tumour ROI, with number of clusters, k, determined on an individual basis using the Elbow method12. Resulting clusters were used to extract ‘cluster-means’ from both APTR* and registered CBF maps.
Statistics: Data were tested for normality using the Shapiro-Wilk test, and subsequent statistical tests for within-subject comparisons (paired t-test or Wilcoxon signed-rank) and correlation analysis (Pearson product moment or Spearman’s rho) chosen accordingly.
Results
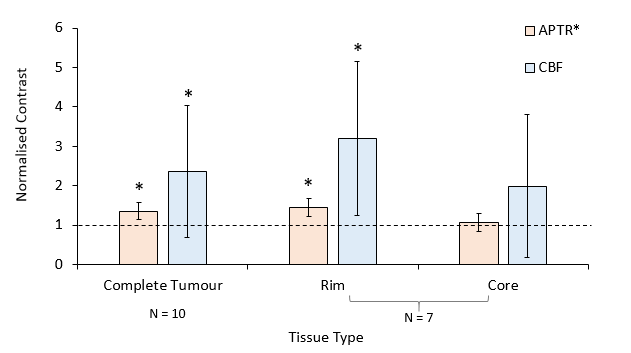
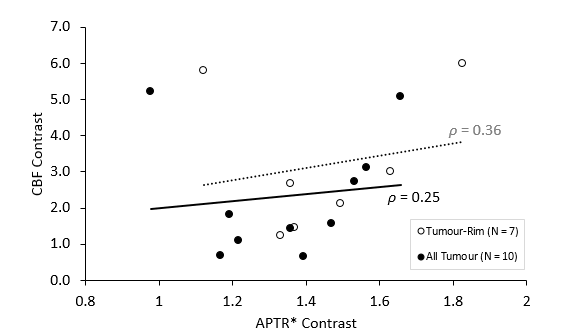
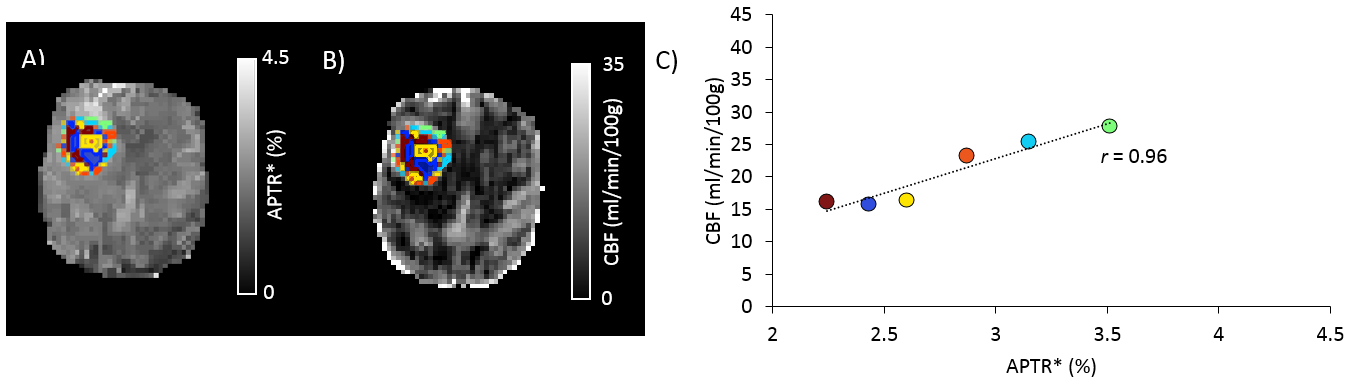
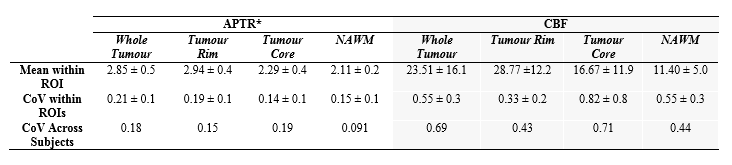
Mean whole tumour APTR* and CBF were both significantly elevated in comparison to NAWM (Fig.1, p<0.05). In 7/10 patients a rim-core structure was evident, with APTR* and CBF significantly increased in the tumour-rim, but not tumour-core (Fig.2). Correlation between APTR* and CBF contrast was assessed across-subjects for whole tumour and tumour-rim ROIs (Spearman’s Rho), but were not significantly associated (Fig.3). The CoV (SD/mean) of absolute CBF was significantly higher than for absolute APTR*, both within NAWM and Tumour ROIs, as well as across subjects (Table 1). For sub-regional analysis, k ranged between 5-7. A strong positive association was observed between CBF and APTR* cluster-means in 9/10 subjects, median ρ=0.94, IQR=0.89-0.96 (Fig.4).Discussion
Both APTR* and CBF were elevated in GBM, consistent with intracellular alkalosis (and extracellular acidosis), and angiogenesis respectively, in agreement with previous results2,3,13,14. In patients with rim-core structure, these elevations appear to be consistent with an angiogenic infiltrating tumour rim. The ability to map both pH and perfusion metrics will help to identify an ‘imaging phenotype’, with a view to using these biomarkers to select patients for targeted therapy.
Mean CBF contrast was more variable than APTR* across subjects, which in part may be attributed to the wider dynamic range of CBF compared to pH, highlighting a challenge of group comparisons for heterogenous tumour types. However, a sub-regional clustering approach revealed a strong association between CBF and APTR* despite differences in variability, in 9/10 subjects. As these are preliminary results from an ongoing trial, increased sample size, histopathological information and outcome data will enable further interpretation.
Here, we used k-means clustering to provide a simple data-driven approach to attempt to capture heterogeneity in the tumour, overcoming limitations due to data variability when attempting voxelwise analysis. There are limitations to this approach based on using the same data to both define sub-regions and characterize them. However, there is a need for methods that can robustly capture tumour subregions with statistical rigour to allow physiology to be explored in complex in-vivo tumour environments.
Acknowledgements
This research was sponsored by The University of Oxford, and overseen by the Oncology Clinical Trials Office (OCTO) and Oxford Clinical Trials Research Unit, with funding from Cancer Research UK and EPSRC as part of the Oxford Cancer Imaging Centre. We would like to thank all study participants for taking part.References
[1] Brodbelt A, et al, Glioblastoma in England: 2007-2011, Eur. J. Cancer, 2015;51(4):533-542
[2] Gerstner E, et al, ACRIN 6684: Assessment of tumor hypoxia in newly diagnosed GBM using 18F-FMISO PET and MRI. Clin. Cancer Res., 2016; 22:5079-5086
[3] Ferrerira da Ponte K, et al, In vivo relationship between hypoxia and angiogenesis in human glioblastoma: a multimodal imaging study. J. Nuc. Medicine, 2018;52(10):1574-1579
[4] Harston G, et al, Identifying the ischaemic penumbra using pH-weighted magnetic resonance imaging. Brain, 2015;138:36-42
[5] Chappell MA, et al, Variational Bayesian Inference for a Nonlinear Forward Model. IEEE Trans Signal Process, 2009; 57(1):223-236
[6] Chappell MA, et al, Quantitative Bayesian model-based analysis of amide proton transfer MRI. MRM, 2013;70(2):556-67
[7] http://www.fmrib.ox.ac.uk/fsl/basil
[8] Buxton R, et al, A general kinetic model for quantitative perfusion imaging with arterial spin labeling. MRM, 1998; 40(3):383-396
[9] Yushkevich PA, et al, User-guided 3d active contour segmentation of anatomical structures: significantly improved efficiency and reliability. Neuroimage, 2006; 31(3):1116-1128
[10] www.Quantiphyse.org
[11] Pedregosa F, et al, Scikit-learn: Machine Learning in Python. JMLR, 2011;12:2825-2830
[12] A Ng, Clustering with the k-means algorithm, Machine Learning, 2012
[13] Togao O, et al, Amide proton transfer imaging of adult diffuse gliomas: correlation with histopathological grades. Neuro Oncol. 2014; 16(3):441-448
[14] Jiang S, et al, Amide proton transfer-weighted magnetic resonance image-guided stereotactic biopsy in patients with newly diagnosed gliomas. Eur.J. Cancer, 2017; 83:9-18
Figures