0896
MR spectroscopy of 2-hydroxyglutarate in patients with brainstem tumors in vivo1UT Southwestern Medical Center, Dallas, TX, United States, 2Philips Healthcare, Andover, MA, United States
Synopsis
MRS of 2-hydroxyglutarate (2HG) has the great potential for determining the isocitrate dehydrogenase (IDH) mutational status in brain tumors noninvasively. This clinical role of 2HG MRS may be demonstrated most clearly in patients with brainstem gliomas or deep brain lesions, where surgical biopsy presents significant risk of permanent neurological deficit. We report 2HG MRS data in patients with brainstem tumors. 2HG was evaluated, using a 2HG-optimized TE 97ms PRESS at 3T, in 12 subjects with brainstem lesions in vivo. We also presents data of monitoring the tumor with serial 2HG MRS scans.
INTRODUCTION
MRS identification of 2-hydroxyglutarate (2HG) in isocitrate dehydrogenase (IDH) mutant gliomas is a major breakthrough in neuro-oncology imaging. It is the first imaging biomarker specific to a genetic mutation in gliomas, making the diagnosis of IDH mutant gliomas possible without biopsy. 2HG also has significant predictive value with respect to the stage and survival in gliomas because an IDH mutation carries a favorable prognosis 1. Importantly, the IDH mutational status was defined as centrally important in the 2016 WHO classification of gliomas 2. Thus, 2HG MRS can provide a noninvasive tool for determining diagnosis in gliomas and is increasingly implemented in clinical MR scanners. Detection of 2HG is of particular importance for patients with brainstem gliomas or deep brain lesions where surgical biopsy is challenging and presents significant risk of permanent neurological deficit.METHODS
Twelve subjects with a radiographically identified lesion in the brainstem were enrolled prior to radio-chemotherapy (5 male and 7 female, age 20 - 74, median age 39). Proton MRS data were acquired from the lesions using PRESS in a Philips Achieva 3T MR scanner. Water suppressed spectra were acquired using TE 97ms PRESS (TE1=32 ms and TE2=65 ms). The voxel size was 1.2 - 8 mL, depending on the tumor volume identified by T2-FLAIR. Data acquisition parameters included TR 2s, number of averages 128 - 1024, sweep width 2500 Hz, and number of samples 2048. Unsuppressed water was acquired from each voxel using STEAM (TE 14ms; TR 20s). LCModel spectral fitting was performed using basis spectra that were numerically calculated incorporating the volume localizing RF and gradient pulses of the PRESS sequence 3. The metabolite concentrations were estimated with reference to water at 45M.RESULTS and DISCUSSION
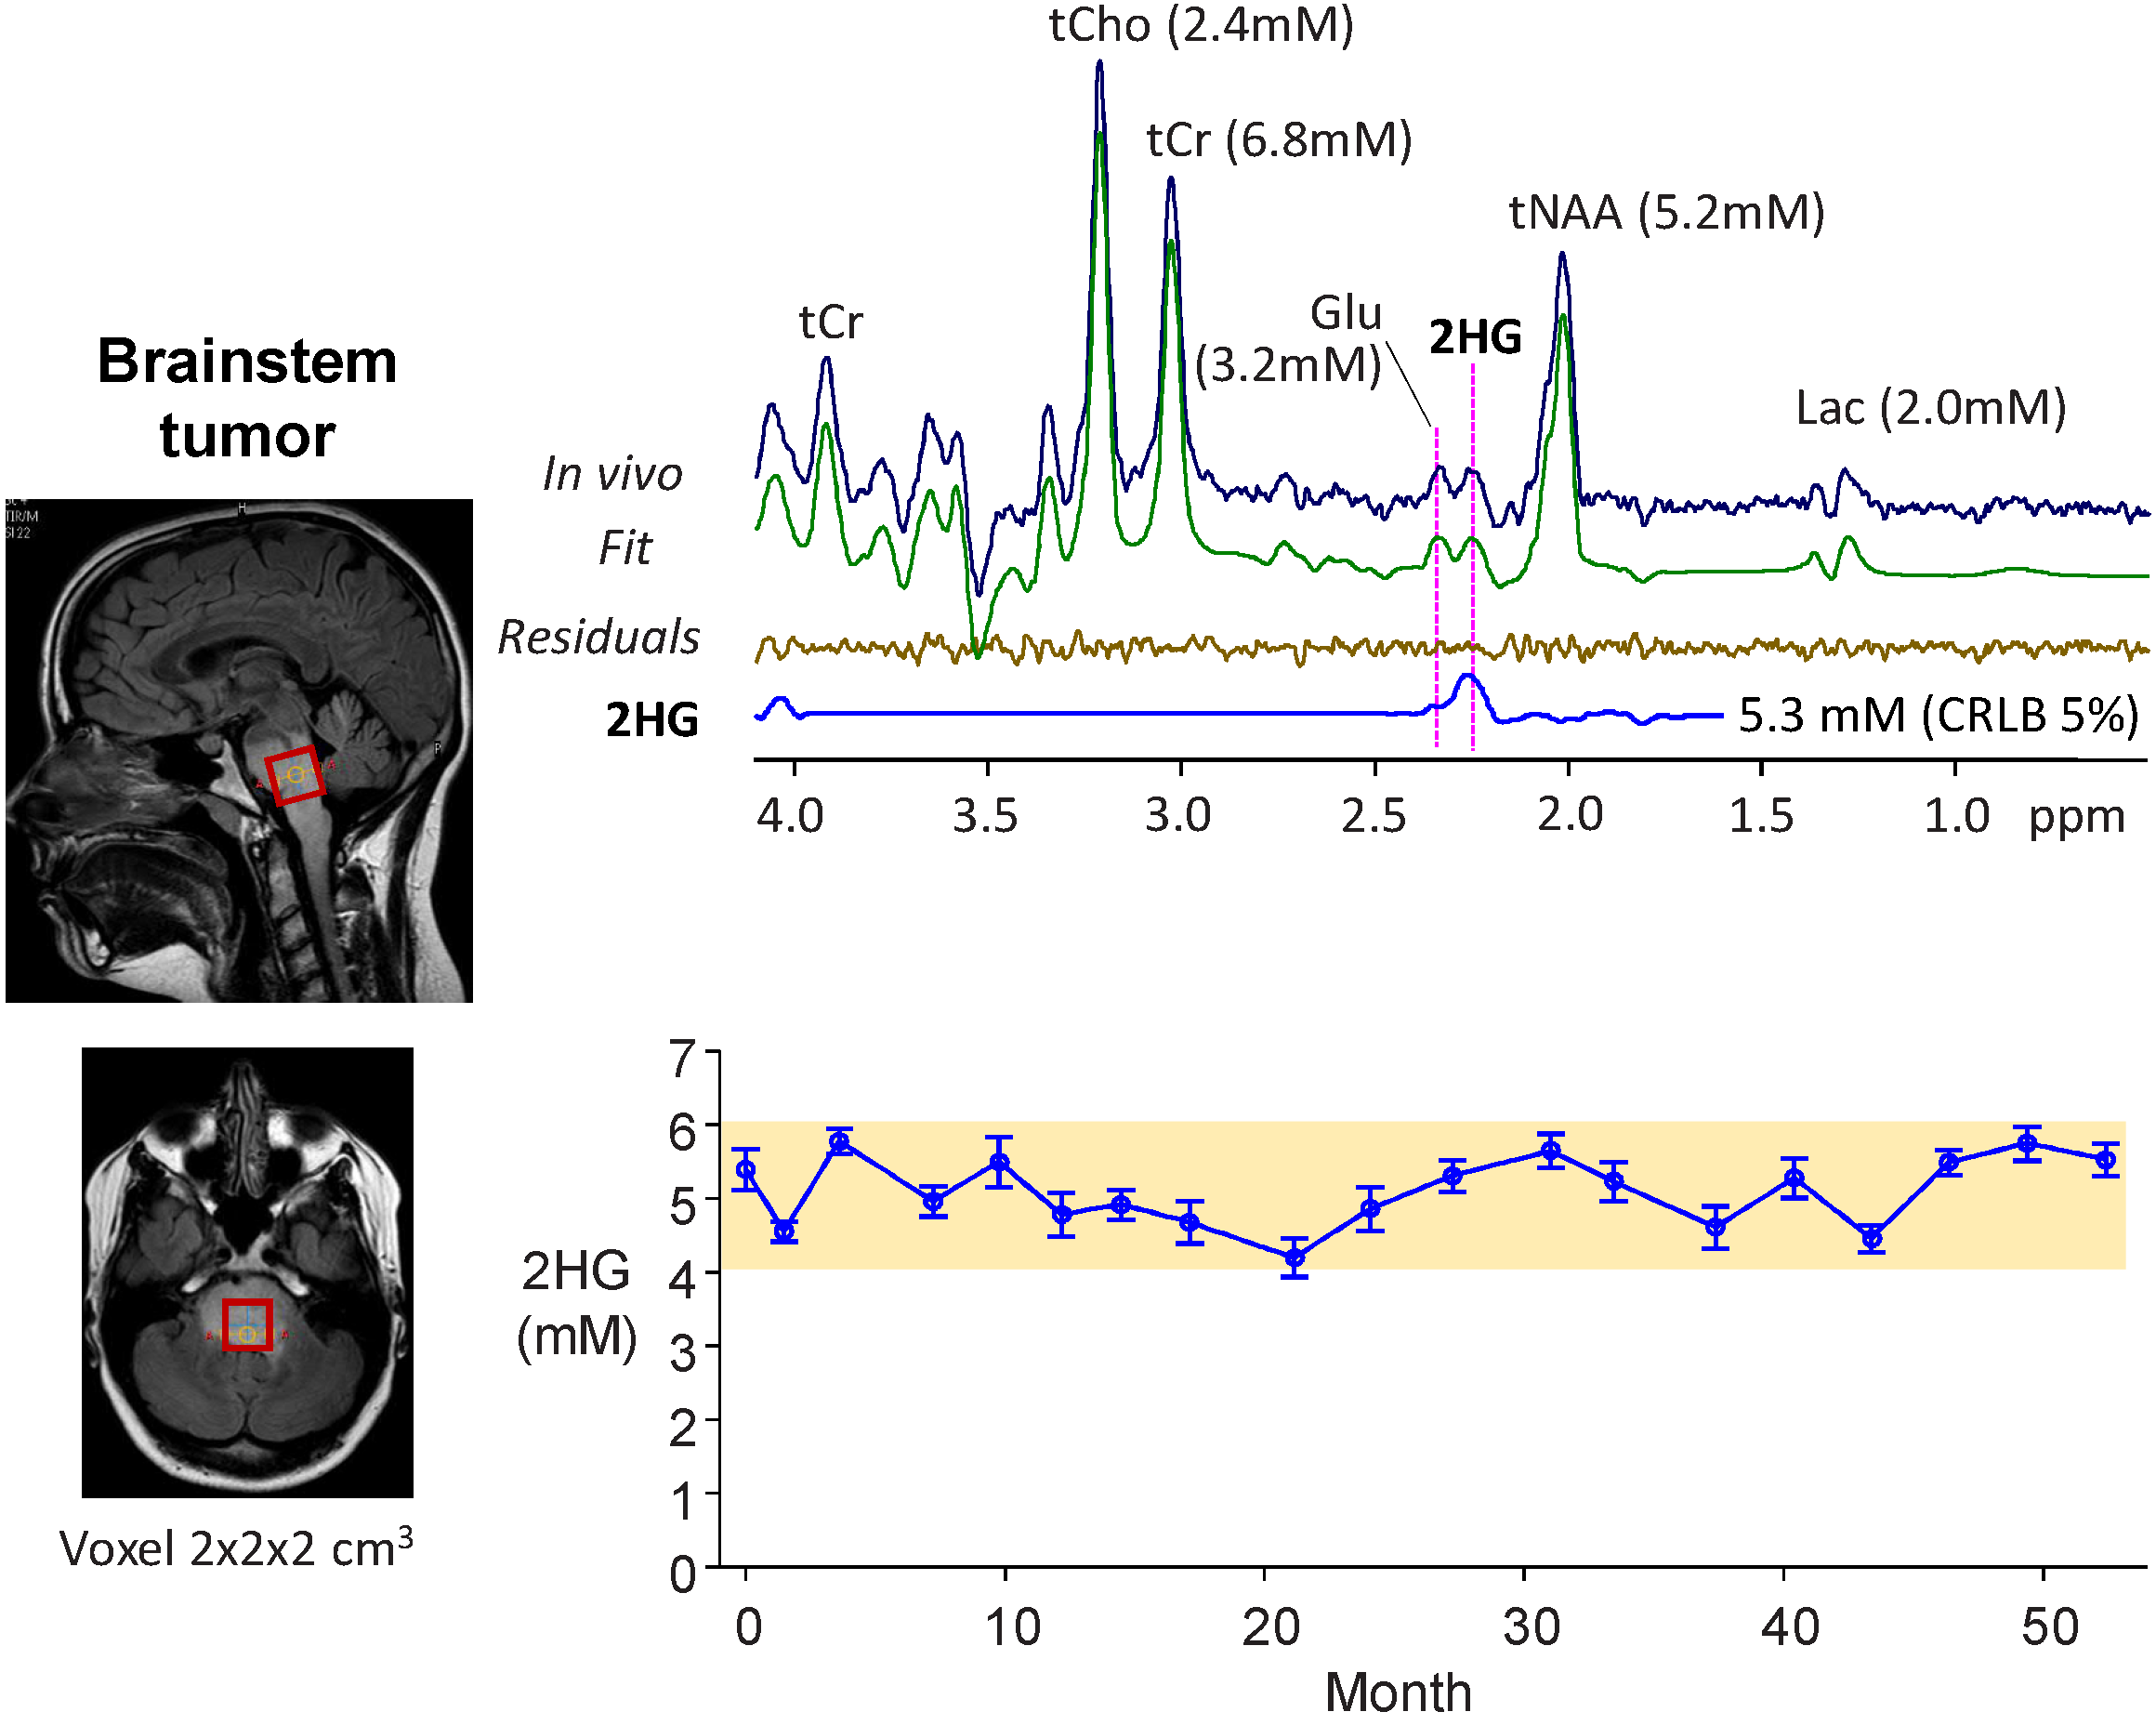
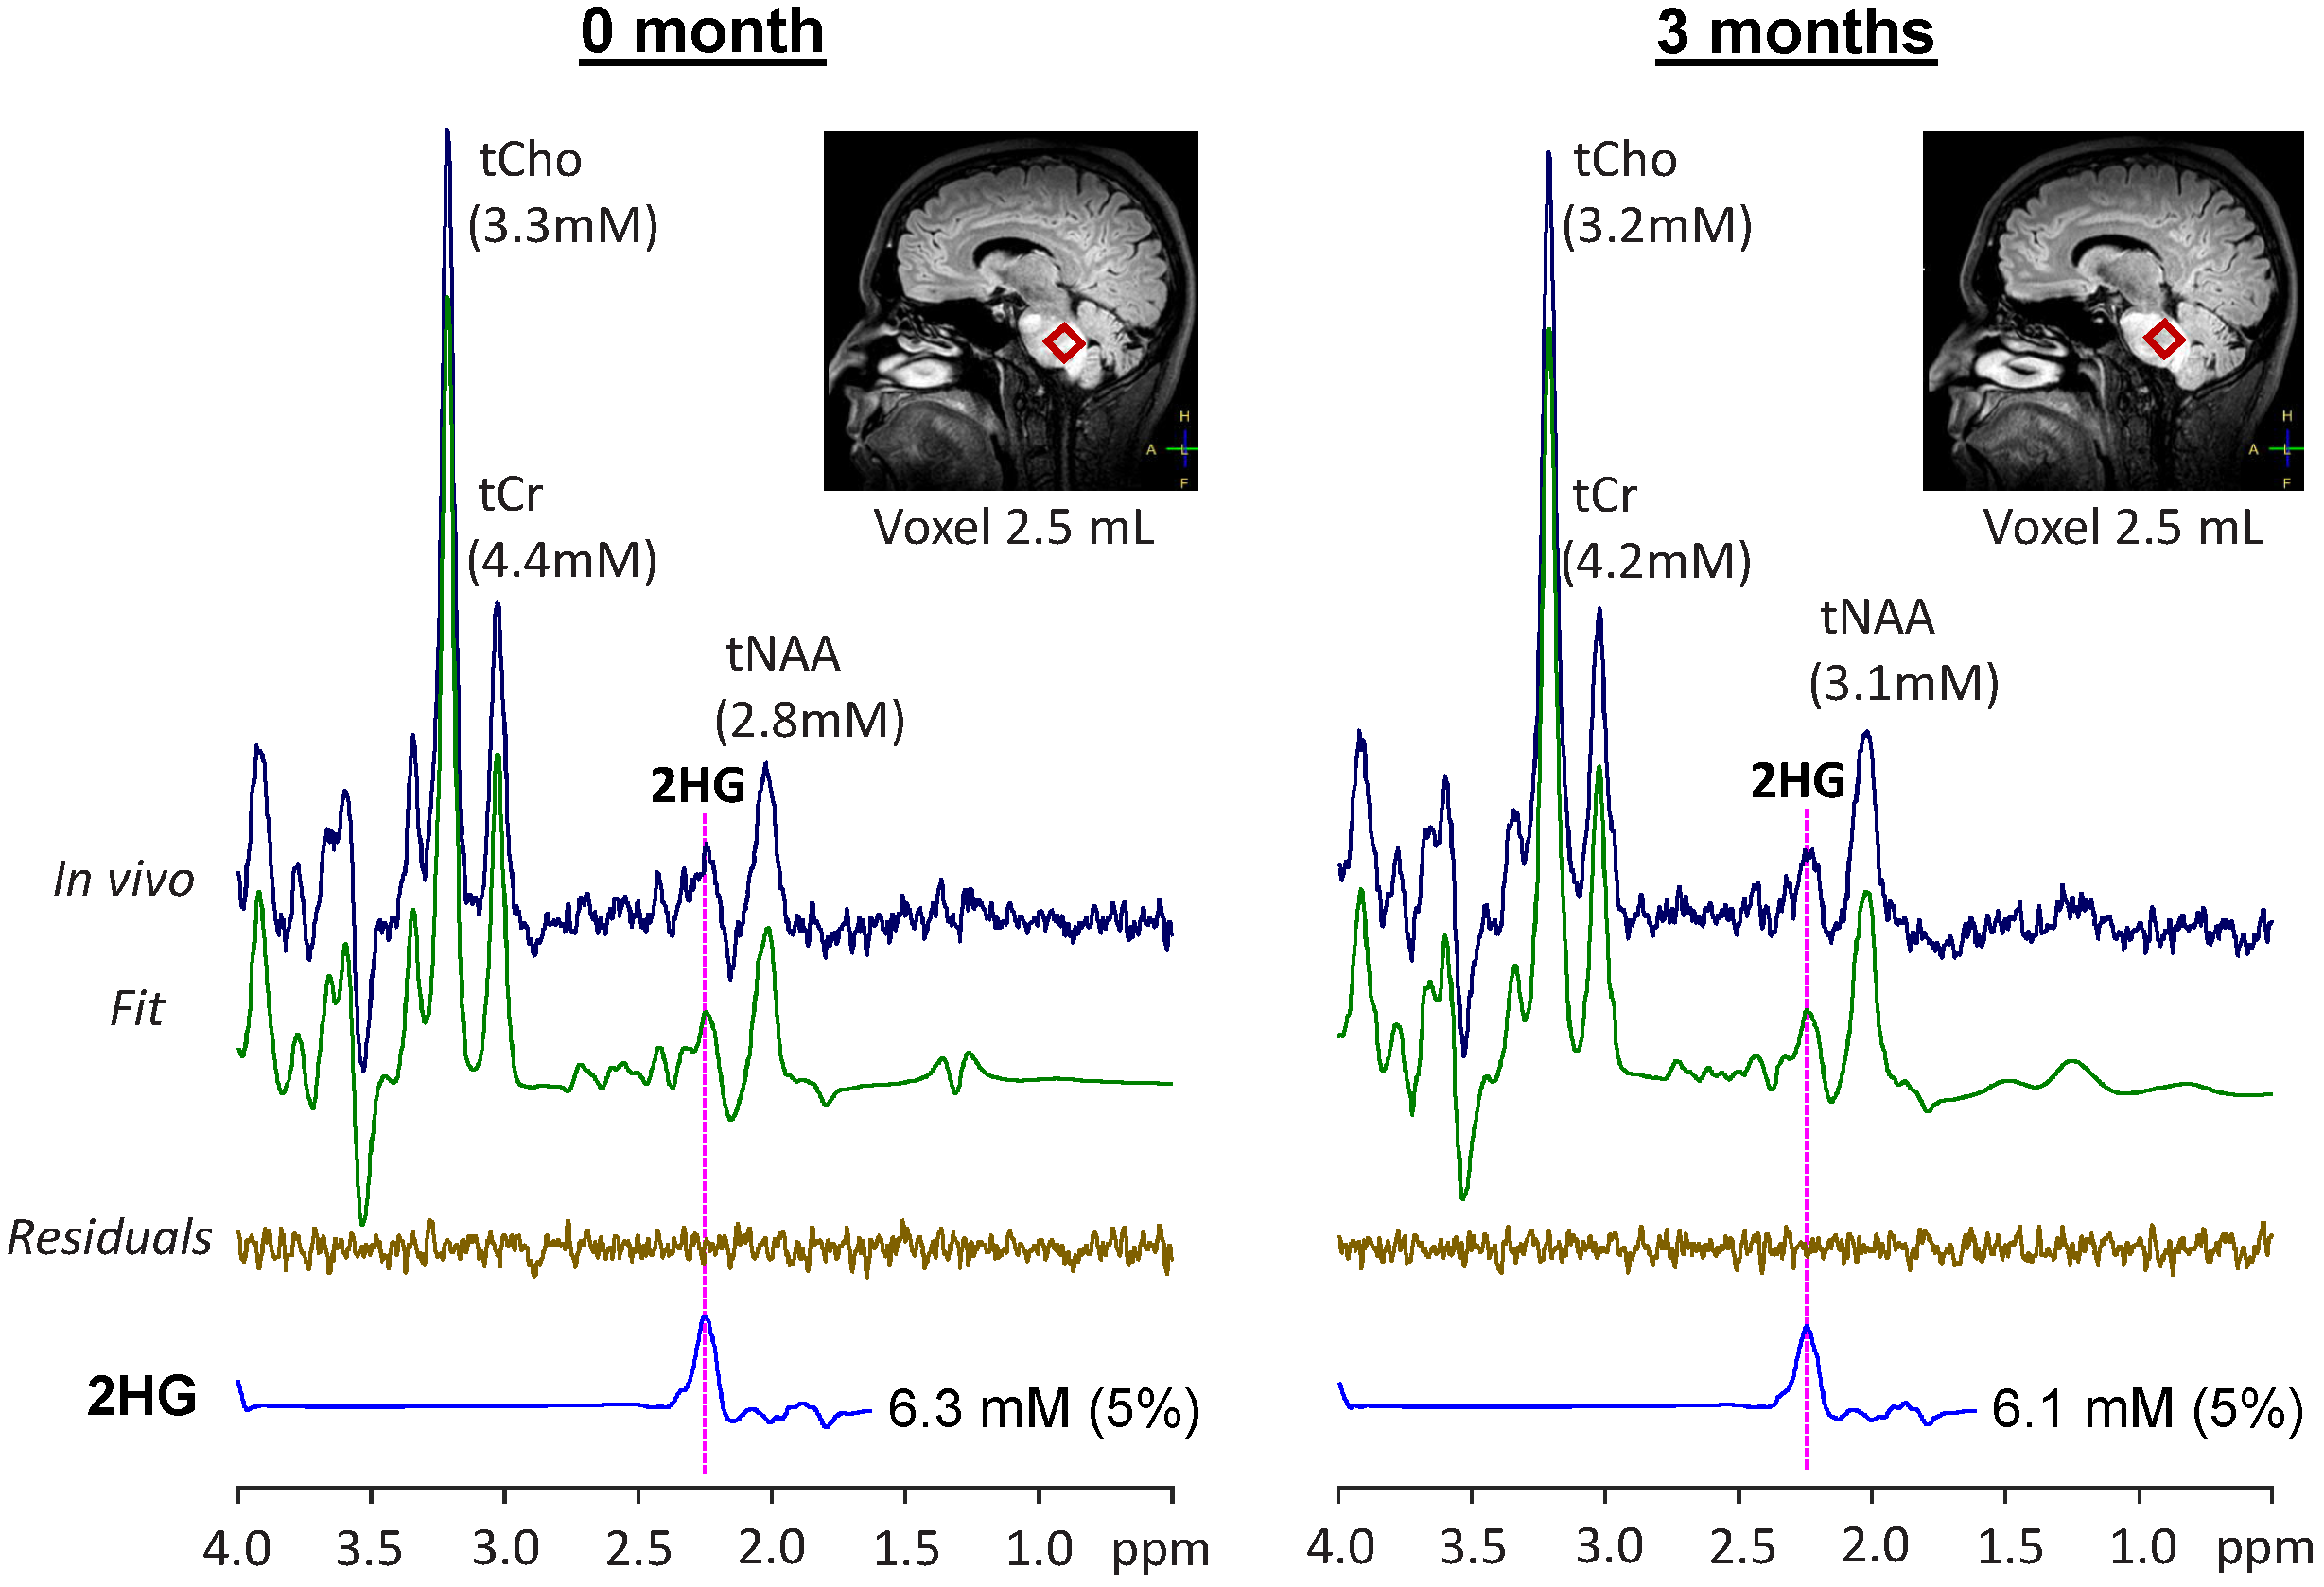
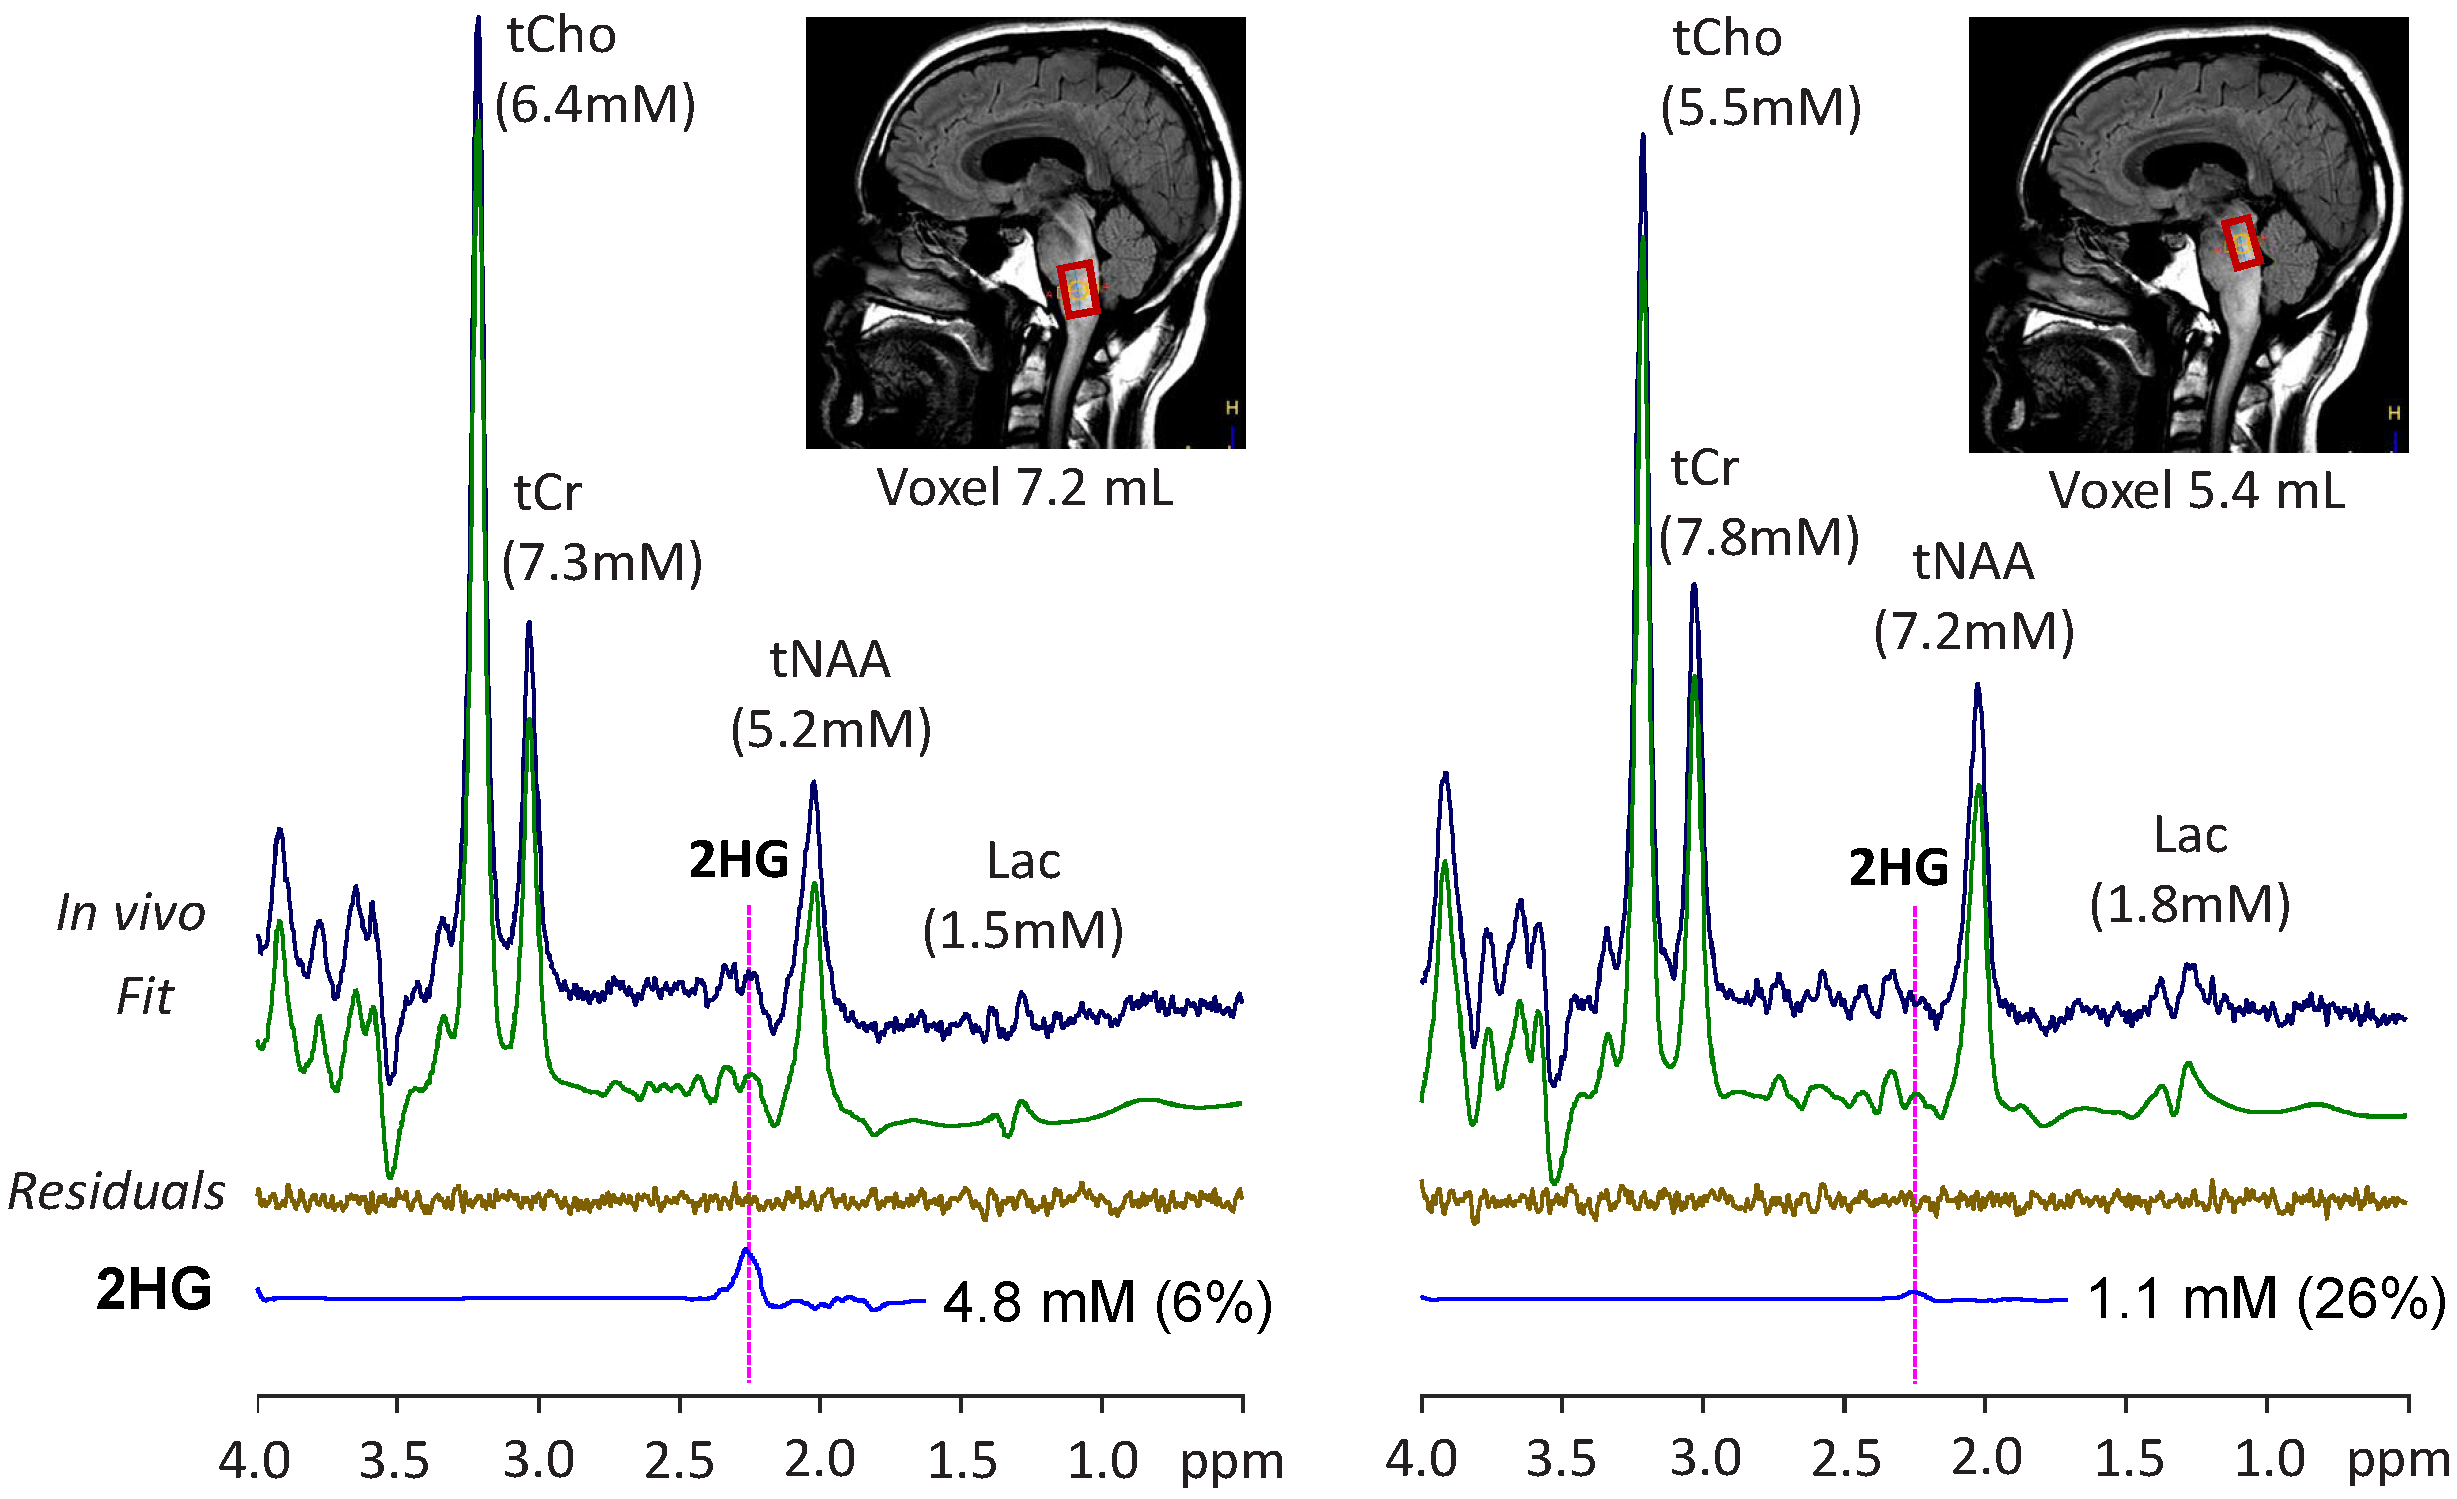
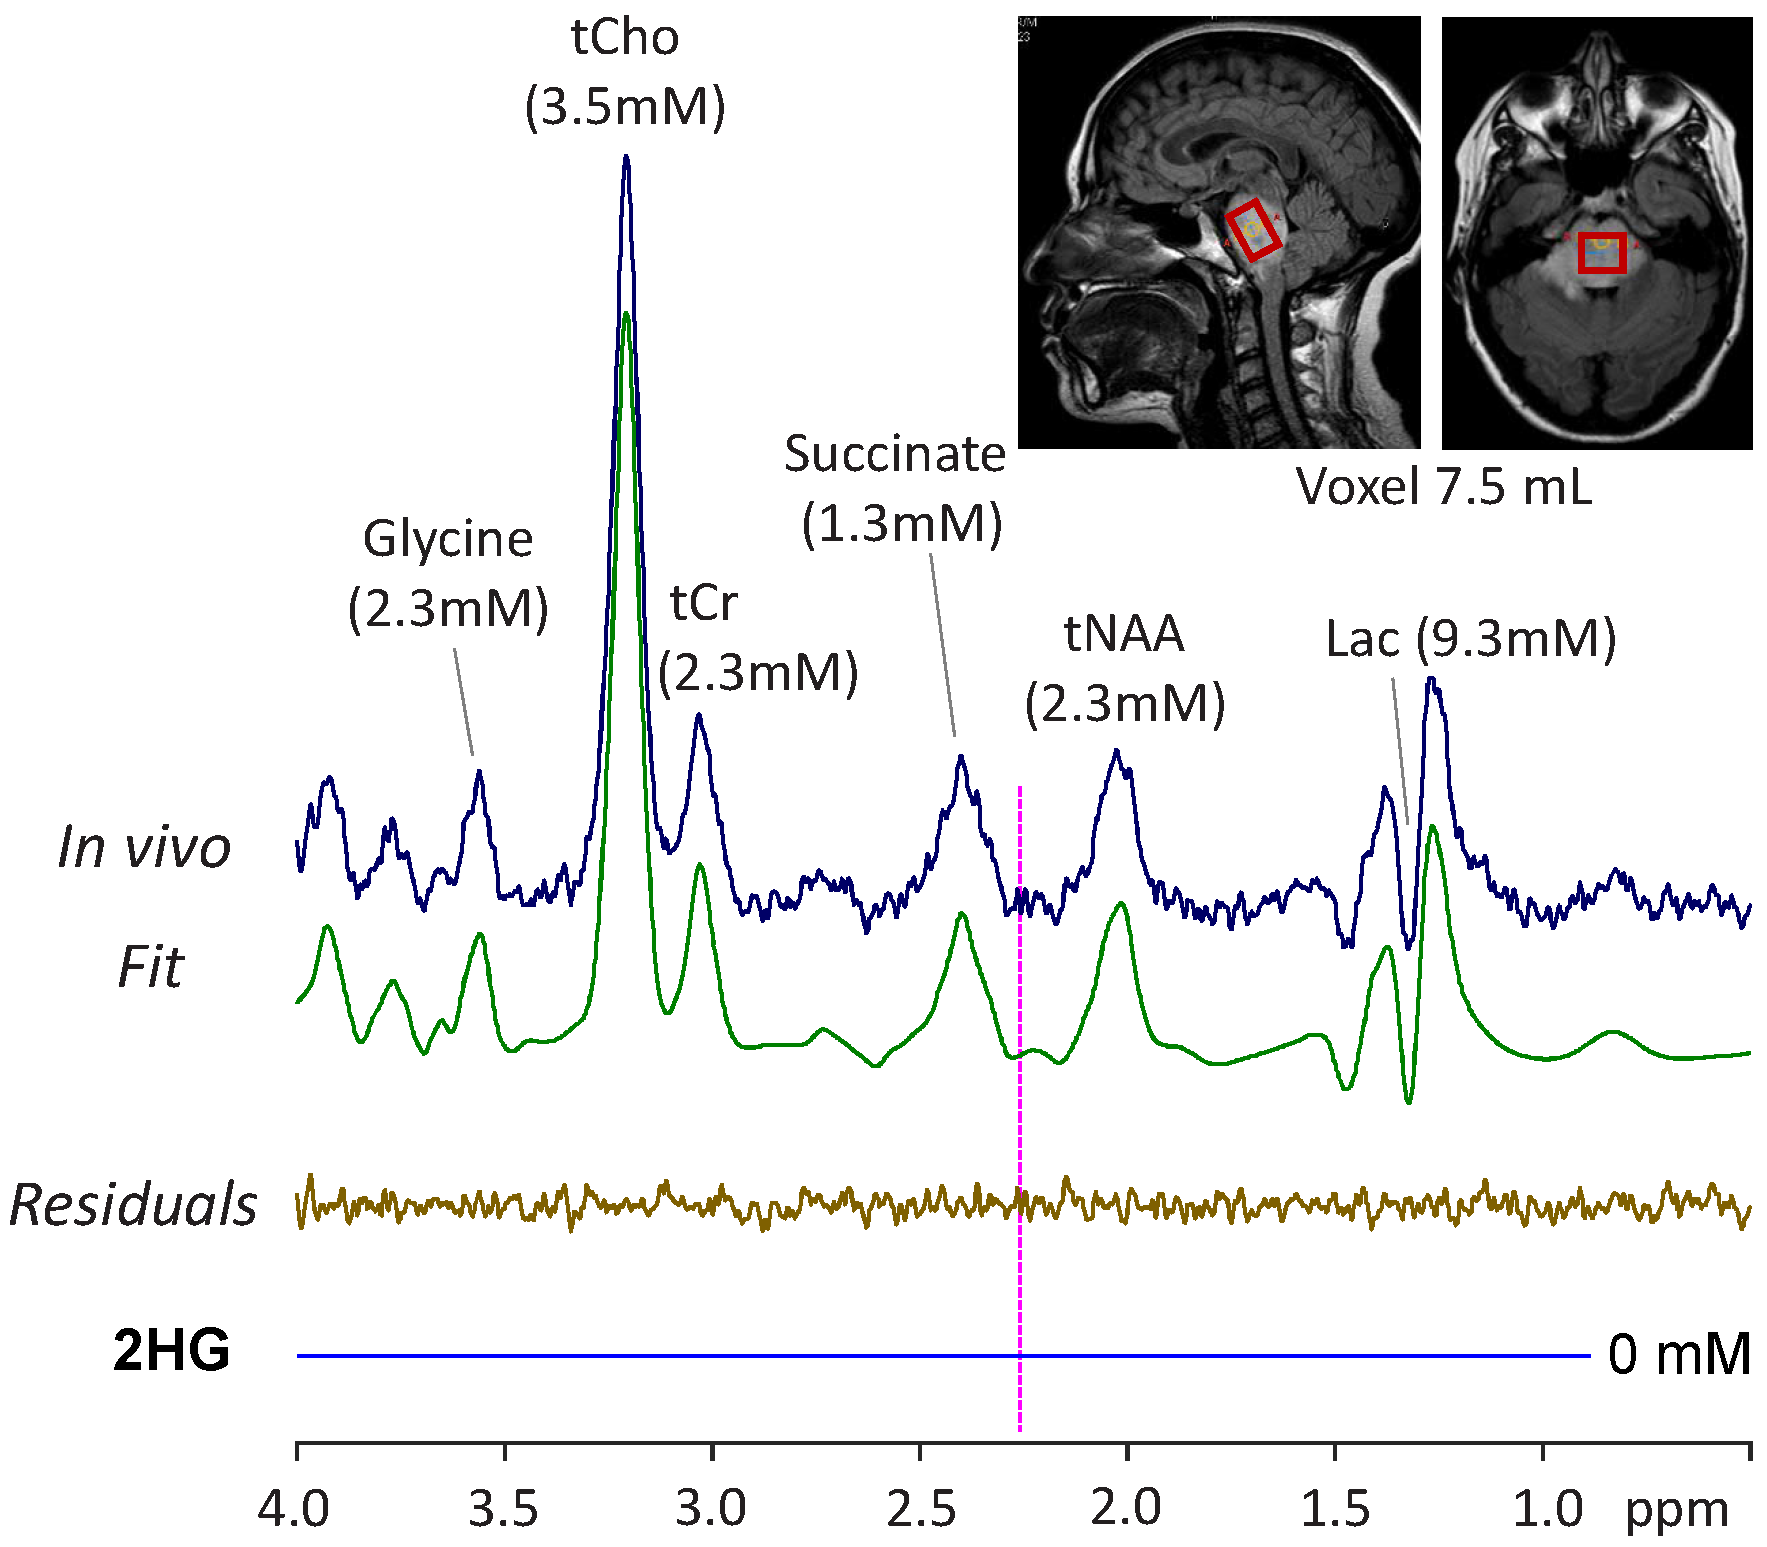
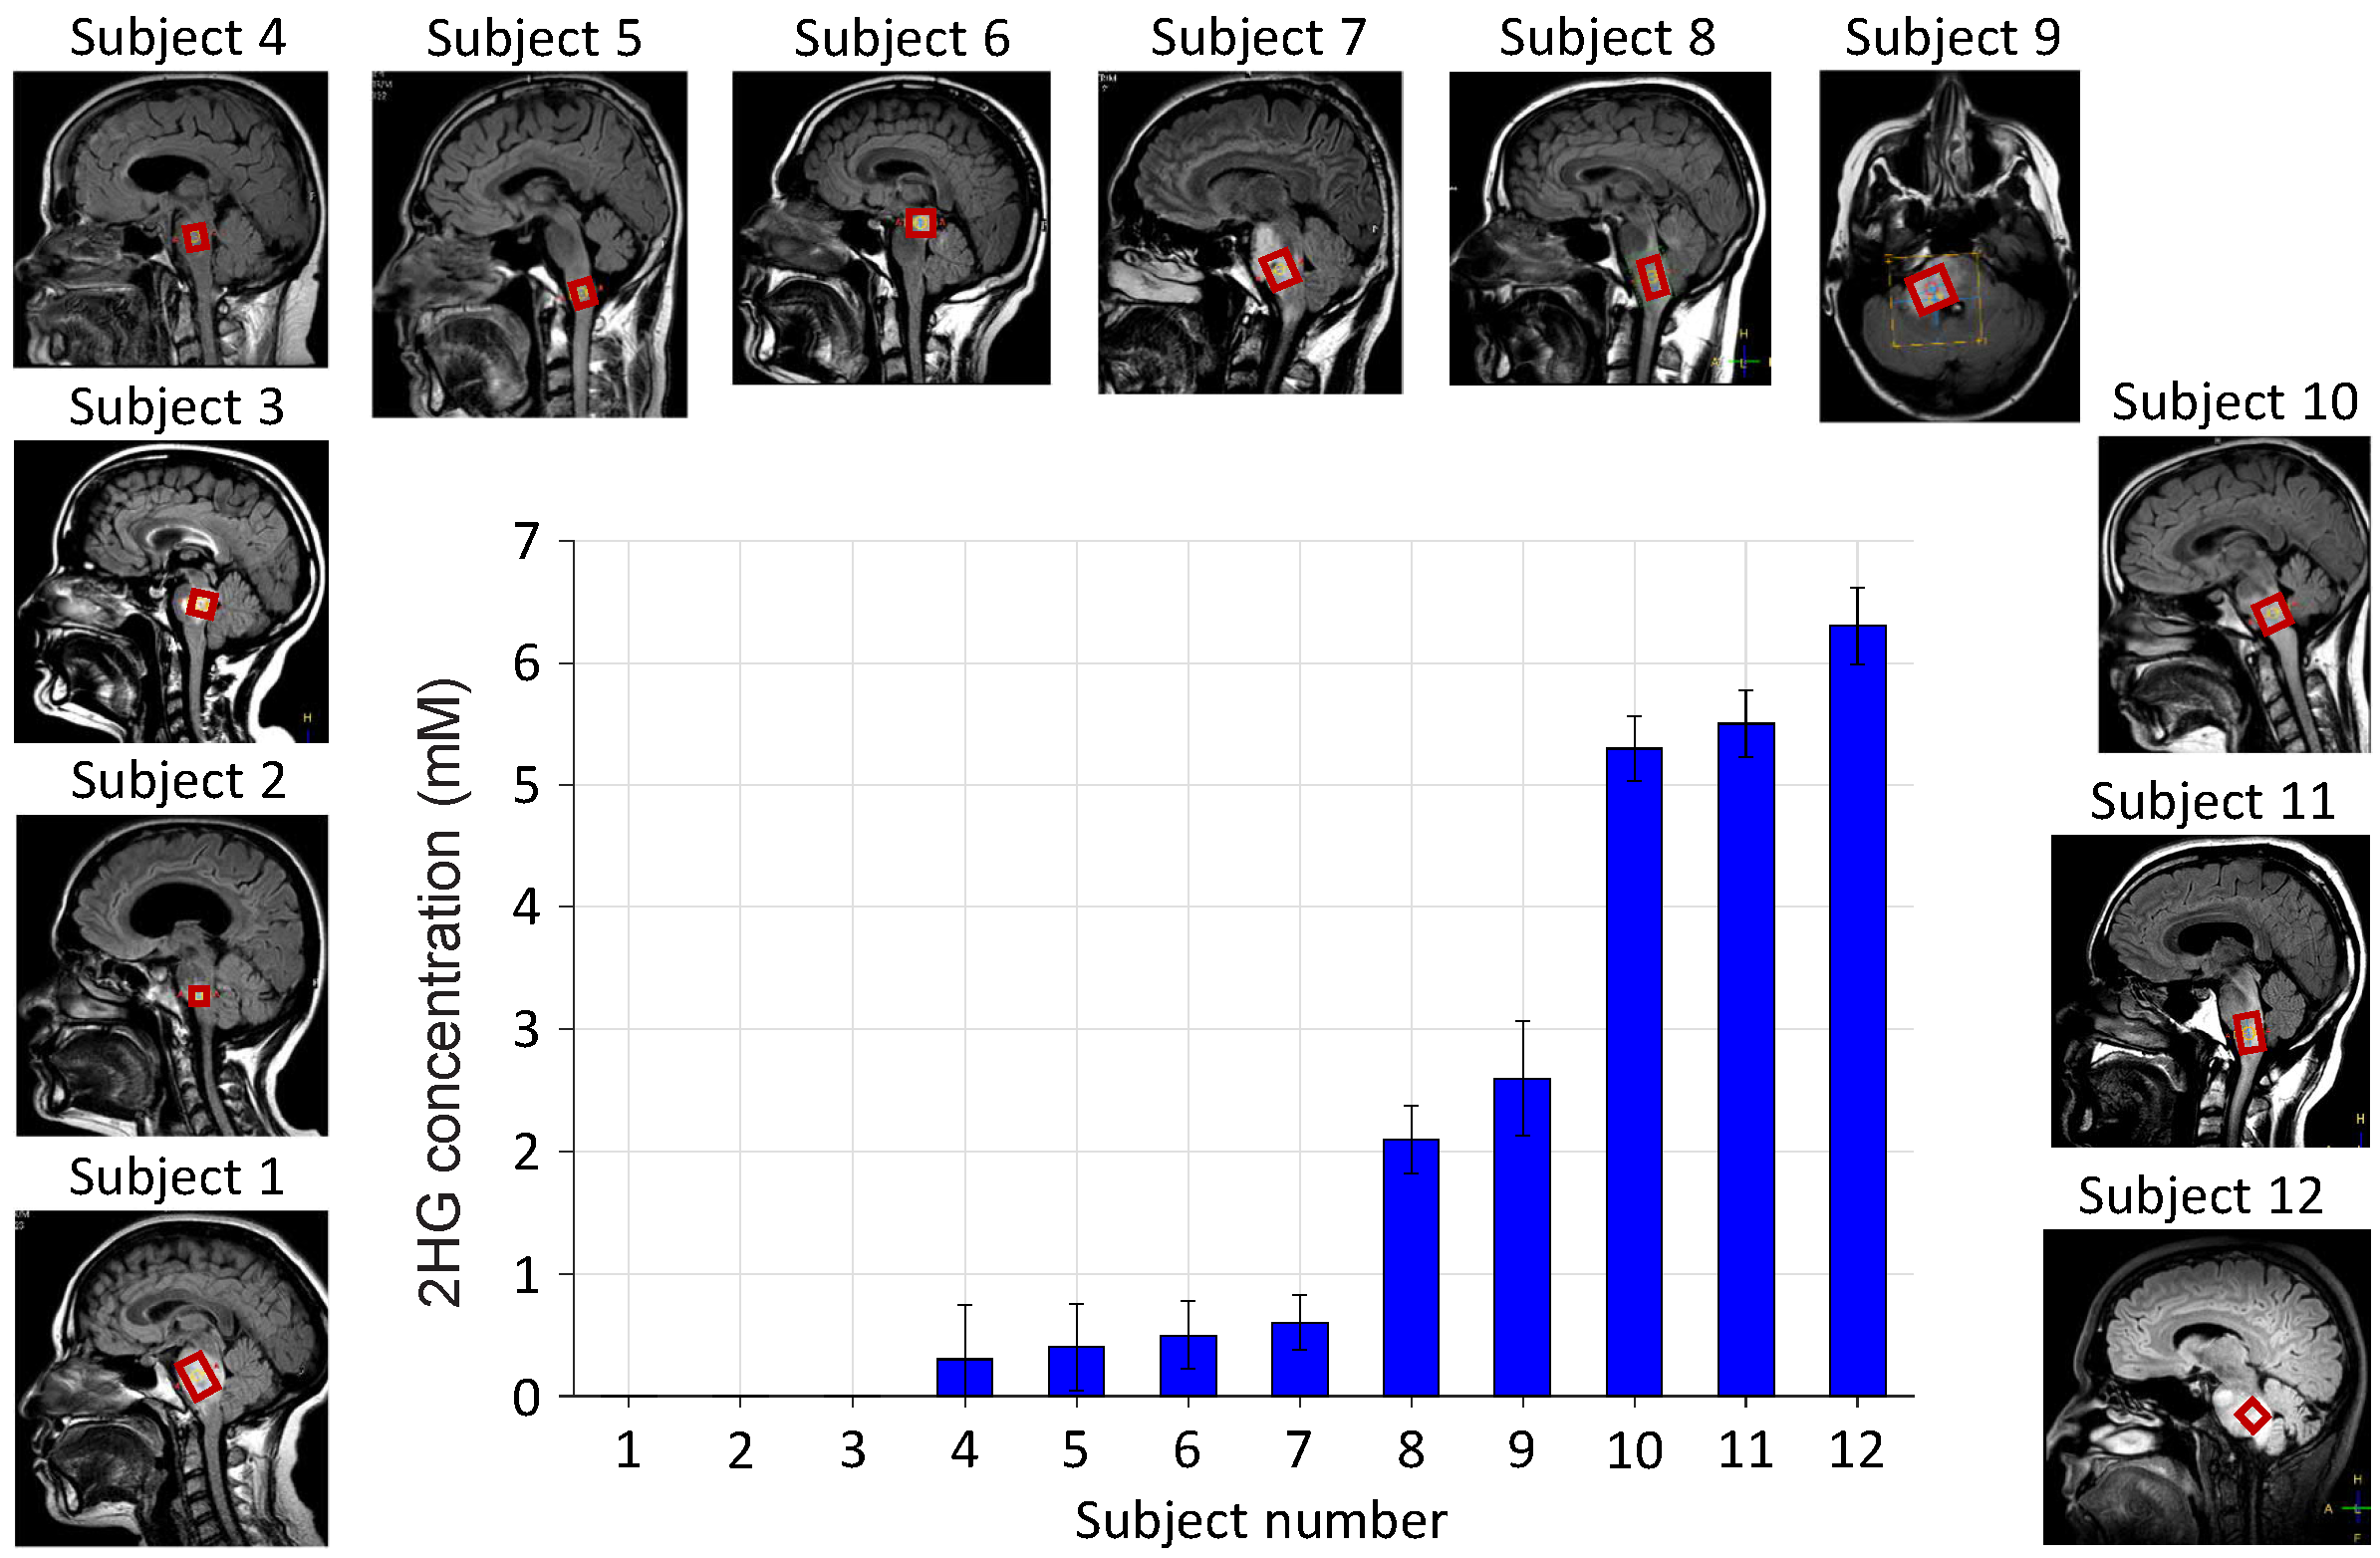
Figure 1 presents an MRS result from a subject with a brainstem lesion. Two peaks were identified between 2.2 and 2.4 ppm, which were attributed to 2HG and glutamate (Glu). 2HG and Glu were estimated to be 5.3 and 3.2 mM with precision (CRLB 4% and 5% respectively). This detection of 2HG and non-enhancement in post-contrast MRI suggested that the lesion was an IDH-mutant low-grade glioma. The decision was made to follow the patient with serial 2HG MRS without surgical and radio-chemotherapeutic treatments until there is clear evidence of tumor progression. The patient had 2HG MRS at 19 time points over a 4.4 year period, during which the 2HG estimation remained about the same (i.e., within approximately +/- 1 mM relative to the baseline 2HG level) and the tumor was clinically stable. Figure 2 shows data from a patient, who had MRS scans at two time points. The 2HG estimation of the first MRS was closely reproduced in the second scan (6.3 vs. 6.1 mM). Other metabolite levels were also similar between the scans. Figure 3 presents a case of heterogeneous 2HG levels in a brainstem tumor. The 2HG signal strength was clearly different between the spectra from two locations, resulting in 2HG estimates of 4.8 and 1.1 mM. Other metabolites showed relatively small differences between the locations. Figure 4 presents a 2HG negative case. In a data from a brainstem tumor patient, a signal was not discernible at 2.25 ppm, with a large broad signal center at 2.4 ppm. Spectral fitting indicated null 2HG together with elevated succinate (1.3mM) and decreased Glu (3.5mM). The data showed elevated glycine (2.3mM), which is indicative of rapid cell proliferation 4. This MRS interpretation agreed with enhancement in post-contrast MRI. The tumor was radiographically diagnosed as an IDH wildtype glioblastoma and the patient underwent radio-chemotherapy. The 2HG estimates from all 12 subjects of the present study are presented in Figure 5. The signal-to-noise ratio was not substantially different between data, with the use of scan times adjusted according to the voxel size. The 2HG estimation ranged from 0 to 6.3 mM (CRLB 5% - 999%). Five cases with 2HG levels higher than 1 mM (patients 8 - 12) were interpreted as IDH mutation, while seven cases with less than 1 mM 2HG level were considered as IDH wildtype or inconclusive, using a detection threshold suggested in a prior study 5.CONCLUSION
This study demonstrates the clinical utility of 2HG MRS in patients with brainstem tumors, from which biopsy is often unavailable. 2HG MRS in brainstem tumors may be technically challenging compared to intracranial tumors. The 2HG-optimized MRS method, used in the present study, may provide reliable assessment of 2HG in brainstem lesions and can be effectively used for evaluating the IDH mutational status of the lesion.Acknowledgements
This work was supported by the National Cancer Institute of the National Institutes of Health under award numbers R01CA154843 and R01CA184584 and by the Cancer Prevention Research Institute of Texas under an award number RP130427. We thank Ms. Kelley Derner and Lucy Christie for subject recruitment and Dr. Ivan Dimitrov for technical assistance.References
1. Yan H, Parsons DW, Jin G, et al. IDH1 and IDH2 mutations in gliomas. New Engl J Med. 2009;360:765-73.
2. Louis DN, Perry A, Reifenberger G, et al. The 2016 World Health Organization classification of tumors of the central nervous system: a summary. Acta neuropathologica. 2016;131:803-20.
3. Choi C, Ganji S, Hulsey K, et al. A comparative study of short- and long-TE 1H MRS at 3 T for in vivo detection of 2-hydroxyglutarate in brain tumors. NMR Biomed. 2013;26:1242-50.
4. Jain M, Nilsson R, Sharma S, et al. Metabolite profiling identifies a key role for glycine in rapid cancer cell proliferation. Science. 2012;336:1040-4.
5. Choi C, Raisanen JM, Ganji SK, et al. Prospective longitudinal analysis of 2-hydroxyglutarate magnetic resonance spectroscopy identifies broad clinical utility for the management of patients with IDH-mutant glioma. J Clin Oncol. 2016;34:4030-4039.
Figures