0889
Distance-enriched functional connectomics in drug-resistant temporal lobe epilepsy1Multimodal Imaging and Connectome Analysis Laboratory, McConnell Brain Imaging Centre, Montreal Neurological Institute and Hospital, McGill University, Montreal, QC, Canada, 2Department of Medical Imaging, Jinling Hospital, Nanjing University School of Medicine, Nanjing, China, 3Department of Radiology, Nanjing Drum Tower Hospital, The Affiliated Hospital of Nanjing University Medical School, Nanjing, China, 4NeuroImaging of Epilepsy Laboratory, McConnell Brain Imaging Centre, Montreal Neurological Institute and Hospital, McGill University, Montreal, QC, Canada
Synopsis
Temporal lobe epilepsy (TLE) is increasingly reconceptualised as a network disorder, with a growing literature suggesting concurrent structural and functional changes in large-scale network organization. In the current work, we developed a novel framework consolidating topological and spatial properties of brain networks and applied it to unveil shifts in the connectional distance distribution in TLE. Patients showed marked connectivity reductions in ipsilateral temporal, insular, and dorsomedial prefrontal networks—regions which coincide with high-degree, transmodal systems. Importantly, distance reductions occurred independently of cortical atrophy but were mediated by microstructural damage, thus emphasizing the clinical importance of physically-grounded measures of functional connectivity.
Introduction
Temporal lobe epilepsy (TLE) is the most common drug-resistant epilepsy in adults. While typically associated with hippocampal pathology, an increasing body of MRI studies have shown concomitant structural and functional compromise in large-scale networks.1,2 Most of these accounts, however, have studied topological parameters of brain graphs, in which network links were purely quantified in terms of connectivity strength, thus overlooking the physical properties of the brain. Using a novel resting-state fMRI paradigm, we enriched functional connectomics with geodesic distance information to unveil shifts in connectivity distance—the overall anatomical distance of an area’s connections. As this approach consolidates physical and functional architectural aspects of the brain, we further examined the interactions between connectivity distance and functional connectome topology, cortical geometry, and tissue microstructure in drug-resistant TLE.Methods
Participants. We studied a cohort of 30 drug-resistant unilateral TLE patients (15 males; mean age±SD: 26.9±8.7 years) and 57 age- and sex-matched healthy controls (25 males; mean age±SD: 25.6±5.9). All patients had postoperative histological confirmation of hippocampal sclerosis.
Image acquisition. In each subject, we obtained high-resolution multimodal MRI investigations on a Siemens 3T scanner shortly before epilepsy surgery. Acquisition included: (i) 3D T1w MRI (repetition time [TR] = 2300 ms, echo time [TE] = 2.98 ms, flip angle = 9º, voxel size = 0.5 × 0.5 × 1 mm3, field of view [FOV] = 256 × 256 mm2, 176 slices), (ii) resting-state fMRI (255 volumes, TR = 2000 ms, TE = 30 ms, flip angle = 90º, FOV = 240 × 240 mm2, voxel size = 3.75 × 3.75 × 4 mm3, 30 slices), and (iii) diffusion MRI (TR = 6100 ms, TE = 93 ms, flip angle = 90º, FOV = 240 × 240 mm2, voxel size = 0.94 × 0.94 × 3 mm3, b-value = 1000 s/mm2, diffusion directions = 120, 4 b0 images). While every participant underwent T1w and resting-state fMRI scans, only a subset of participants underwent diffusion MRI (31/57 controls, 14 males, mean age±SD: 27.3±7.4 years; 30/30 TLE patients).
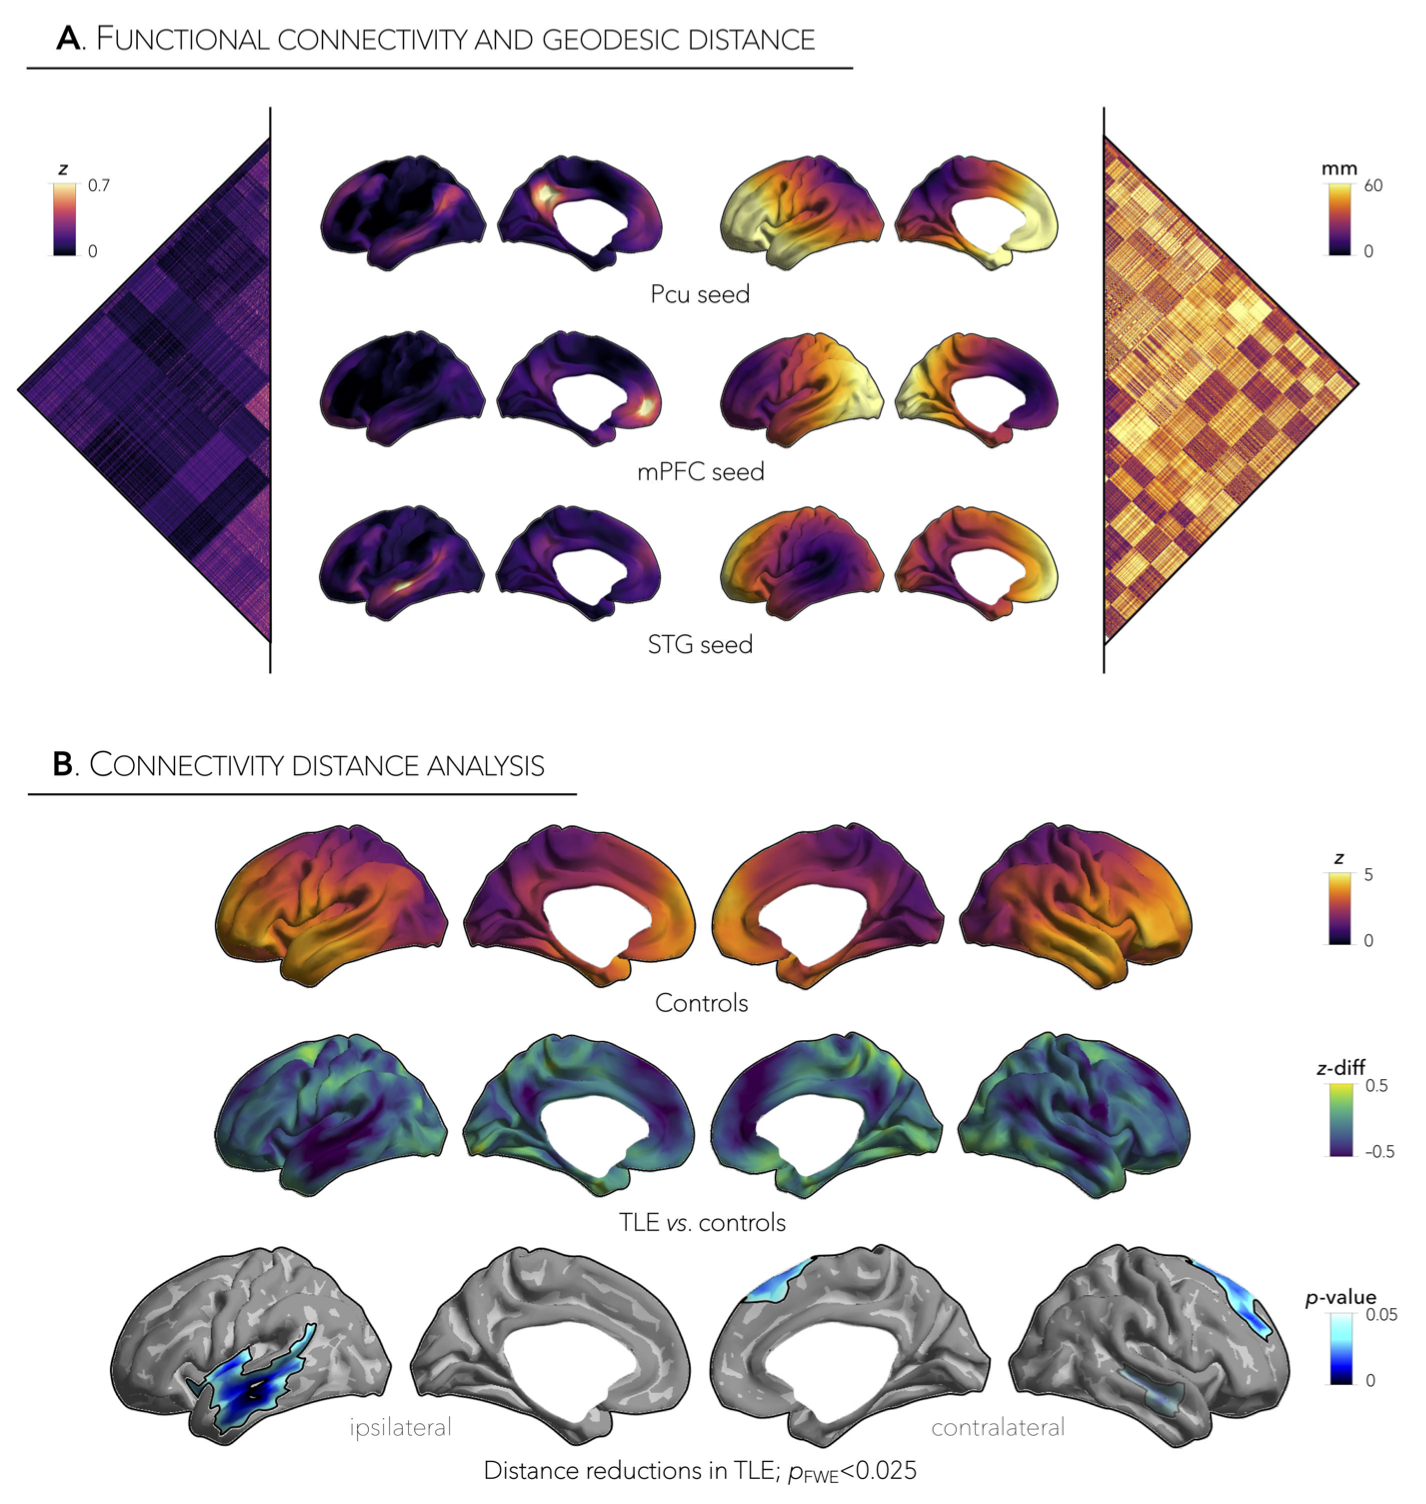
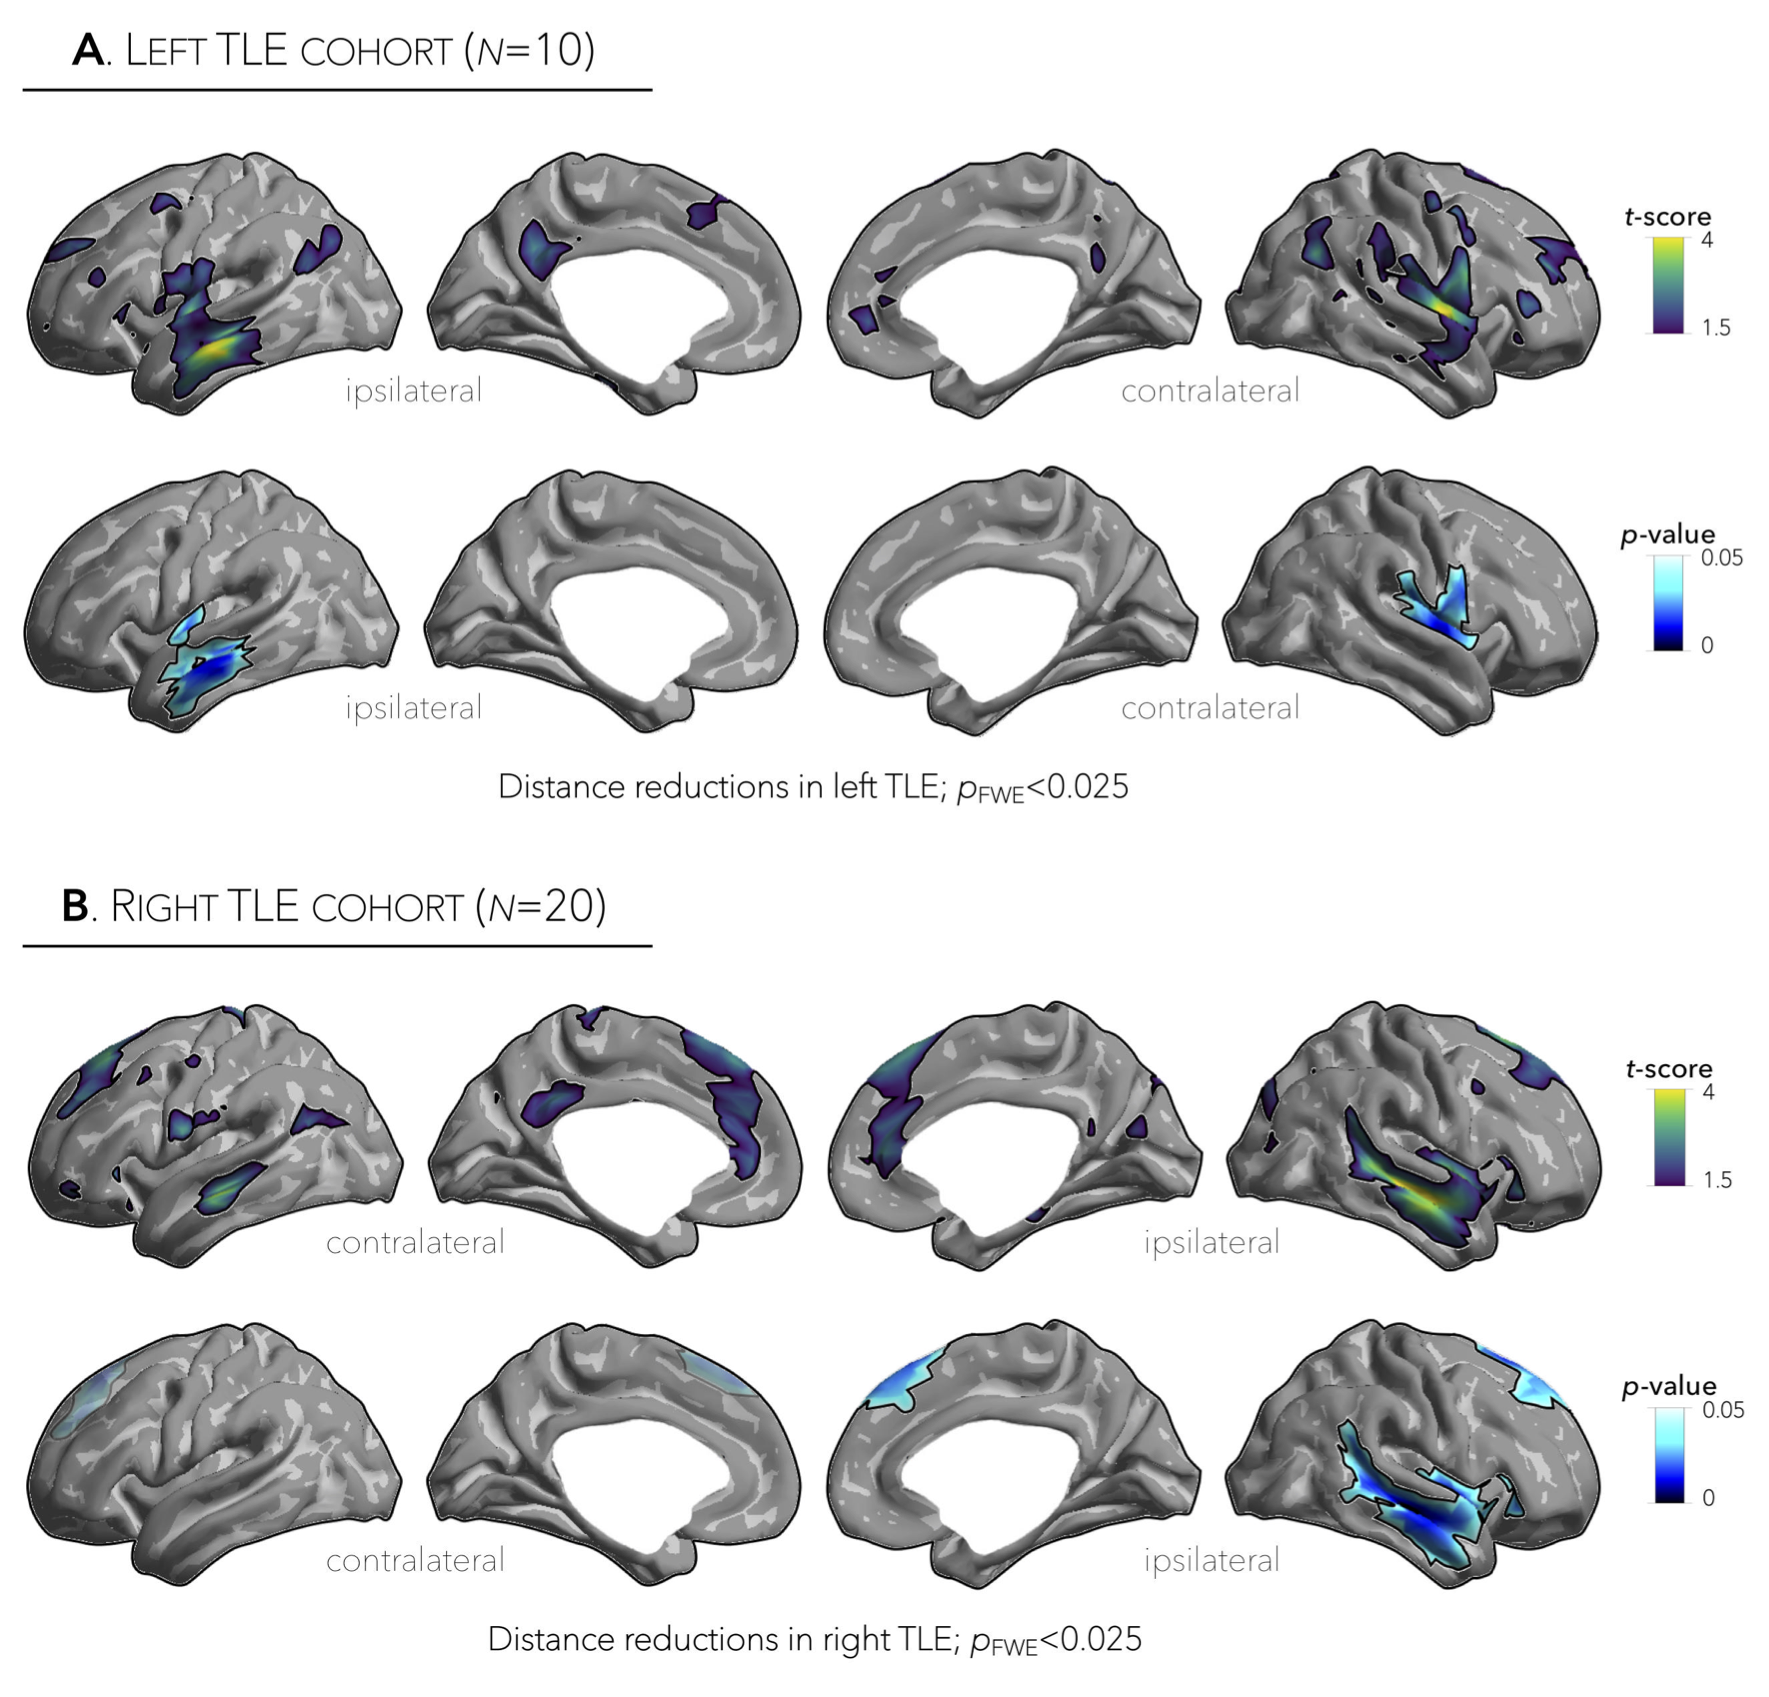
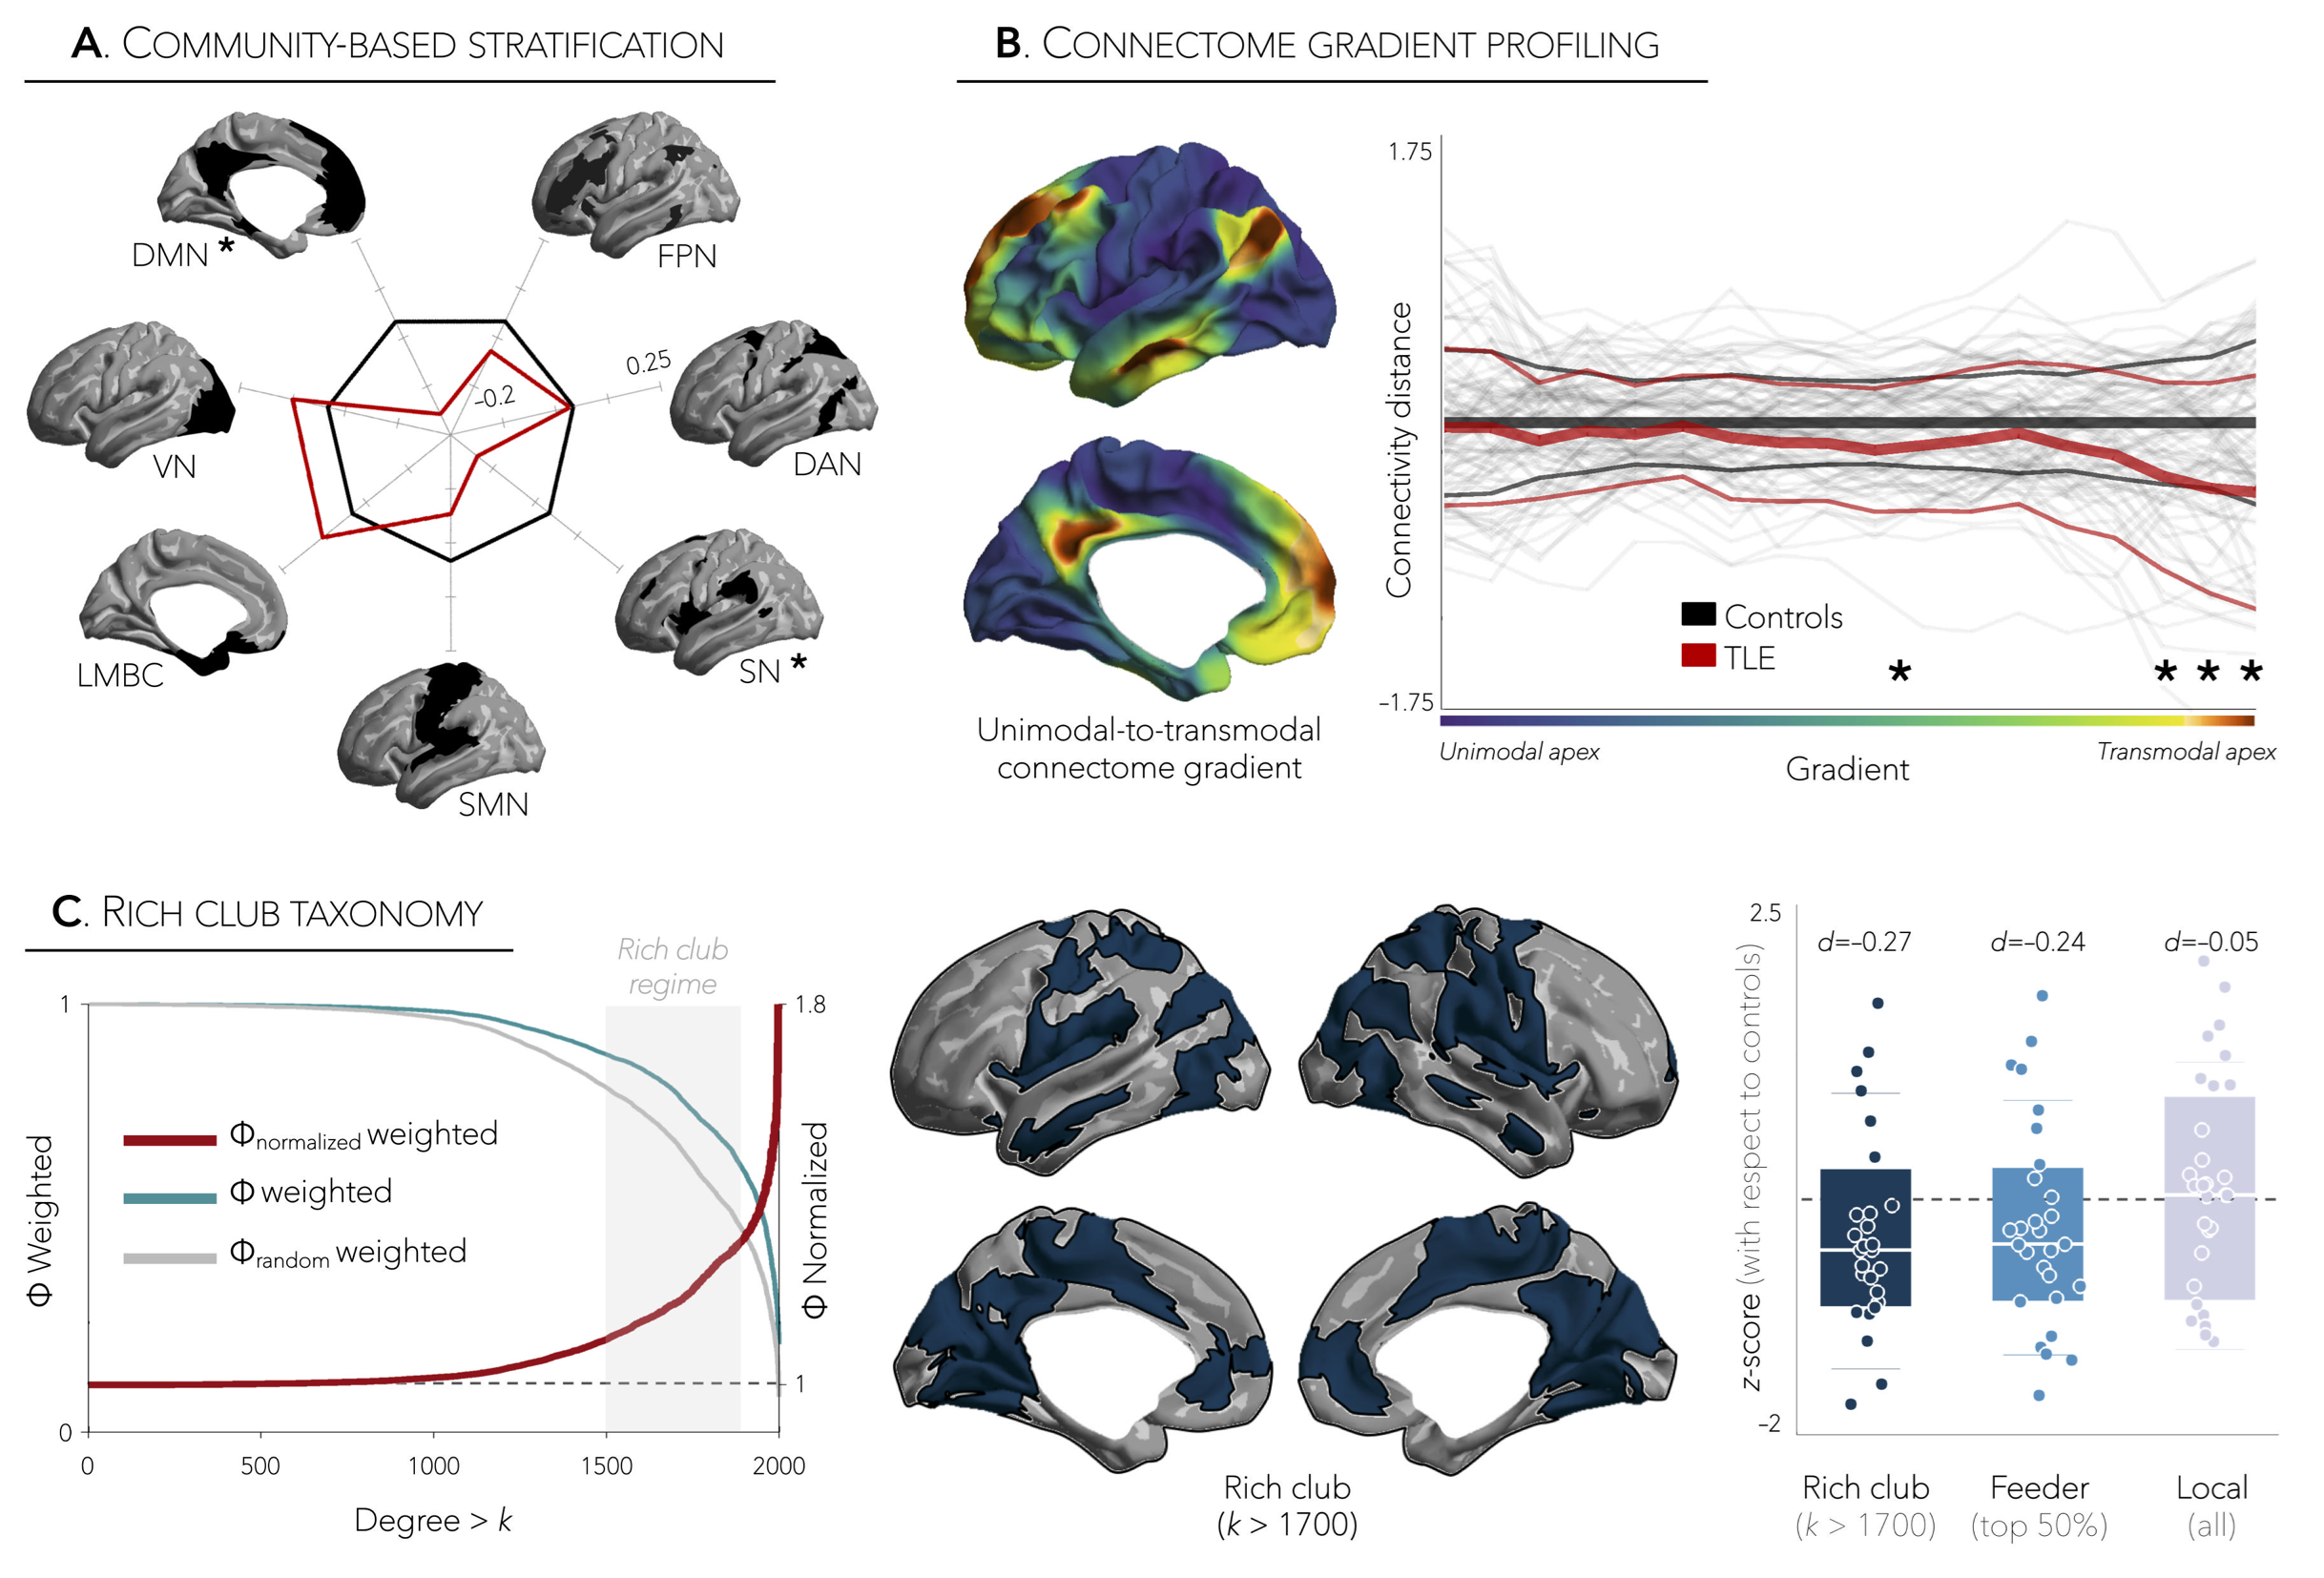
Distance-enriched functional connectomics. Using a boundary-based registration technique,3 we mapped the resting-state functional time-series to each participant’s cortical surface and computed pairwise correlations between all pairs of regions to generate individualized functional connectomes. For each region within the z-transformed connectome matrices, we retained the top 10% of weighted connections and calculated the average geodesic distance to all other regions in this connectivity profile. Distance maps in patients were z-scored relative to data in controls and sorted into ipsilateral/contralateral to the focus. Using surface-based linear models,4 we compared patients to controls and corrected for multiple comparisons at a family-wise error rate (FWE) of p<0.025. To relate shifts in connectivity distance profiles to topological organization, we further performed community-, connectome gradient- and rich club-based areal stratification of the connectivity distance profiles, comparing patients to controls.
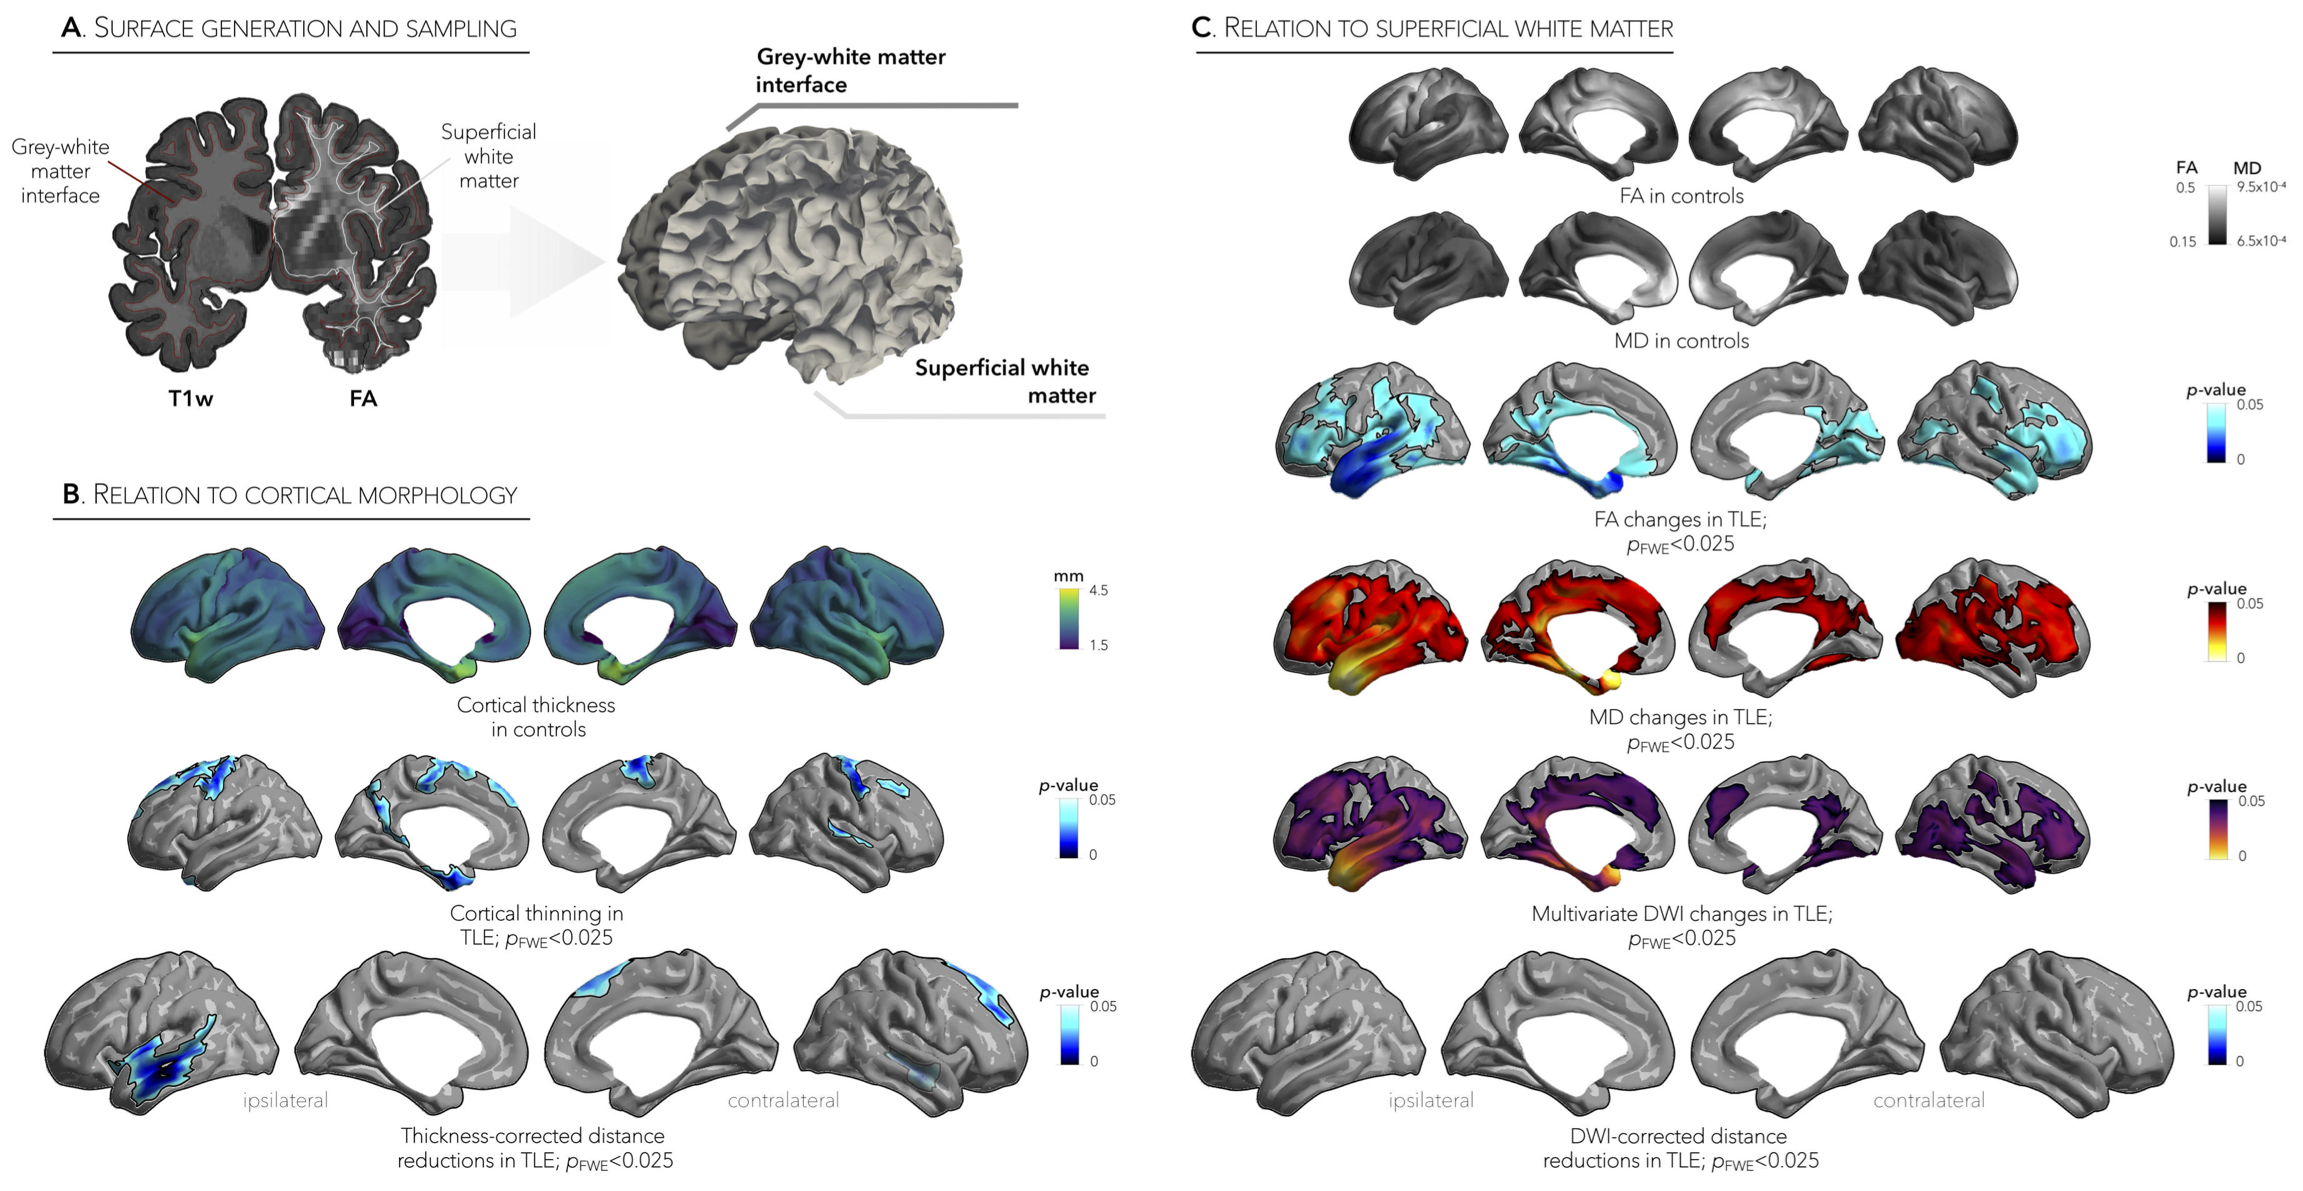
Relation to cortical morphology and microstructure. For each subject, we computed vertex-wise maps of cortical thickness and examined microstructural damage by interpolating diffusion tensor-derived fractional anisotropy (FA) and mean diffusivity (MD) on a superficial white matter surface running 2 mm below the grey-white matter interface (Figure 4A). To assess the effects of morphological and microstructural damage on functional connectivity distance, we repeated the above-mentioned connectivity distance analyses while controlling for (i) cortical thickness and (ii) superficial white matter measures.
Results
Marked inter-regional variations in connectivity distance were observed across the cortical mantle, with transmodal networks showing the longest distances and sensory cortices showing the shortest distances (Figure 1A,B). Relative to controls, TLE patients demonstrated significant reductions in ipsilateral temporal and insular cortices (p<0.001), contralateral dorsomedial prefrontal regions (p<0.025), and contralateral temporal cortex (p=0.5, Figure 1B, Figure 2A,B). Interestingly, patterns of connectivity reductions closely co-localized with default-mode and salience networks (p<0.05, Figure 3A), networks located at the transmodal apex of the adult hierarchical connectome gradient, which depicts gradual shifts in connectivity from unimodal, sensory cortices to transmodal, higher-order systems (Figure 3B).5 Similarly, strongest reduction effects in TLE were observed among densely interconnected high-degree regions constituting the rich club network (Figure 3C). Lastly, while connectivity reductions in TLE were independent of cortical atrophy (Figure 4B), extensive superficial white matter alterations in TLE appeared to mediate connectivity reductions in TLE (Figure 4C).Conclusions
Our findings provide novel evidence for the neurostructural principles underlying shifts in the functional connectivity distance distribution in drug-resistant TLE. The dominant ipsilateral pattern of distance reductions, complementary to cortical atrophy but mediated by microstructural damage, emphasizes the clinical potential of connectomic approaches enriched with physically-grounded information.Acknowledgements
Sara Larivière acknowledges funding from Fonds de la Recherche du Québec – Santé (FRQS) and Reinder Vos de Wael from a Savoy Foundation studentship. Dr. Boris Bernhardt acknowledges funding from the SickKids Foundation, research funding from the National Sciences and Engineering Research Council of Canada (NSERC), Canadian Institutes of Health Research (CIHR), Azrieli Center for Autism Resarch (ACAR), an MNI-Cambridge collaboration grant, and salary support from FRQS (Chercheur Boursier).References
1. Bernhardt et al., 2011. Cereb Cortex, 21(9), 2147-2157.
2. Bernhardt et al., 2013, Front Hum Neurosci, 7 :624.
3. Greve and Fischl, 2009. NeuroImage, 48:63-72.
4. Wesley et al., 2008. NeuroImage, 47:S102.
5. Margulies et al., 2016. Proc Natl Acad Sci, 113(44), 12574-2579.
Figures