0888
Maternal immune activation during pregnancy impacts on resting state functional connectivity in the adult offspring1Institute of Experimental and Clinical Pharmacology and Toxicology, Friedrich Alexander University Erlangen-Nuremberg, Erlangen, Germany, 2Department of Neurophysiology and Neuropharmacology, Medical University of Vienna, Vienna, Austria, 3Department of Biomedical Imaging and Image-Guided Therapy, Division of Molecular and Gender Imaging, Medical University of Vienna, Vienna, Austria, 44Department of Pediatrics and Adolescent Medicine, Medical University of Vienna, Vienna, Austria
Synopsis
The infection of the pregnant female and the ensuing induction of maternal immune activation affect fetal development with long-lasting consequences for health and disease. Specifically aberrant neural wiring may contribute in the manifestation of psychiatric disorders such as depression. Here, we investigated altered resting state functional connectivity using fMRI in adult mice after prenatal immune activation. While the overall flow of information was intact, especially the cortico-limbic connectivity was disrupted in resting state networks of adult offspring. We propose that these altered connectivity patterns may lead to behavioral and emotional abnormalities with relevance for neuropsychiatric disorders.
Introduction
Gestational infection constitutes a risk factor for the occurrence of psychiatric disorders in offsprings1. Activation of the maternal immune system with subsequent impact on the development of the fetal brain is considered to form the neurobiological basis for aberrant neural wiring and the psychiatric manifestations later in offspring life2. Here we used a validated animal model to investigate the impact of maternal immune activation (MIA) particularly on adult offspring resting state functional connectivity.Methods
Pregnant C57Bl6/N mice were injected intraperitoneally at embryonic day 12.5 either with Poly(I:C) (= polyriboinosinic-polyribocytidilic acid), a synthetic analog of virus-specific double-stranded RNA, to induce MIA or with 0.9% NaCl (Saline) as vehicle control. Functional connectivity was assessed with resting state functional MRI (RS-fMRI) in the 3 month old offspring. RS-fMRI data were acquired with a T2*-weighted single-shot gradient echo-based Echo Planar Imaging sequence (GE-EPI) covering 22 axial slices of the brain in 2 seconds (600 volumes, total time 10 minutes, TEef=15 ms, TR=2000 ms, matrix 94x64, FOV 15x15 mm, slice thickness 0.5 mm). The measured matrix was reconstructed by zero filling to 128x128 pixels resulting in a final resolution of 117x117x500 µm. Standard preprocessing was performed including inter-slice time and motion correction, spatial gaussian smoothing (FWHM 0.58 mm), low pass filtering at 0.1 Hz and regression of the global mean. Brain voxels were labeled individually for each animal as belonging to 211 pain related brain structures based on the mouse atlas from Franklin and Paxinos3. For RS data analysis the average time course of each seed region was correlated with every voxel in the brain. After defining the FDR corrected significant correlation voxels an asymmetric correlation matrix was created for each subject using for each seed region the mean significant correlation values of all brain structures (MSRA)4. Resulting group average networks were thresholded at K=10 (resulting in same density, on average 10 connections per node). Group average network communities were detected using a heuristic method based on modularity optimization5. Additionally, on those networks small world index σ6 and the node specific graph-theoretical parameters degree, clustering coefficient, average shortest path length7,and hub score8 were calculated per animal. To assess group specific effects a two factor ANOVA (treatment, brain structures) with interaction was performed on node specific graph-theoretical parameters. Differences in connectivity strength between groups were calculated using network based statistics (NBS)9.Results
First, it appears that the overall effectiveness of information flow in
Poly(I:C) mice was intact. We did not observe differences in σ, and also the hub
functionality was similar between both groups. However, analysis of node
specific community association (Fig. 1) and connectivity strength (Fig. 2)
revealed significant differences. Significant increases in connectivity
strength could be found mainly in limbic circuits (amygdala, habenulae/septum,
basal ganglia, and hypothalamus), brainstem-cerebellum connections, and between
visual/auditory cortex and structures of the posterior association as well as
somatosensory cortex. However, the thalamic connections, especially to the
cortex, and somatosensory to cerebellum were significantly weakened in MIA
offspring (Fig. 2). These changes strongly suggest a weakening in
cortico-limbic connectivity. Referring to resting state networks derived from
ICA analysis known especially from human10 but also from rodent11
studies, dominant connectivity modulation could be observed within the saliency,
the sensorimotor and the default mode network (Fig. 2A).
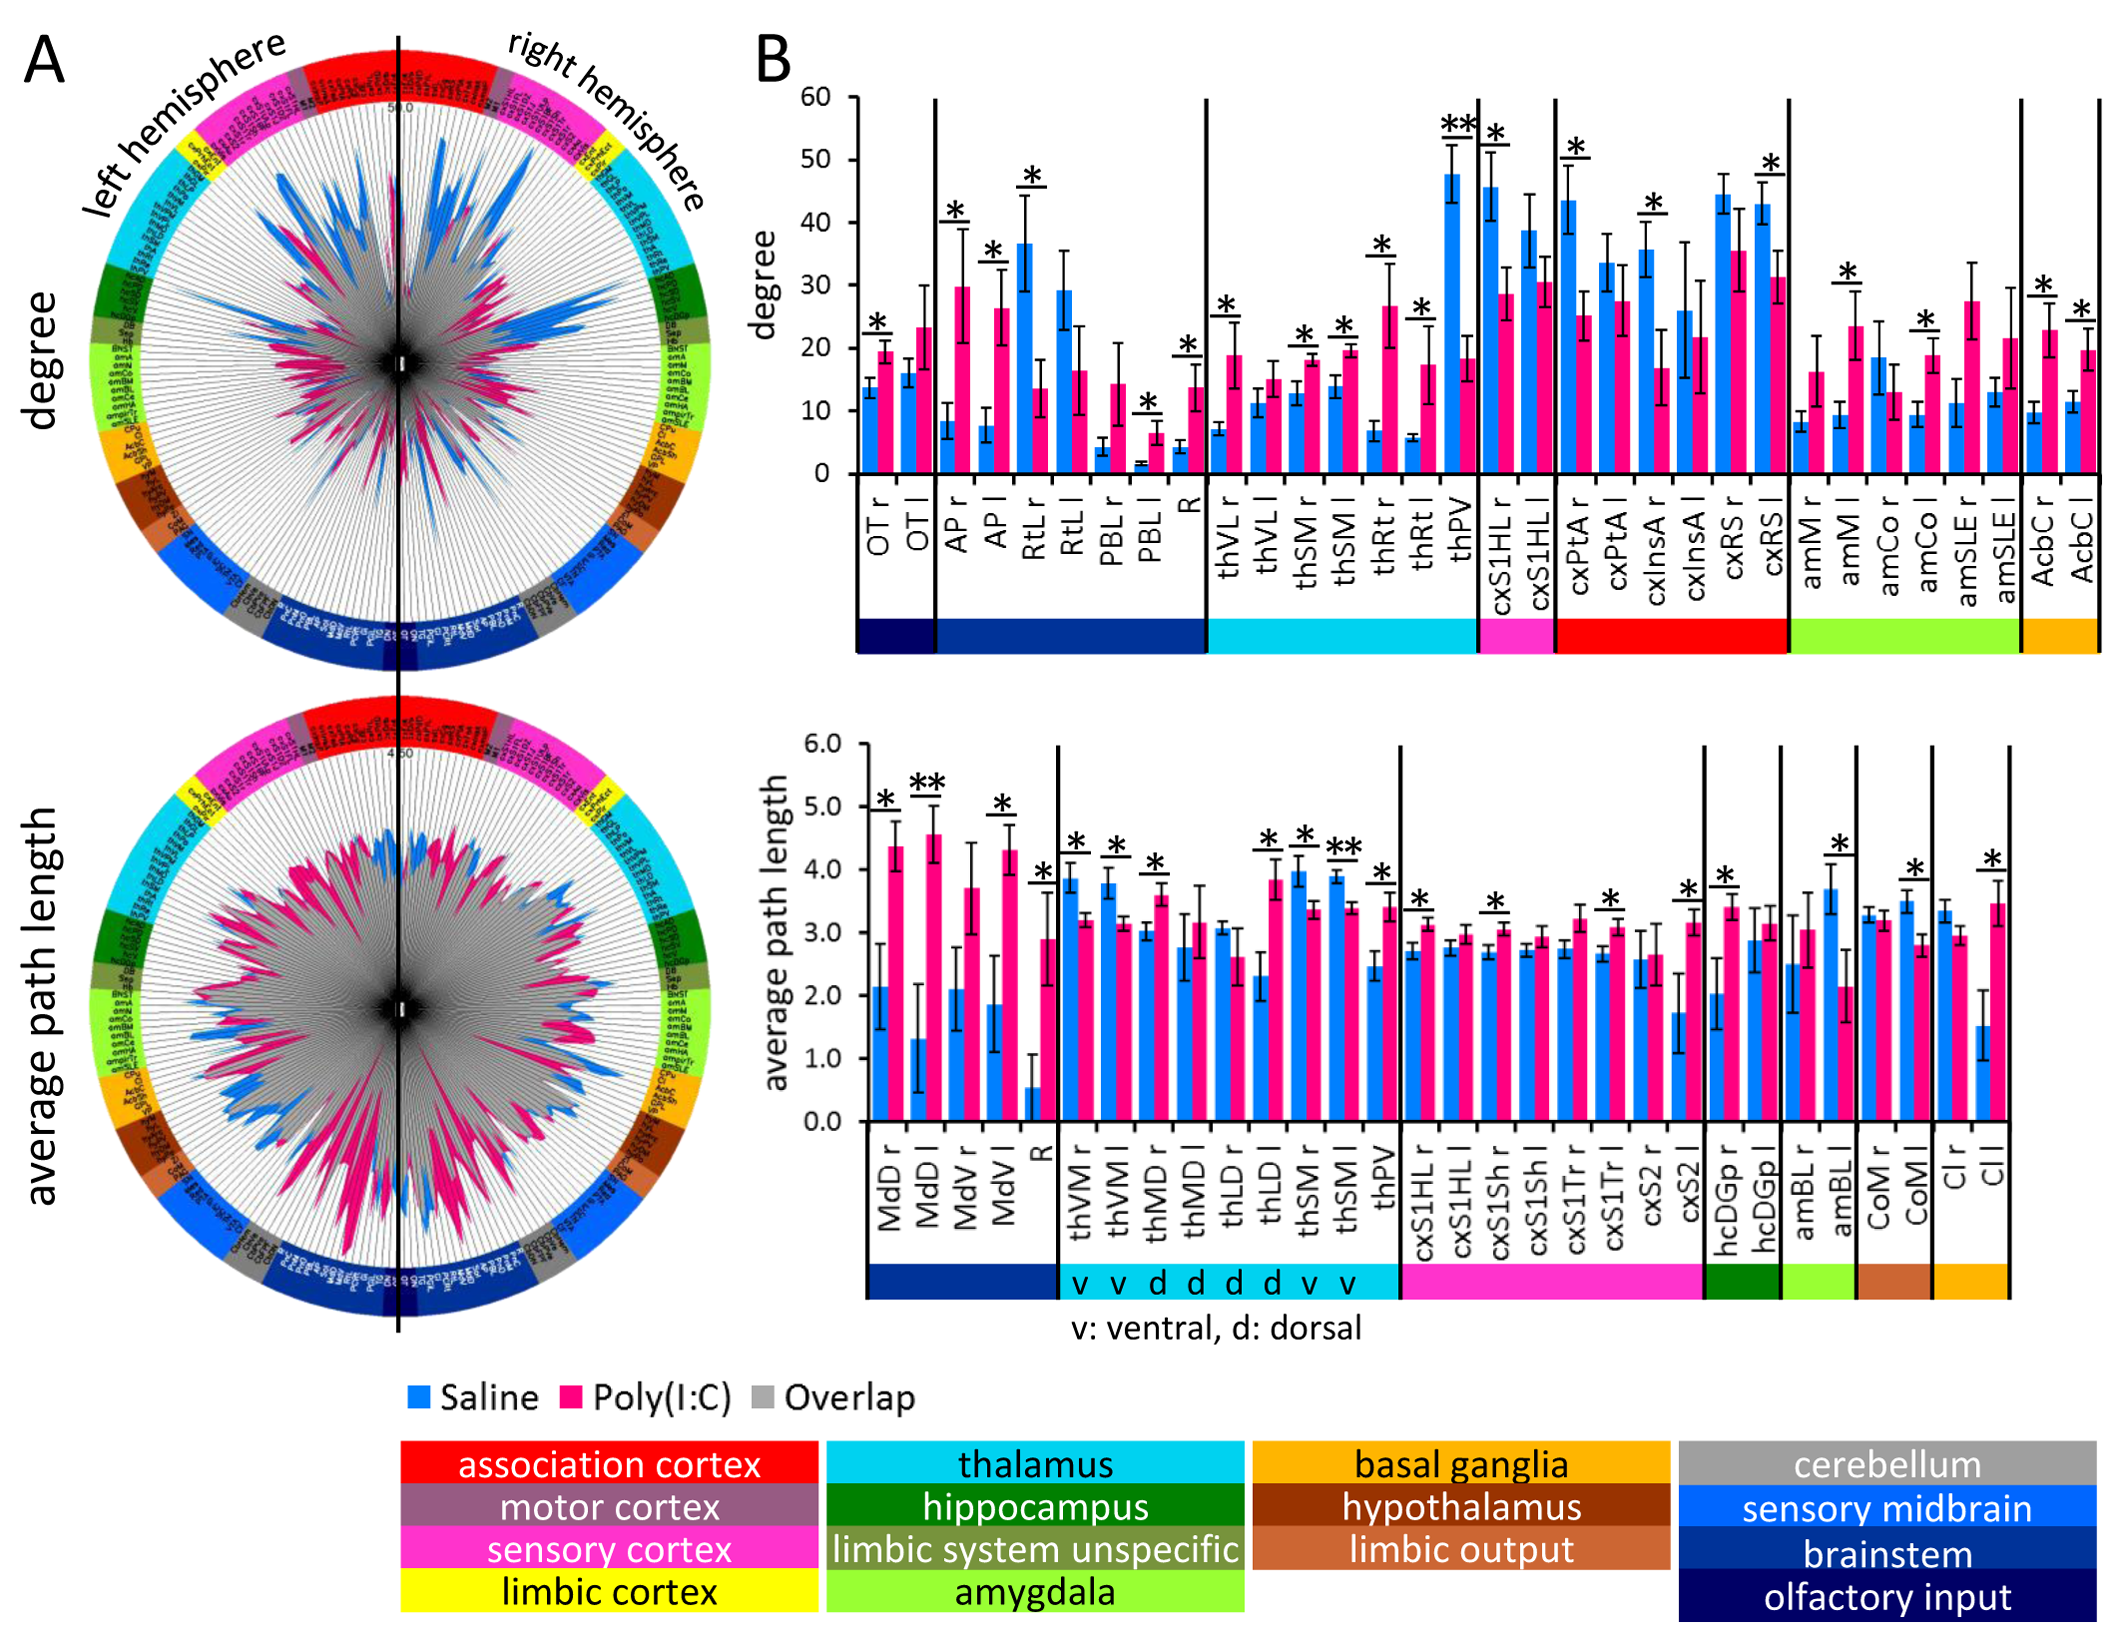
ANOVA on node specific graph-theoretical parameters revealed a treatment
effect only in average shortest path length and only degree showed significant
interactions (Table 1). Therefore, clustering coefficient and hub score did not
account for group differences between RS of Poly(I:C) offspring and control
animals. Degree was enhanced in olfactory input, brain stem, amygdala, nucleus
accumbens, and in thalamus and decreased in paraventricular thalamus, primary
somatosensory cortex, insula, parietal association and retrosplenial cortex
(Fig. 3A). Path length was especially enhanced in structures of brain stem
(medulla) and sensory cortex indicating enhanced segregation of these brain
areas. In general dorsal thalamic structures showed increased and ventral
decreased path length (Fig. 3B). Again, all these findings point towards higher
segregation of cortical-limbic functional connectivity due to MIA.Discussion
The remarkable dysfunction in cortical-limbic connectivity circuits in Poly(I:C) mice is particularly noteworthy in light of the well-documented alterations in the cortical-limbic mood-regulating circuitry in patients suffering from mood disorders12,13. The observed hyper-connectivity within limbic circuits, encompassing the amygdala, habenulae/septum, basal ganglia, and hypothalamus in Poly(I:C) mice may be considered a result of deficient top-down inhibition by cortical areas resulting from the aberrant cortico-limbic connectivity. The strengthened brainstem-cerebellum, intra-brainstem and intra-cortical connections could reflect adaptive responses indicating functional rearrangements in response to the neurodevelopmental insult of MIA.Acknowledgements
This work was supported by the Austrian Science Fund (stand-alone project P 27520 to D.D.P), BMBF NeuroRad (02NUK034D) and BMBF NeuroImpa (01EC1403C) to A.H. and “Verein unser Kind” to A.B. We thank Johannes Kaesser, Jutta Prade and Sandra John for their excellent technical support.References
1. Meyer U, Nyffeler M, Yee BK, Knuesel I, Feldon J. Adult brain and behavioral pathological markers of prenatal immune challenge during early/middle and late fetal development in mice. Brain Behav Immun. 2008;22(4):469–486.
2. Reisinger SN, Khan D, Kong E, Berger A, Pollak A, Pollak DD. The poly(I:C)- induced maternal immune activation model in preclinical neuropsychiatric drug discovery. Pharmacol Ther. 2015;149:213–226.
3. Franklin KBJ, Paxinos G. The Mouse Brain in stereotaxic coordinates. Academic Press, New York, 3 Ed. 2008
4. Kreitz S, de Celis Alonso B, Uder M, Hess A. A New Analysis of Resting State Connectivity and Graph Theory Reveals Distinctive Short-Term Modulations due to Whisker Stimulation in Rats. Front Neurosci. 2018;12:334.
5. Blondel VD, Guillaume JL, Lambiotte R, Lefebvre E. Fast unfolding of communities in large networks. J Stat Mech. 2008:10008–10020.
6. Watts DJ, Strogatz SH. Collective dynamics of 'small-world' networks. Nature 1998;393(6684):440-442.
7. Sporns O. Network attributes for segregation and integration in the human brain. Curr Opin Neurobiol. 2013; 23:162–171.
8. Kleinberg JM. Hubs, authorities, and communities. Acm Comput Surv. 1999; 31.
9. Zalesky A, Fornito A, Bullmore ET. Network-based statistic: identifying differences in brain networks. NeuroImage 2010;53(4):1197-1207.
10. Raichle ME. The restless brain. Brain Connect. 2011;1:3–12
11. Becerra L, Bishop J, Barmettler G, Kainz V, Burstein R, Borsook D. Brain network alterations in the inflammatory soup animal model of migraine. Brain Res. 2017;1660:36–46.
12. Ketter TA, Kimbrell TA, George MS, Dunn RT, Speer AM, Benson BE, Willis MW, Danielson A, Frye MA, Herscovitch P, Post RM. Effects of mood and subtype on cerebral glucose metabolism in treatment-resistant bipolar disorder. Biol Psychiatry. 2001;49(2):97–109.
13. Anand A, Li Y, Wang Y, Lowe MJ, Dzemidzic M. Resting state corticolimbic connectivity abnormalities in unmedicated bipolar disorder and unipolar depression. Psychiatry Res. 2009;171(3):189–198.
Figures
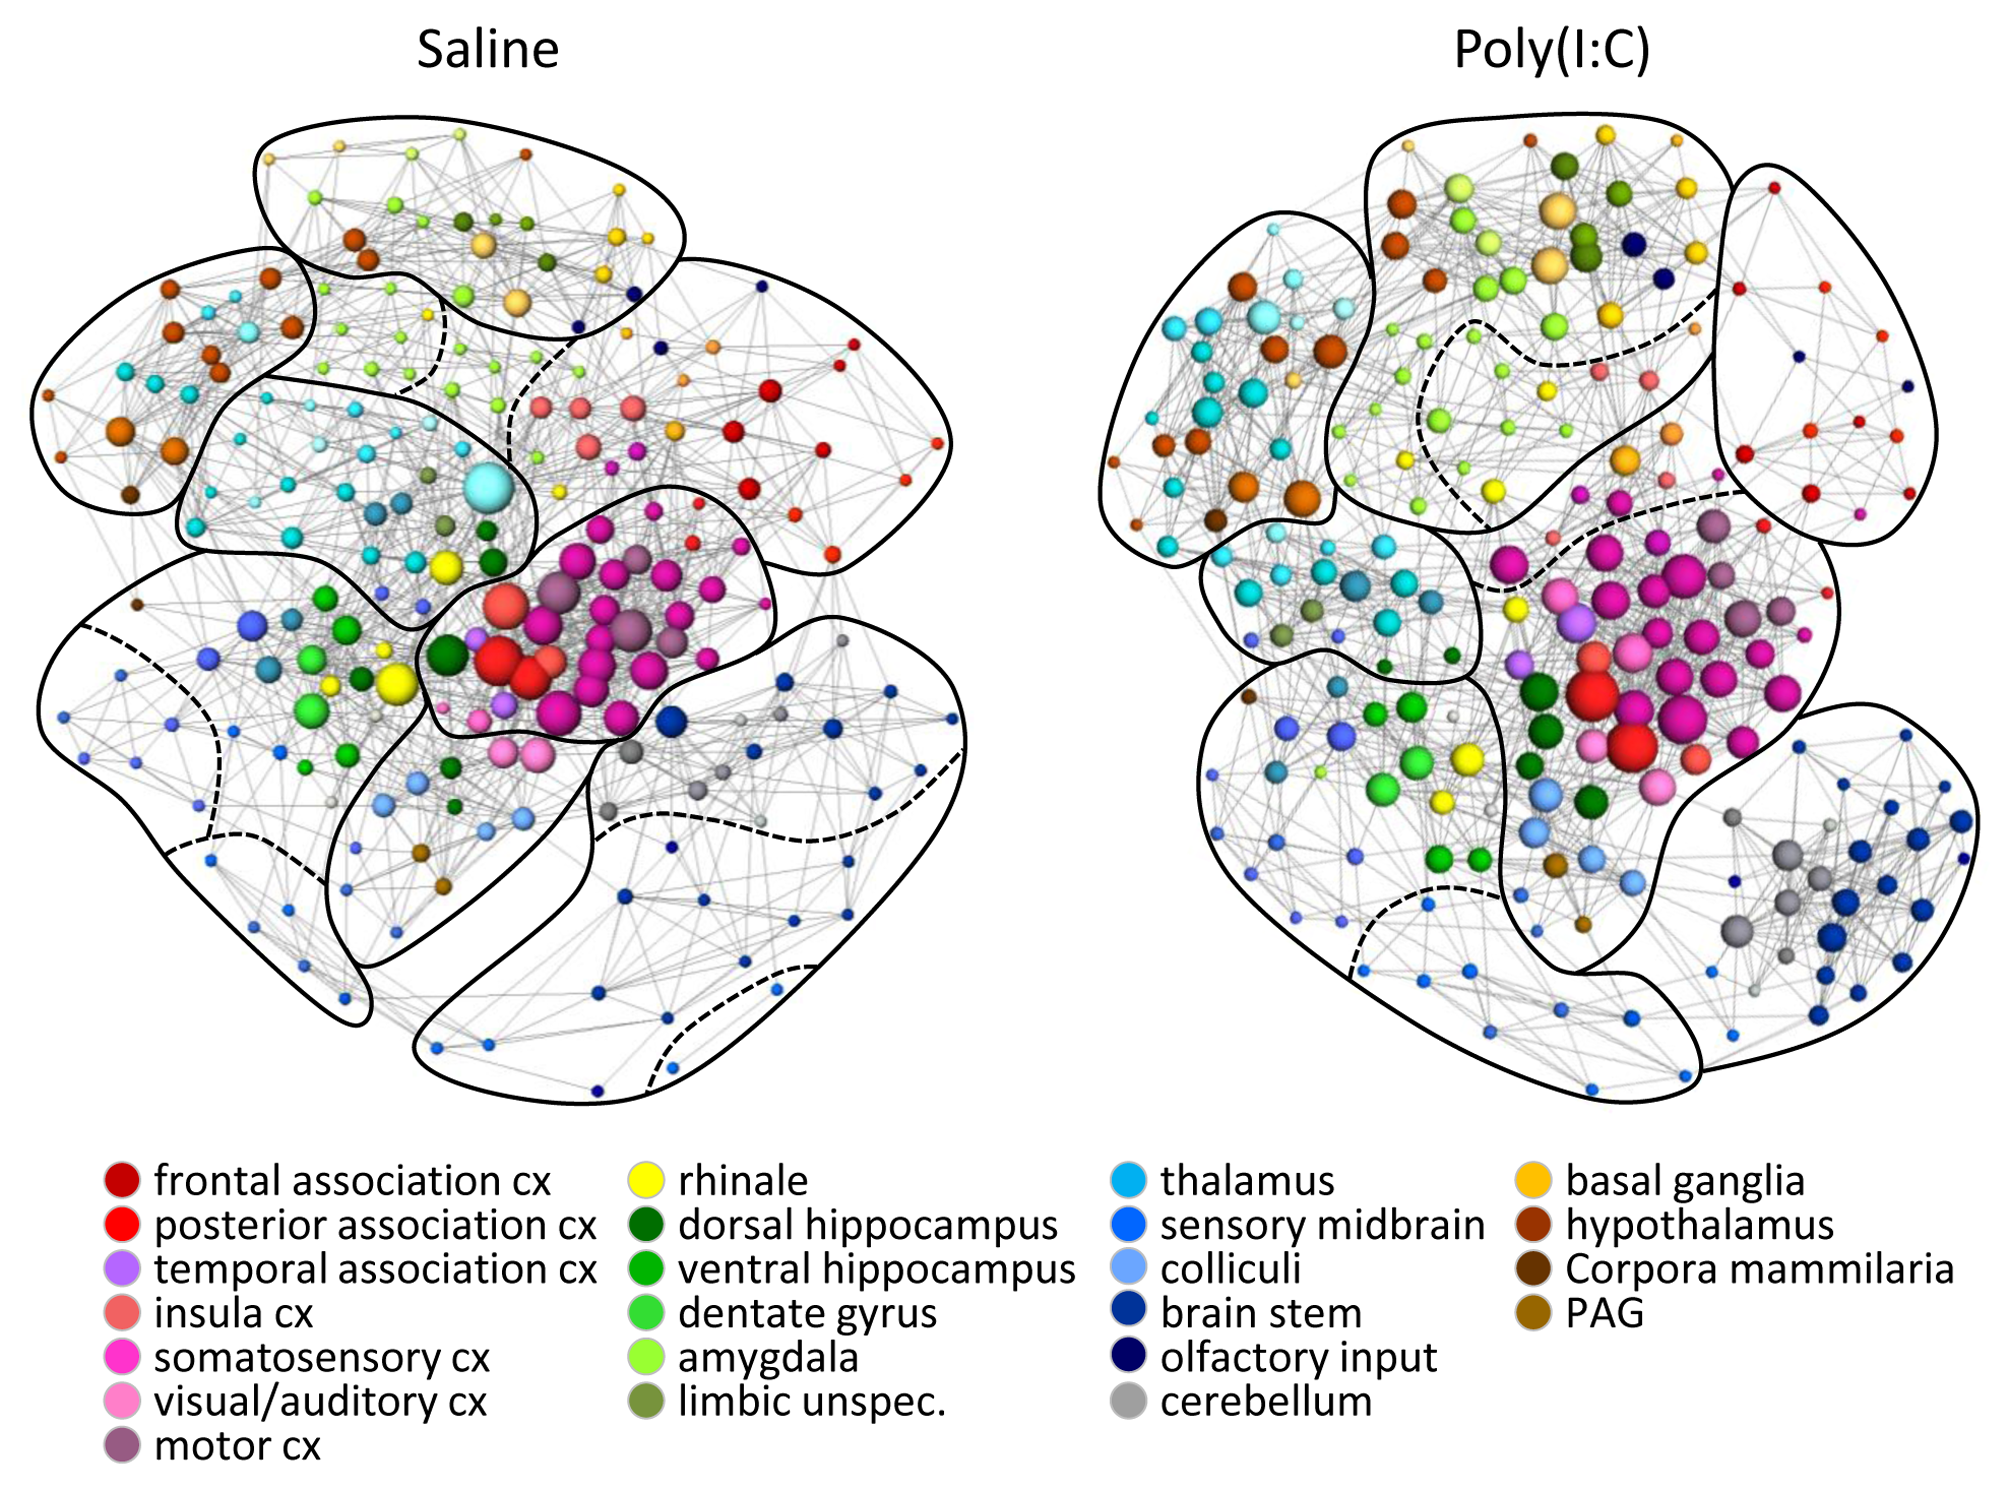
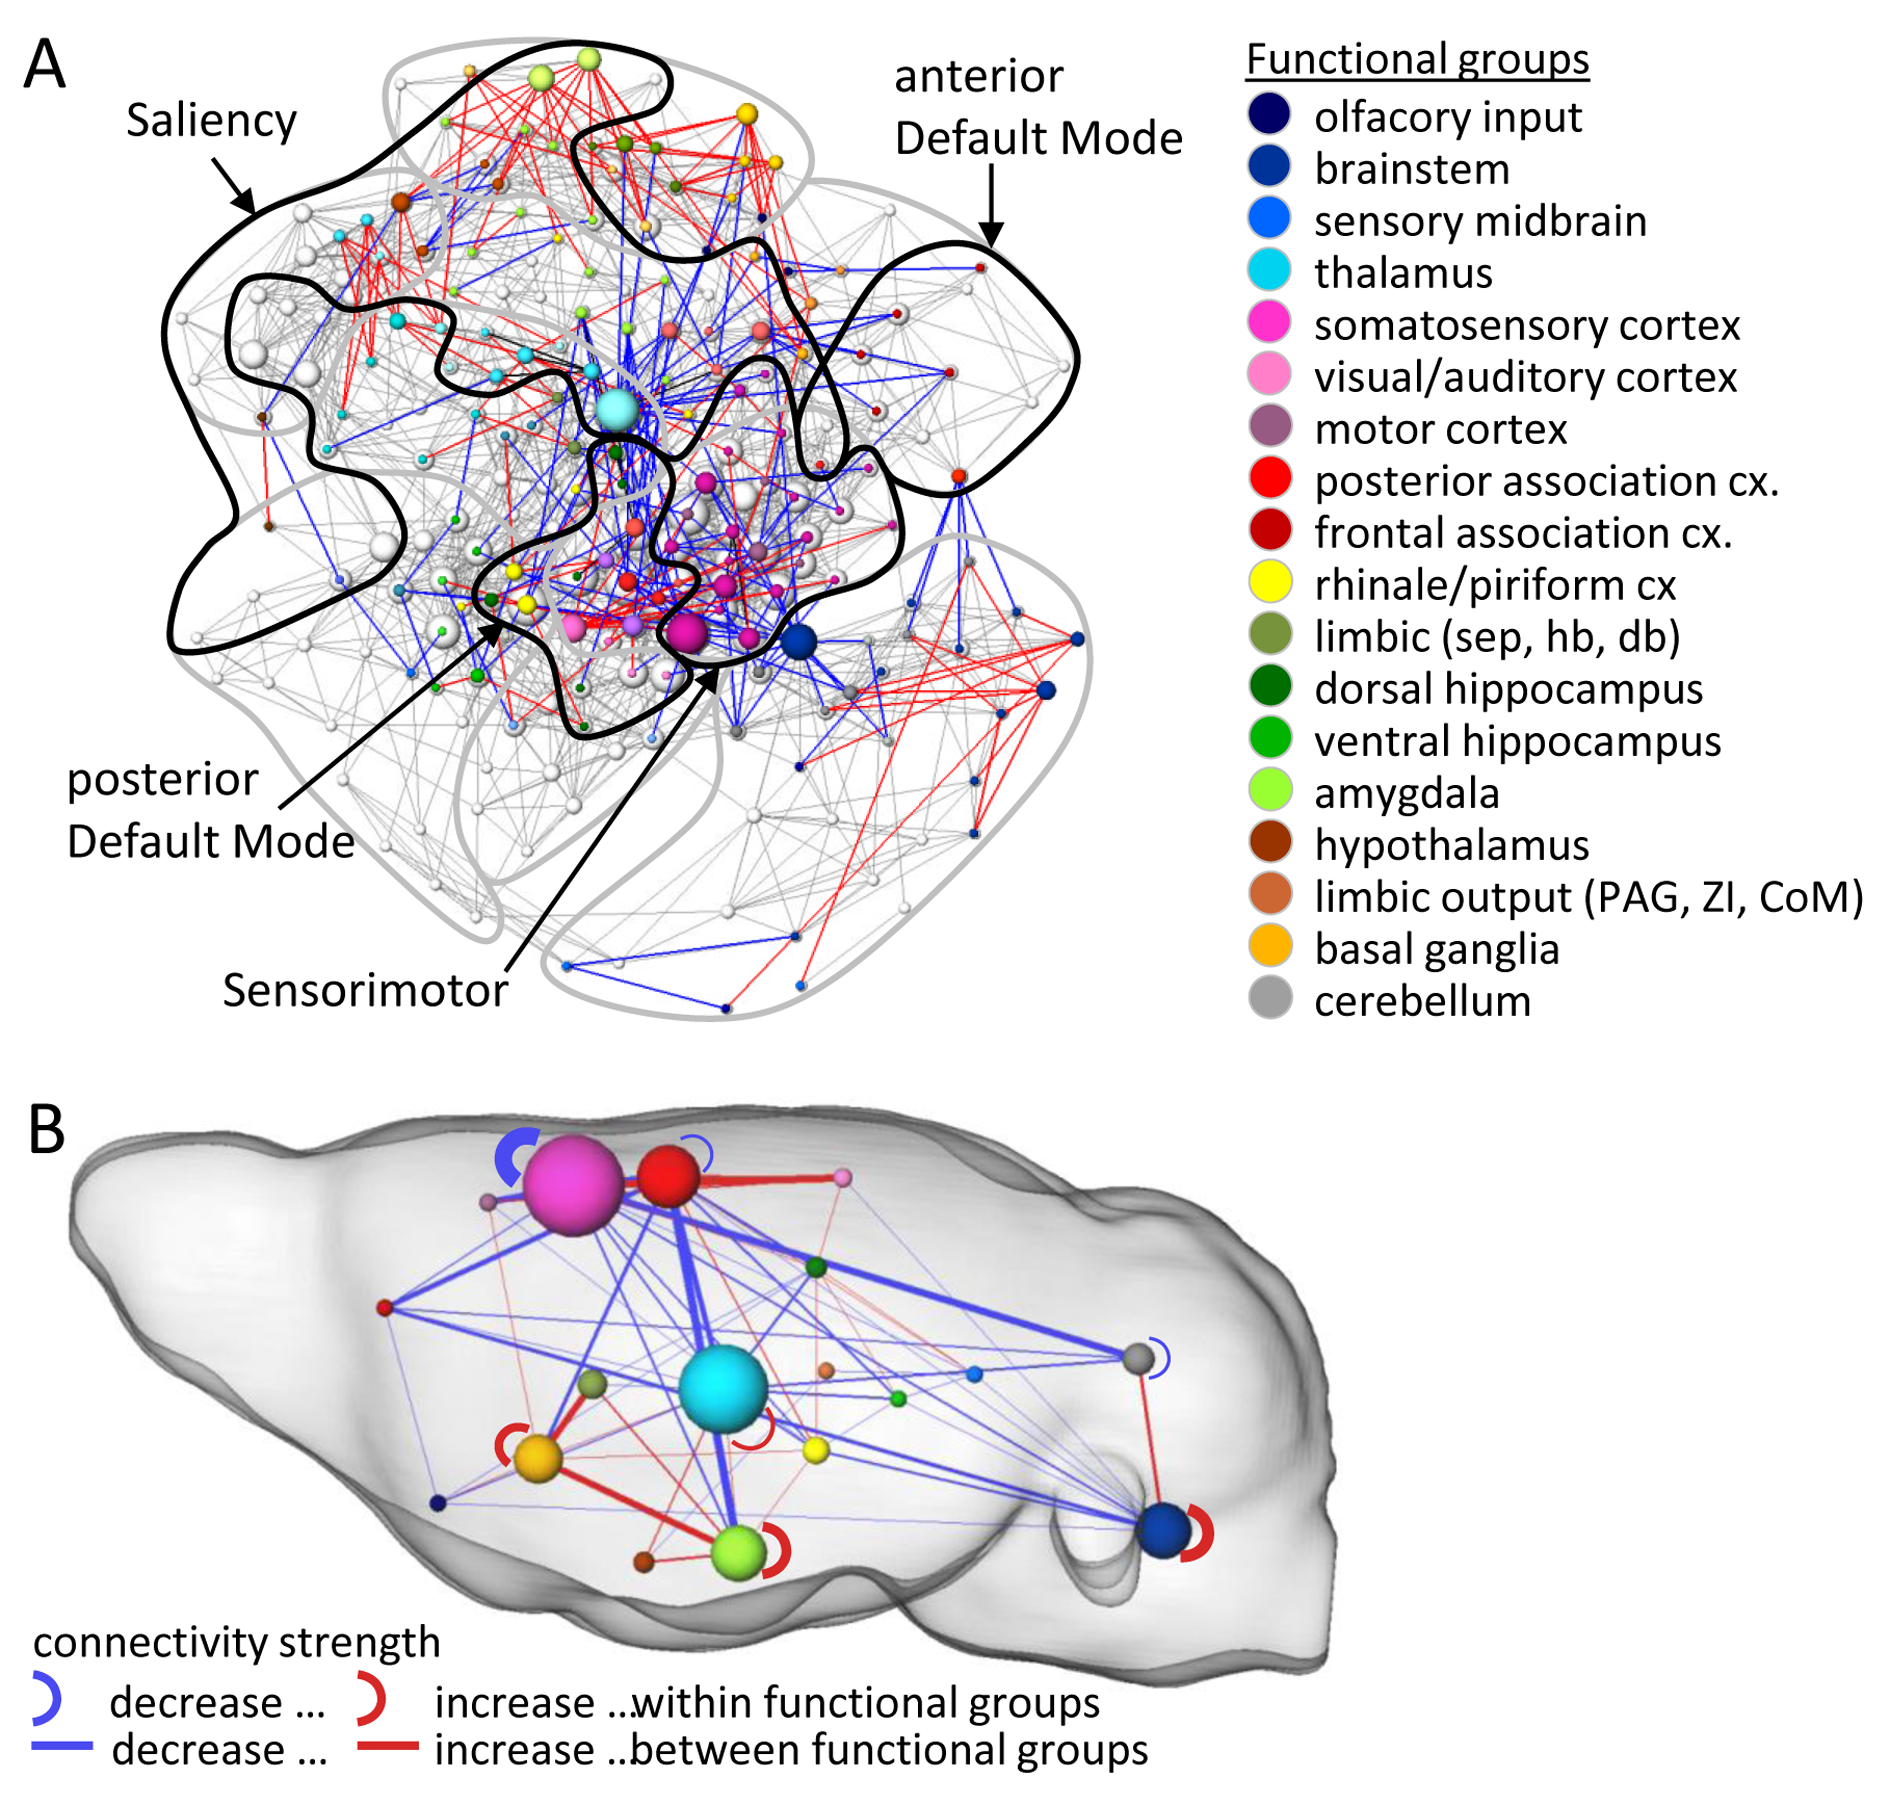

Table 1: ANOVA results for resting state network node parameters.
1 Since degree and hub score are normalized to the same mean for both experimental groups, treatment effect F-value is 0.
* significance p<0.05, highlighted bold