0886
Functional connectivity predicts individual longitudinal development in inhibitory control ability: a 5-year follow-up study1Brainnetome Center, Institute of Automation, Chinese Academy of Sciences, Beijing, China, 2National Laboratory of Pattern Recognition, Institute of Automation, Chinese Academy of Sciences, Beijing, China, 3University of Chinese Academy of Sciences, Beijing, China, 4CAS Center for Excellence in Brain Science and Intelligence Technology, Institute of Automation, Chinese Academy of Sciences, Beijing, China, 5The Clinical Hospital of Chengdu Brain Science Institute, MOE Key Lab for Neuroinformation, University of Electronic Science and Technology of China, Chengdu, China, 6The Queensland Brain Institute, University of Queensland, Brisbane, Australia
Synopsis
Inhibitory control ability (IC) is related to adolescence impulsive and risky behaviors. It will develop into adulthood, but its trajectory has great individual difference. What brain features affect the individualized development of IC? Here we use longitudinal data and predictive model to predict stop signal reaction time (SSRT) change in 5 years with 14-year-old stop signal task functional connectivity (FC). We find that 14-year-old FCs between ventral attention and subcortical networks can predict the development tendency of IC, even excluding the effect of 14-year-old SSRT. This may help to make early intervention in the development of adolescent IC.
INTRODUCTION
Inhibitory control (IC) refers to the ability to suppress inappropriate actions. Poor IC is related to impulsive and risky behaviors, such as substance misuse. IC does not mature until adulthood, and there is great individual difference in its developmental trajectory1. However, existing research in adolescent neurocognitive development has largely focused on averages, which obscures meaningful individual variation2. Studying individualized development of cognitive ability may be especially beneficial in adolescence, a developmental period of rapid change characterized by mental health vulnerability, but also opportunities for intervention3. Here we use longitudinal data and predictive model to explore which brain features can affect the individualized development of IC, and this may help to make early intervention in adolescence IC development.METHODS
Stop signal task (SST) is often used to study the ability of IC and stop signal reaction time (SSRT) calculated from SST is extensively used as a clinical index of IC. Particularly, participants with lower SSRT have higher ability of IC. We used data from the IMAGEN project4, in which SST functional MRI data were acquired at 14 (baseline, BL) and then 19 years old (follow-up, FU). Tracking algorithm was used in SST to produce approximately 50% unsuccessful inhibition trails5. After screening, 330 subjects with BL SST fMRI and BL&FU SSRT survived. Here, we predict ΔSSRT (BL SSRT – FU SSRT) with BL SST functional connectivity (FC). As for the index to be predicted, that is ΔSSRT, we regressed out covariates including BL SSRT, age latency and other related BL covariates. We used ΔSSRT residual as the final index to study the unique effects of brain on development of IC. As for the feature, we used FCs defined by Power’s atlas6, which has 264 brain regions with each region belonging to one of the 13 networks. Cerebellum network were removed for it was not fully covered in some subjects. To reduce over-fitting, we used FCs within one network (12 models) or between two different networks (66 models) as features. Partial least square (PLS) were used to learn the relationship between FC and ΔSSRT residual. 10-fold cross-validation (CV) were used to reduce over-fitting and the 10 fold CV were repeated for 100 times. Pearson correlation (r) between actual and predicted index was used to evaluate the prediction performance.RESULTS
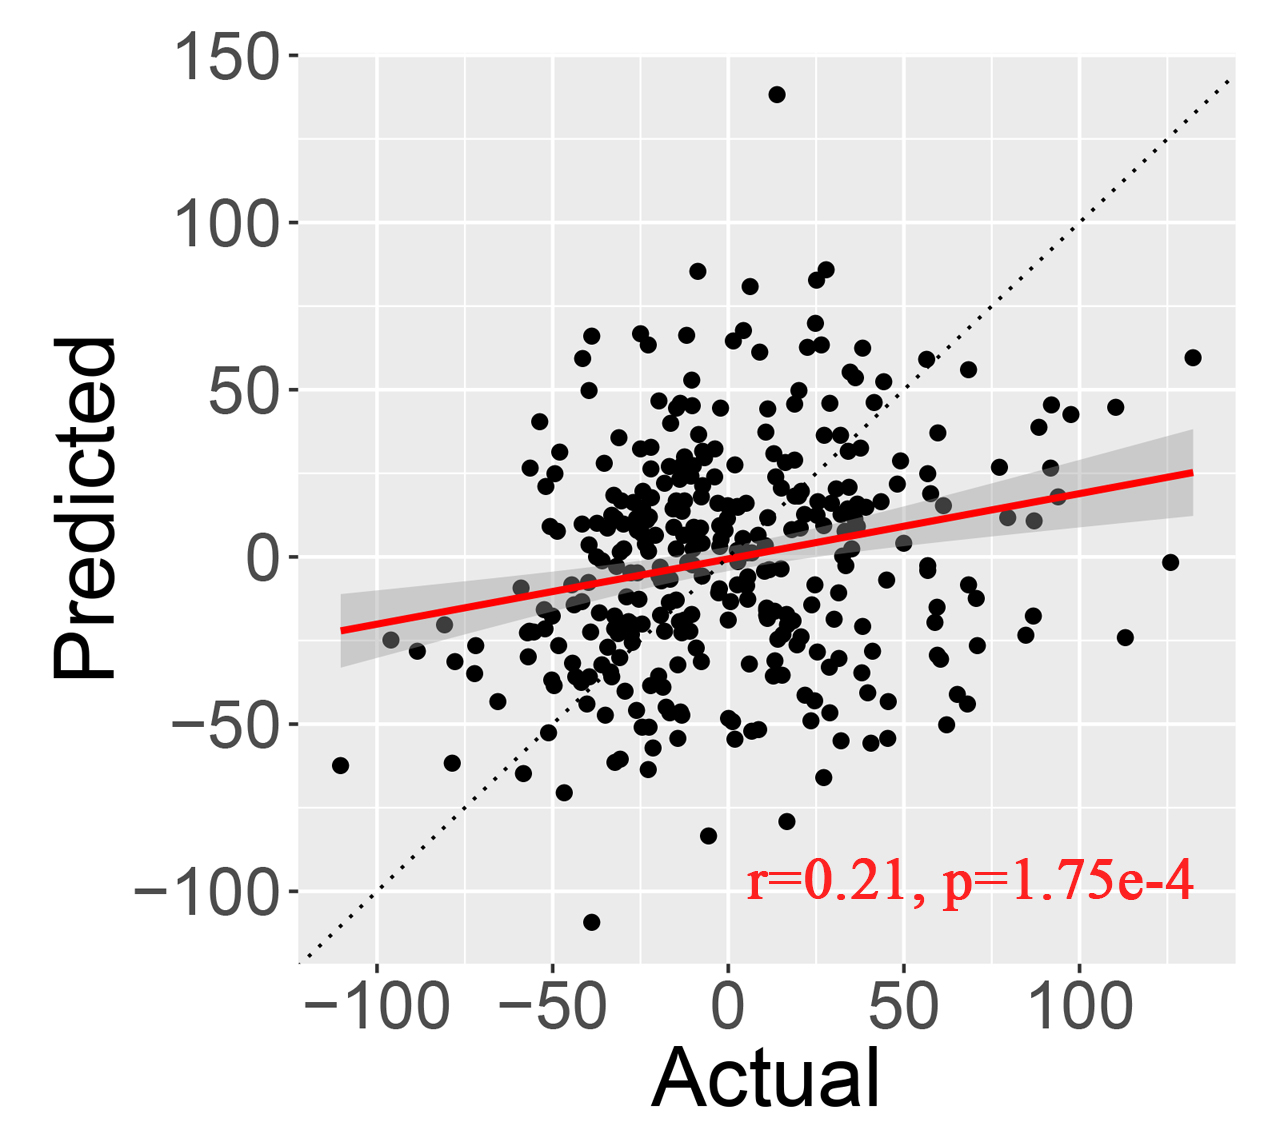
The ages were 14.44±0.43 years and 19±0.68 years at BL and FU respectively, with a mean latency of 4.56 years. The proportion of failed stop trials across all the 330 subjects was very close to 50% in both BL and FU, which implied that the tracking algorithm worked quite well. On average, there was a marginally small but significant increase in SSRT at FU (BL SSRT: 207±36ms, FU SSRT: 216±42ms, paired t-test, t (329) = -3.9, P = 1.16e-4). However, the developmental tendency of SSRT differs a lot across individuals, from the perspective of both direction and amplitude (Figure 1A). There was a significant correlation between BL SSRT and ΔSSRT (r = 0.5, P = 7.66e-22). FCs were calculated within each network or between two networks, generating 78 groups of features. Each group of features were used to predict the ΔSSRT residual separately, and the prediction performance (r) of each model was shown in Figure 2. The r values of all models were below 0.13 except for the model using FCs between ventral attention (VAN) and subcortical networks (Subc). The r values of VAN-Subc model was 0.21±0.02 (P = 1.75e-4) as shown in Figure 3, which passed the Bonferroni correction (P = 0.05/78 = 6.41e-4). We performed 104 permutations to find the edges with statistically significant weights in PLS regression (two-tailed, P < 0.05). Finally, there were 7 significant FCs (Figure 4) and the most important nodes in prediction located in left putamen, right inferior frontal gyrus and right angular gyrus.DISCUSSION & CONCLUSION
The development trajectory of IC differs a lot across individuals from the perspective of direction and amplitude. Subjects whose ICs were high at BL tend to decrease in adulthood, and this implies that maturing at a very early stage may be detrimental to adult IC. FCs between VAN and Subc at BL can alone predict the development tendency of IC in 5 years, even excluding the effect of BL behaviors. Besides, rIFG, right angular gyrus in VAN and left putamen in Subc make the most important contribution in prediction. Previous studies showed that basal ganglia and rIFG are highly related to IC7,8. This finding may help to make early intervention of IC development in adolescence.Acknowledgements
No acknowledgement found.References
1. Harden, K.P. & Tucker-Drob, E.M. Individual differences in the development of sensation seeking and impulsivity during adolescence: further evidence for a dual systems model. Dev Psychol. 2011;47(3): 739 - 746.
2. Foulkes, L. & Blakemore, S.-J. Studying individual differences in human adolescent brain development. Nat Neurosci. 2018;21:315 - 323.
3. Rosenberg, M.D., Casey, B.J. & Holmes, A.J. Prediction complements explanation in understanding the developing brain. Nat Commun. 2018; 9:589.
4. Schumann, G., et al. The IMAGEN study: reinforcement-related behaviour in normal brain function and psychopathology. Mol Psychiatry 2010;15:1128 - 1139.
5. Whelan, R., et al. Adolescent impulsivity phenotypes characterized by distinct brain networks. Nat Neurosci. 2012;15: 920 - 925.
6. Power, J.D., et al. Functional network organization of the human brain. Neuron 2011;72(4):665 - 678.
7. Bari, A. & Robbins, T.W. Inhibition and impulsivity: behavioral and neural basis of response control. Progress in neurobiology 2013;108:44 - 79.
8. Aron, A.R., Robbins, T.W. & Poldrack, R.A. Inhibition and the right inferior frontal cortex: one decade on. Trends in cognitive sciences 2014;18(4):177 - 185.
Figures